BTCUSD Monthly — Cycle Low Forming, Continuation SetupFour halving cycles. Four brutal drawdowns. Four expansions that dwarfed the pain that came before them.
-86.96% into the 2015 low. -84.20% into 2018. -77.57% into the 2022 low. Each one felt like the end at the time. Each one was the reload.
This cycle's drawdown from the local high sits at -54.26%, the shallowest correction of the four. Price is now sitting directly on the long-term monthly MA that has marked every prior cycle low, the same MA that caught price in late 2015, early 2019, and late 2022 before each expansion phase began.
Walking this through CAP (Continuation Acceleration Protocol):
Gate one, the macro structure, favors bulls. Every prior test of this monthly MA after a multi-quarter drawdown resolved into markup, not breakdown. The higher-low sequence across cycles (2015 low, 2018 low, 2022 low, now) keeps the long-term Wave count intact rather than calling for a full cycle invalidation.
Gate two is the zone, and it's exactly here. The confluence of the monthly MA and the horizontal support built from the last several months of consolidation is the same type of zone that produced the 2,107% and 715% expansions off the prior two lows.
Gate three, the trigger, is NOT yet confirmed. Price is testing the zone, not breaking away from it. What confirms this is a monthly close back above the recent consolidation range with expanding volume. What invalidates this is a monthly close decisively below the current MA test, opening the door to a deeper flush before any low is in.
The pattern is diminishing in amplitude each cycle, shallower drawdowns, smaller percentage expansions, which is normal as the asset matures and market cap grows. That doesn't break the structure, it just means position sizing and patience matter more than they did in 2015.
Still a buy zone in my read either way given how cleanly this MA has held historically, but that's my judgment call layered on top of the setup, not something gate three has confirmed yet.
"The impediment to action advances action. What stands in the way becomes the way." — Marcus Aurelius
The wait at this level is the setup, not a delay from it.  Long
Long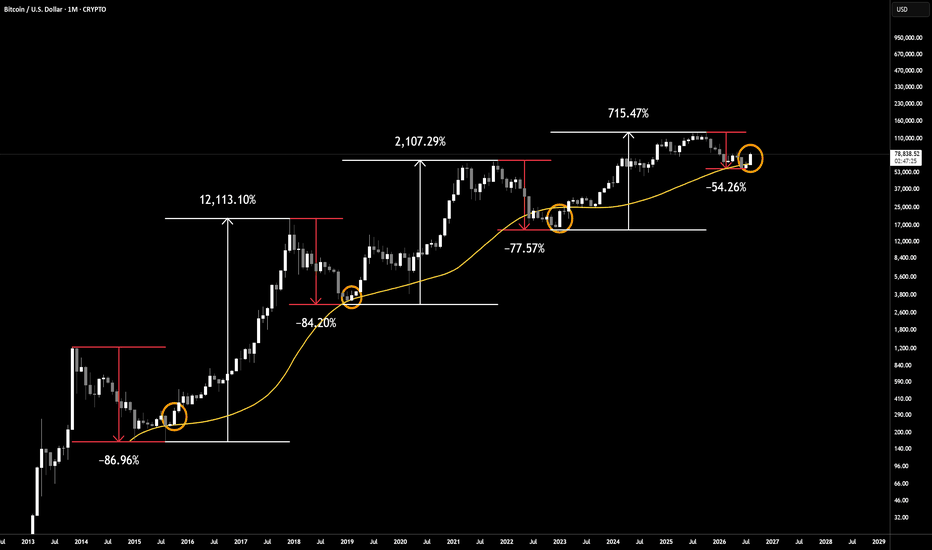
SUSHI Could Be Preparing for a BreakoutYello Paradisers! SUSHI is currently showing several bullish confluences, and the structure is becoming increasingly interesting from both a technical and risk-to-reward perspective.
💎SUSHIUSDT is forming a potential double-bottom pattern directly from the Daily FVG and the 0.5 Fibonacci retracement level. This combination already provides a strong technical reaction zone, but the multi-timeframe structure adds even more weight to the bullish scenario.
💎The Weekly, Daily, and 4H timeframes are currently showing bullish structure, while the 1H timeframe is also attempting to shift bullish following the current CHoCH. If this 1H bullish structure confirms, it would further increase the probability of a stronger bounce from the current area.
💎At the same time, price has formed a falling wedge pattern, while on the higher timeframe the broader structure resembles a bull flag. Both formations support the possibility of bullish continuation if buyers maintain control.
💎For a higher-quality entry and better risk-to-reward, we would prefer to see a pullback before considering any position. Chasing price at current levels would reduce the quality of the setup, so patience remains important.
💎For upside targets, the main areas of interest are located above the 4H resistance and the Daily resistance levels. These zones should be monitored closely if bullish momentum continues.
💎For invalidation, the key area sits below the 1H support and the Daily FVG. Based on the current structure, the most logical invalidation level is around $0.1808. A confirmed candle close below this level would significantly weaken the bullish scenario and invalidate the current setup.
💎As always, we let price confirm the direction before taking action. The confluences are building, but disciplined execution and proper risk management remain the priority.
Strive for consistency, not quick profits. Treat the market as a businessman, not as a gambler.
MyCryptoParadise
iFeel the success🌴  Long
Long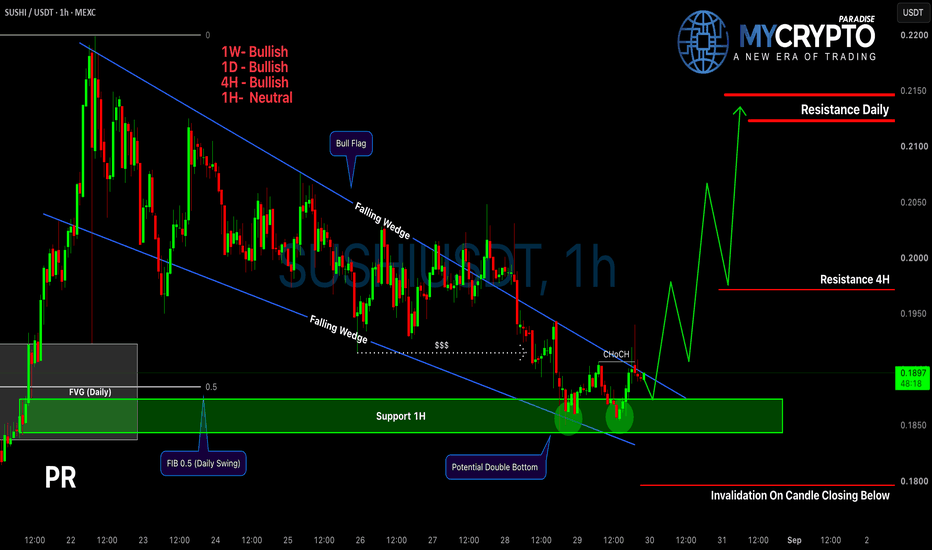
Breakout From Accumulation — Is the Next Expansion Leg Starting?Good Morning Folks,
What a week. Love this action. This is why we trade!
I have updated my idea and will give you the breakdown of what I see currently.
What I’m Seeing
Looking at the **daily and weekly charts together**, I think Bitcoin is at a much more interesting point than it was during my previous analysis.
My original idea was that the **60k–62k area could become an accumulation zone**, as selling momentum was weakening despite Bitcoin continuing to test the lows.
That zone has held.
Now Bitcoin has pushed aggressively out of the **62k–65k consolidation area**, with price trading around **72k**. More importantly, the breakout came with a significant increase in volume and momentum.
To me, this is the first meaningful evidence that buyers are beginning to take control again.
Daily Chart — The Breakout
The daily chart is where the change in character is most obvious.
Bitcoin spent weeks consolidating around **62k–65k**, repeatedly holding the current volume-based support.
Instead of breaking lower, price compressed.
Now we've seen an impulsive move out of that range toward **72k**, accompanied by roughly 3x normal volume** on the breakout candle.
That matters to me.
A breakout on weak volume would be much easier to question. A breakout accompanied by expanding volume suggests there is genuine participation behind the move.
Momentum has also moved sharply back into positive territory, which supports the idea that this could be the beginning of an expansion rather than simply another small bounce.
The First Major Test: 73k–76k
I'm bullish on the breakout, but Bitcoin is now moving directly into an important area.
The 73k–76k region** was previously a major volume-based support area.
After Bitcoin broke below it, that support effectively became potential resistance.
So I don't necessarily expect price to move straight through this level.
This is where I think we could see the first meaningful pullback.
If Bitcoin gets rejected around 73k–76k, but then comes back and holds somewhere around 63k–66k, I would view that as constructive rather than immediately bearish.
It would give us:
breakout → resistance test → higher low → continuation
That would be a much healthier structure for a larger move higher.
Weekly Chart — Still Some Work to Do
The weekly chart keeps me from becoming overly bullish too early.
Bitcoin has bounced strongly from around 60k, but price is still below the declining weekly trend/average shown on my chart, currently around the upper-70k area.
So while the daily structure is improving rapidly, the weekly chart hasn't completely confirmed a long-term trend reversal yet.
That's an important distinction.
Daily: turning bullish.
Weekly: recovering, but still repairing the larger bearish structure.
What I want to see next is Bitcoin reclaim the mid-to-upper 70k region and eventually establish itself back above that declining weekly level.
If that happens, the probability of this being more than a relief rally increases significantly.
Momentum Is Starting to Change
This is probably the most interesting part of the setup for me.
On the weekly chart, momentum remains below zero, but the downside momentum has been contracting.
In other words, sellers were still technically in control, but they were becoming progressively less aggressive.
Now the daily chart is showing the opposite:
* Momentum has flipped positive.
* Buying pressure has expanded sharply.
* Volume increased significantly on the breakout.
* Price escaped a multi-week consolidation.
That combination suggests the market may be transitioning from **seller exhaustion → accumulation → expansion**.
It's still early, but this is exactly the type of behavior I wanted to see after the previous analysis.
The Pullback I'm Watching
I don't necessarily want to chase Bitcoin after a large breakout candle.
I'd rather see how price reacts once it reaches 73k–76k.
My preferred scenario would be:
72–76k resistance test → pullback → 63–66k holds → continuation higher.
The key is what happens during that pullback.
If price comes down on declining volume and sellers struggle to push Bitcoin back through the breakout zone, that would strengthen my bullish thesis considerably.
It would suggest that the previous sellers are no longer controlling the market and that buyers are willing to defend higher prices.
---
Trend-Based Extension
If Bitcoin successfully holds the breakout and eventually clears the 73k–76k resistance, I think the chart opens up considerably.
The first major confirmation would be reclaiming the weekly trend area around 77k–80k.
Above there, I would start looking toward the mid/high-80k region, with roughly 88k–90k being a reasonable trend-based extension area on my chart.
I'm not treating that as a guaranteed target.
It's where I think price could naturally gravitate **if the current breakout develops into a genuine trend reversal**.
What Would Make Me Wrong?
The most important level remains the area Bitcoin just broke out from.
If Bitcoin rallies into resistance and then completely loses 62k–63k, I would become much more cautious.
A move back inside the previous range would suggest the breakout failed.
A decisive weekly breakdown beneath approximately **60k** would be even more important because that would invalidate much of my accumulation thesis and reopen the possibility of another leg lower.
So for me:
Above 62k–65k: constructive.
Above 73k–76k: increasingly bullish.
Above ~80k: much stronger weekly confirmation.
Below ~60k: thesis needs to be reassessed.
Fundamentals I'm Watching
The technical picture is improving, but I also want the fundamental backdrop to support the move.
For Bitcoin, I'm watching institutional/ETF demand, broader liquidity conditions, Federal Reserve expectations, the U.S. dollar and Treasury yields, and general risk appetite**.
The important part isn't any single headline. It's whether capital continues flowing toward Bitcoin while price is trying to establish a higher-timeframe bottom.
If institutional demand remains strong while monetary conditions become more supportive of risk assets, that would provide a much stronger fundamental foundation for the technical breakout.
On the other hand, renewed liquidity tightening, sharply higher yields, dollar strength, or sustained institutional outflows could make the breakout much harder to maintain.
My Bias
I'm now **cautiously bullish**, but I don't think the weekly reversal is fully confirmed yet.
The 60k–62k accumulation idea has held, seller momentum weakened, Bitcoin consolidated instead of continuing lower, and now we've finally seen a high-volume breakout.
That's a meaningful change.
The next question isn't whether Bitcoin can bounce anymore — it already has.
The question now is whether Bitcoin can turn this bounce into a new trend.
For me, 73k–76k is the first test, 63k–66k is the pullback area I want defended, and a reclaim of roughly 80k would be the bigger confirmation that the higher-timeframe trend is changing.
If those pieces fall into place, I think the path toward 88k–90k becomes considerably more realistic.
Good luck to all trade safely! Long 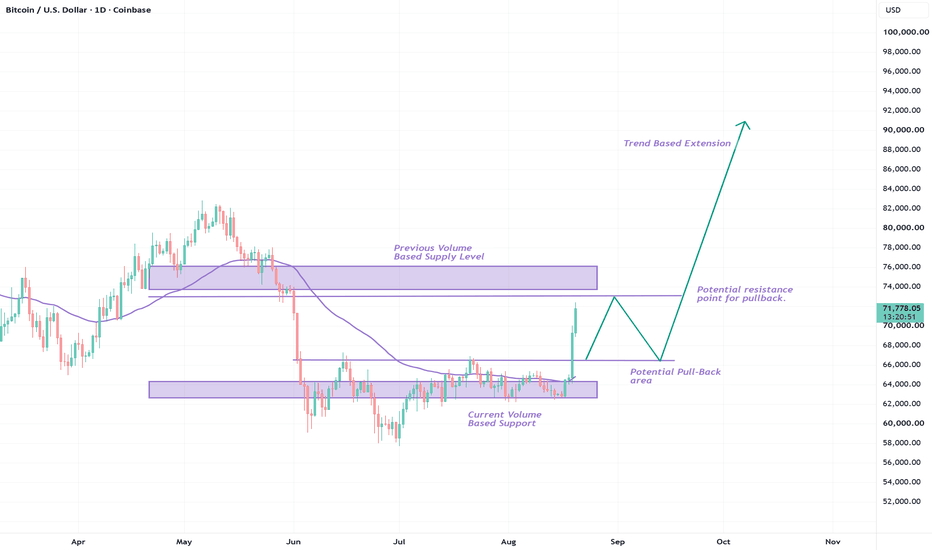
Can This Fresh Drop-Base-Rally Zone Still Influence Price?SOLUSDT is currently near an identified Demand Zone . This technical area is being observed because it originated from a strong imbalance following a Drop-Base-Rally (DBR) structure.
From a market-structure perspective, a Drop-Base-Rally formation can be technically relevant because it represents a period of relatively brief consolidation following a decline and preceding a subsequent upward move. The base and the strength of the departure from that area may provide useful historical context when price later revisits the originating zone.
Why is this Demand Zone technically significant?
The identified area has several characteristics commonly examined during supply and demand analysis:
• Fresh zone: The area has not been significantly revisited since its formation, which may preserve its relevance as a historical area for observation.
• Drop-Base-Rally structure: Price declined into a base before subsequently moving higher, creating a recognisable demand-zone structure.
• Strong leg-out: The departure from the base produced a noticeable upward imbalance, which may indicate a significant shift in market participation during that move.
• Quality basing structure: The consolidation within the area provides a clearly identifiable structural origin for the subsequent movement.
• Multiple time frame context: The significance of a zone may be evaluated differently when viewed across higher and lower timeframes. Broader market structure, swing behaviour and lower-timeframe price development can provide additional context.
What may happen if price interacts with the zone?
When price revisits a previously identified demand area, traders often observe how price behaves within and around the zone rather than assuming that the historical structure will necessarily produce the same reaction again.
One possible bullish scenario:
If price enters the demand area and subsequent price action shows evidence of buying interest or improving market structure, the zone may continue to influence price behaviour as an area of support.
Any such reaction would remain dependent on developing market conditions and confirmation from price action.
One possible bearish scenario:
If price moves through the demand zone with sustained selling pressure and the underlying structure is invalidated, the area may lose its previous technical relevance. In such circumstances, broader market structure and other historical technical areas may become relevant for further analysis.
Another possible scenario:
Price may remain within or around the zone without producing an immediate directional outcome. Consolidation, repeated testing, fluctuating momentum or temporary reactions are all possible forms of price behaviour around a historical demand area.
Multiple Time Frame Analysis Context
A zone identified on the 240-minute chart can be examined alongside broader and lower-timeframe market structure.
Higher timeframes may provide context regarding the broader trend, major swing points and larger technical areas. Lower timeframes may provide additional information about how price is behaving as it approaches or interacts with the identified 4H zone.
Multiple timeframe analysis does not provide certainty about future price direction. It is simply a method of observing the same market structure from different levels of detail.
Why price action confirmation matters
A historical demand zone represents an area of previous market activity rather than a guarantee of future behaviour.
For this reason, price action confirmation can be important when analysing how the market is responding to the zone. Observations may include:
• Changes in market structure
• Momentum behaviour
• Candle development
• Rejection or acceptance around the zone
• The strength and character of subsequent price movement
• Alignment or divergence between different timeframes
These observations may provide additional context, but none of them individually guarantees a particular outcome.
Zone invalidation is also possible
Every technical zone can be invalidated. A fresh zone, strong leg-out or quality base does not guarantee that an area will continue to influence future price behaviour.
If price materially moves through the demand zone and changes the underlying structure associated with the area, its previous technical significance may need to be reassessed.
From an educational perspective, studying potential invalidation is part of understanding market structure. General risk-management concepts often involve considering scenarios in which an original technical interpretation no longer remains valid. Such concepts are educational in nature and depend on individual circumstances.
Current Technical Observation
The primary area of interest on the SOLUSDT 4H chart is the interaction between current price and this historical Drop-Base-Rally Demand Zone .
The key observation is not whether the zone must produce a particular reaction, but how price behaves as it interacts with the area.
A bullish reaction, bearish invalidation, or continued consolidation are all possible outcomes. Subsequent price action across multiple timeframes may provide additional context regarding whether this historical zone continues to influence current market structure.
How do you interpret the current price behaviour around this 4H Drop-Base-Rally Demand Zone?
"This publication is intended solely for educational and informational purposes. It reflects a technical analysis of market structure and should not be interpreted as investment advice, a recommendation, or a solicitation to buy or sell any financial instrument. Always perform your own analysis and manage risk according to your individual circumstances."  Long
Long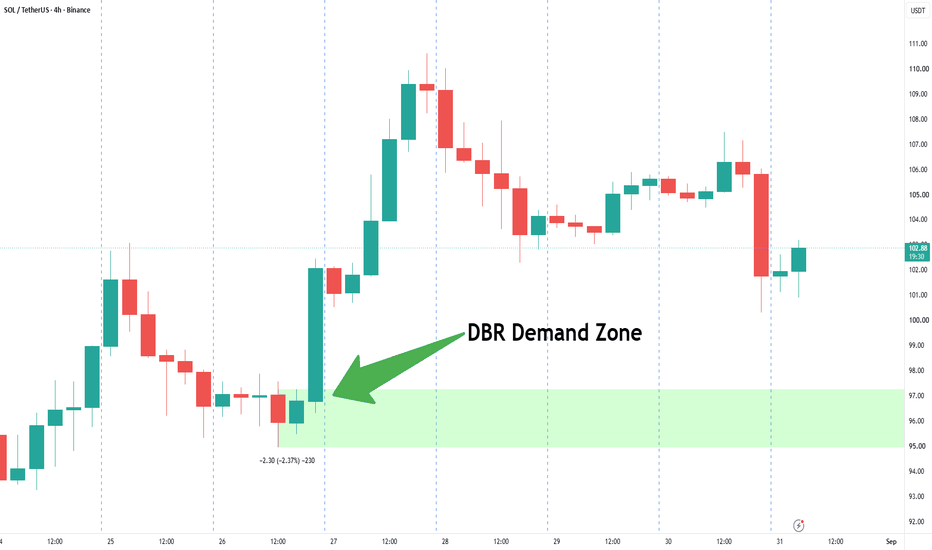
Long 
LINKUSDT - Hunting for liquidity before growthBINANCE:LINKUSDT.P is consolidating within the 11.00–12.00 range following a strong rally. However, corrections are typical within a consolidation phase, and the market could enter a liquidity-hunting phase before moving higher
Bitcoin has entered a consolidation phase after its strong rally. A correction could develop within this consolidation. Overall, the market still has bullish potential, and if the fundamental backdrop remains unchanged, the uptrend could resume soon.
The altcoin is consolidating after a strong rally. The key range is 11.00–12.00. A counter-trend correction is developing, and LINK could test the liquidity area before moving higher
Resistance levels: 12.00, 12.6
Support levels: 11.0, 10.90
Technically, a long squeeze of the 11.04–10.90 liquidity zone followed by consolidation above this area could shift the balance of power in favor of buyers and trigger a move toward the 11.60 area and the 12.02 liquidity zone
Best regards,
R. Linda.  Long
Long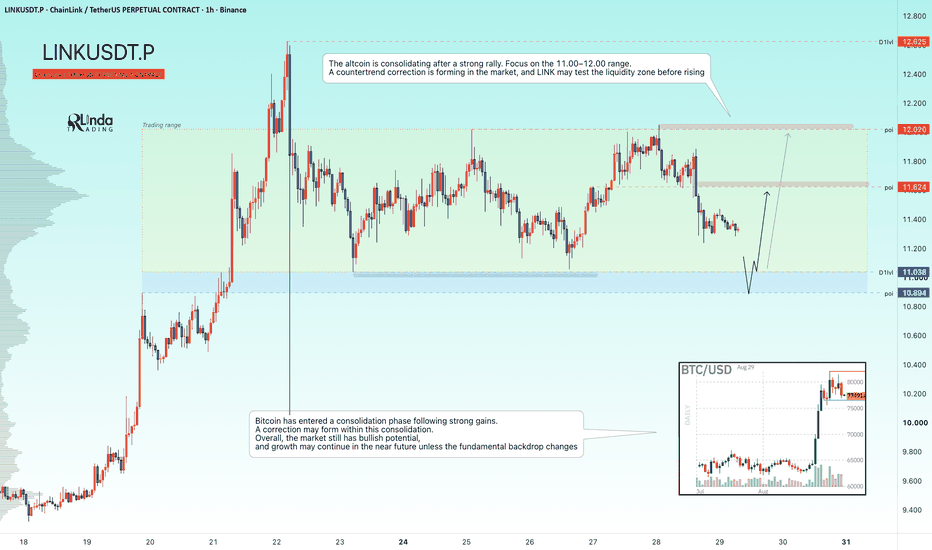
FLOCK LEADS AI NARRATIVECRYPTOCAP:FLOCK announced a partnership with Chainlink to integrate its FLOCK token with Chainlink’s Transporter interoperability protocol. This integration will make FLOCK live and transferable across BNB Chain, Hyperliquid’s HyperEVM, and Robinhood Chain, significantly expanding its accessibility and utility beyond its native Base network. This is bullish for FLOCK because it directly enhances token mobility and liquidity across major ecosystems, reducing friction for users and developers. Broadening its chain presence could drive increased adoption and integrate FLOCK into more DeFi and AI applications, strengthening its network effects. The World Economic Forum’s MINDS programme highlighted FLock for its work with two UK National Health Service (NHS) trusts. The platform is being used for federated learning projects in eye disease detection and diabetes management, allowing hospitals to collaboratively train AI models without sharing sensitive patient data, maintaining full data sovereignty. This is bullish for FLOCK as it provides high-profile validation of its core technology in a critical, regulated sector. Successful real-world deployments in healthcare demonstrate tangible utility and can pave the way for similar contracts with other government and institutional partners, creating sustainable demand for the FLOCK ecosystem. FLock is strategically advancing on two fronts: expanding its token's technical reach through key infrastructure partnerships and proving its decentralized AI's value in high-stakes, real-world applications. Will this dual focus on utility and validation be enough to catalyze the next phase of ecosystem growth and user adoption?  Short
Short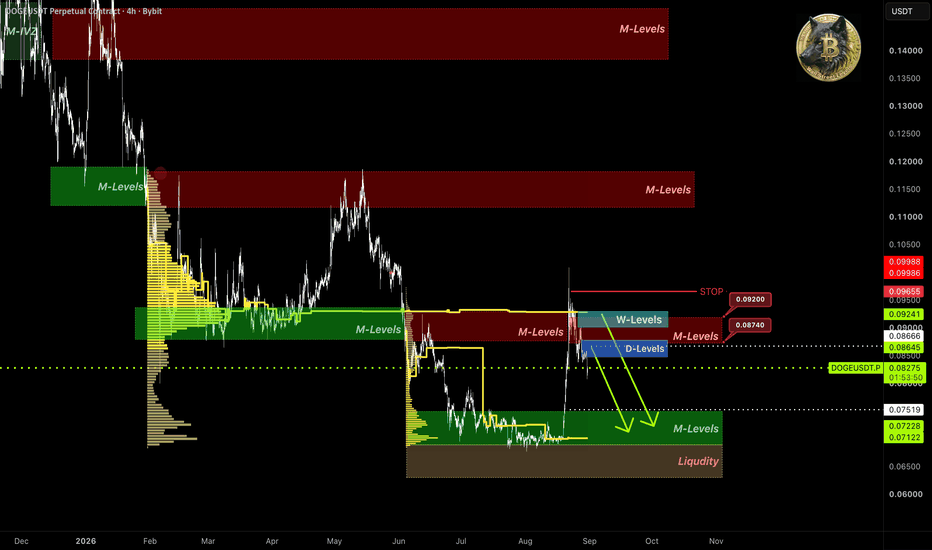
Hardest Part of Being Early in the Market
⚠️ The Hardest Part of Being Early in the Market
There is an uncomfortable truth about financial markets:
Your analysis can be right — and you can still be wrong about the timing.
Those two things are not the same.
You may identify a structural problem in an asset, a project, or an entire market narrative long before the majority does.
But the market does not have to recognize it immediately.
Prices can continue rising.
The narrative can become stronger.
Social media can become more bullish.
And everyone can start believing that the current trend is proof of long-term success.
Meanwhile, you are asking a different question:
“If the hype disappears, what remains?”
That is where the real analysis begins.
🧠 Price Is Not Always Proof of Fundamental Strength
Crypto markets have repeatedly shown how powerful narratives can become.
A network or token can experience enormous growth driven by:
Memecoins
Airdrops
Speculative trading
Social-media activity
Short-term capital flows
Market momentum
But price appreciation alone does not prove that the underlying economic model is sustainable.
The more important question is:
What happens when the speculation slows down?
Does genuine demand remain?
Are users still willing to pay for block space?
Does the ecosystem create sustainable economic value?
And most importantly:
Does that value actually accrue to the token?
These questions are not specific to Solana.
They apply to every crypto asset.
⏳ The Cost of Being Early
When you understand something before the rest of the market, there is usually a price to pay:
You have to wait.
And waiting is much harder than being right.
You may have to watch the price move against your thesis.
You may see other traders making money from the very narrative you believe is unsustainable.
People may dismiss your argument.
And eventually, you may even start questioning your own analysis.
This is where many investors fail.
Not necessarily because their original thesis was wrong...
But because they could not tolerate the distance between:
“I understand it”
and
“The market finally understands it.”
That distance can last months.
Sometimes years.
🪙 Bitcoin Teaches the Same Lesson
You may recognize something about Bitcoin today that most people still don't fully understand.
Years from now, that same idea might become obvious to the mainstream.
But there is an important distinction:
Being early is not automatically an advantage.
If you are early but cannot manage your risk, the market can force you out of your position long before your thesis has a chance to play out.
That is why successful investing is not simply about being the first person to recognize a trend.
It is about combining:
Good analysis + Risk management + Patience + The ability to change your mind.
🎯 The Most Important Question to Ask
Before investing in any asset, don't just ask:
“How high can this go?”
Ask:
What is actually driving the current demand?
Is that demand sustainable?
What happens if the narrative loses momentum?
Where does the economic value come from?
Does the token capture any of that value?
What assumptions is my thesis based on?
What evidence would prove me wrong?
That last question may be the most important one.
Because if you don't know what would invalidate your thesis, you may not be analyzing the market anymore.
You may simply be defending a belief.
🔥 The Real Lesson
Markets don't necessarily reward the person who sees the truth first.
They reward the person who can identify a good thesis, manage the downside, survive the uncertainty, and remain flexible enough to change course when the evidence changes.
Being early is difficult.
Because when the majority has not reached your conclusion yet, the market can make you feel completely wrong.
But there is a crucial difference between patience and stubbornness.
Patience means:
“My thesis is still valid, even though the market hasn't recognized it yet.”
Stubbornness means:
“My thesis must be valid because I refuse to reconsider it.”
A professional investor needs to know the difference.
Final Thought
Being early is painful.
Being wrong is expensive.
But refusing to question your own thesis can be even more expensive.
The goal is not to always be earlier than everyone else.
The goal is to think independently, manage risk, follow the evidence, and have the patience to let time reveal whether your thesis was actually correct.
What do you think?
Which narrative in today's crypto market is currently priced far beyond its sustainable fundamentals — and what would prove your thesis right or wrong? 👇 Education 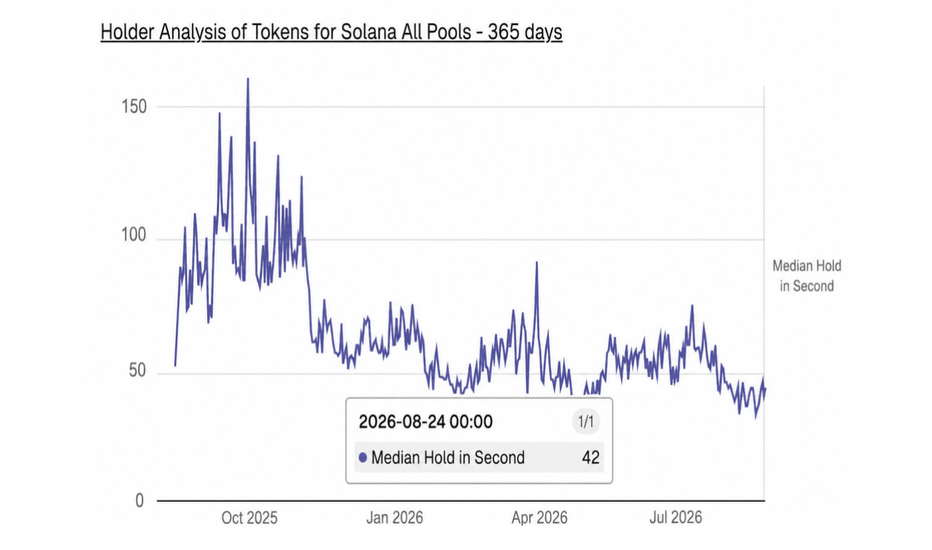
ZORA/USDT | H1 | STRONG TREND TEST ON BOUNCE🎯 TP1: $0.009821 (+6.25%) │ TP2: $0.010398 (+12.50%)
🛑 SL: $0.008193 (-11.36%) │ R/R: 1 : 1.1
⚠️ SL is placed beyond the nearest candle wicks to reduce the risk of accidental stop-out
FUNDAMENTAL BACKGROUND
There are no significant fresh news regarding the ZORA project; the movement is driven by technicals and the overall crypto market sentiment. Coinbase's decision to discontinue ZORA-PERP trading from August 26 slightly worsens access to the derivative instrument, but is not a shock driver for the spot price. The Fear and Greed Index remains in the greed zone (55–78), supporting risk appetite in the altcoin segment, but without signs of a broad altseason. No major macro releases for the asset are expected in the coming days, so the focus remains on intra-market factors.
TECHNICAL PICTURE
ADX at 50.2 indicates a strong trend with buyer advantage, confirming the current upward momentum. The price is in the middle of the last 100-candle range ($0.005886–$0.011191), leaving room for movement in either direction. CCI (20) at 17.9 signals a neutral zone without overbought or oversold conditions, leaving potential for continued growth. Bollinger Bands width is minimal and coincides with VWAP at $0.01, indicating consolidation before a possible volatility expansion.
PROBABILITY MODEL
The algorithmic model records a bearish market regime, but with a dominant probability of a bearish reversal at 55% and weak support for bullish continuation (33%). Model confidence in the buy direction is 75%, indicating a high potential for a bounce from current levels within a strong trend, despite the overall risk of a phase change.
DIRECTION
🟢 BUY — a strong trend according to ADX and neutral CCI create conditions for continued upward movement from current levels  Long
Long
BTCUSDT: Bullish Push to 82500?As the previous analysis worked exactly as predicted, BINANCE:BTCUSDT is eyeing a bullish continuation on the 1-hour chart within the ascending channel, with price approaching a key support zone near the channel bottom after recent consolidation, converging with a potential entry area that could ignite further upside momentum toward the higher resistance zone if buyers defend amid volatility. This setup suggests a solid rally opportunity with more than 1:2.5 risk-reward .🔥
Entry between 78500–79000 (entry from current price with proper risk management is recommended). Target at 82500 . Set a stop loss at a 4-hour close below 77600 , yielding a risk-reward ratio of more than 1:2.5 . Monitor for confirmation via a bullish candle close above entry with rising volume, leveraging Bitcoin’s strength near support.🌟
📝 Trade Setup
🎯 Entry (Long):
78,500 – 79,000
(Entry from current price is acceptable with proper position sizing and strict risk management.)
🎯 Target:
82,500
❌ Stop Loss:
4H candle close below 77,600
📈 Risk-to-Reward:
More than 1:2.5
💡 Will buyers defend 78,500–79,000 and push BTC toward 82,500, or will a channel breakdown invalidate the bullish setup? 👇 Long 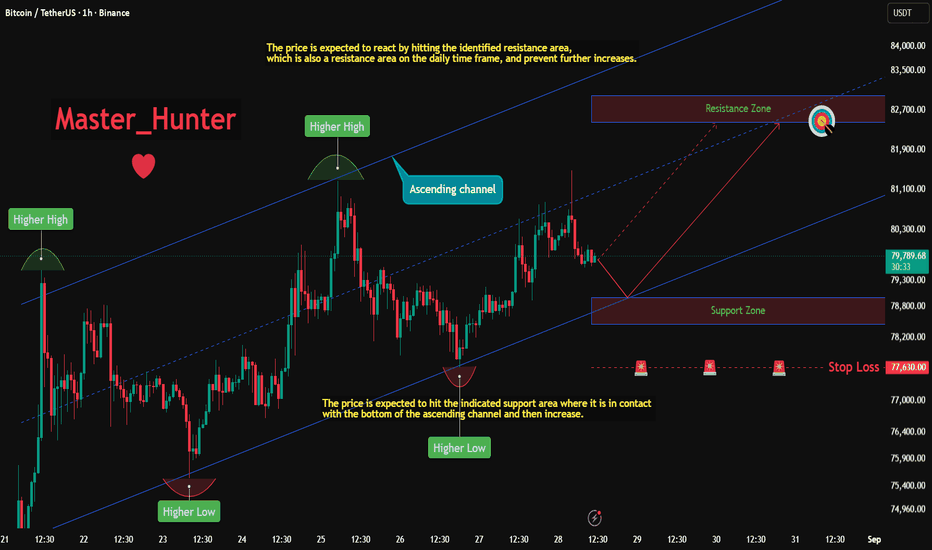
PEPE Multiple Technical Levels ConvergePEPE price action is currently trading around a technical confluence zone, making this an important region to monitor in the immediate short term. This area includes key daily support, the 200 simple moving average, a previous resistance level that is now be acting as support around the 0.618 Fibonacci retracement level.
If price holds this region and develops a sustained recovery, it could support the broader bullish market structure. From an Elliott Wave perspective, this may also suggest that a potential Wave 2 correction has been completed within a larger five-wave structure. However, any continuation would depend on sustained bullish momentum and broader market participation.
On the other hand, a decisive break below this key support region could weaken the current bullish structure. Such a move may invalidate the existing impulsive wave interpretation and increase the possibility of a deeper corrective move towards lower support areas, potentially including the base of the previous advance.
Overall, this technical region remains critical from a price action and market structure perspective. The market's reaction around this zone may provide insight into PEPE's near-term direction, although no particular outcome is guaranteed.
----------------------------------------------------------------------------------------------
Don't invest unless you're prepared to lose all the money you invest. This is a high-risk investment and you should not expect to be protected if something goes wrong. Take 2 mins to learn more: coinjar.com/uk/risk-summary
The article is an opinion expressed by the author at a point in time and does not represent the views of CoinJar UK Limited or CoinJar Australia Pty Ltd. Take care to consider the date of this article and be aware that this opinion is based on circumstances at the time of publishing. No responsibility or liability is accepted for any errors of fact or omission expressed therein. Past performance is not a reliable indicator of future results.
This above article is not to be read as investment, legal or tax advice and it takes no account of particular personal or market circumstances; all readers should seek independent investment advice before investing in cryptocurrencies.
We recommend you obtain financial advice before making a decision to use your credit card to purchase cryptoassets or to invest in cryptoassets.In the UK, it's legal to buy, hold, and trade crypto, however cryptocurrency is not regulated in the UK. It's vital to understand that once your money is in the crypto ecosystem, there are no rules to protect it, unlike with regular investments.
You should not expect to be protected if something goes wrong. So, if you make any crypto-related investments, you're unlikely to have recourse to the Financial Services Compensation Scheme (FSCS) or the Financial Ombudsman Service (FOS) if something goes wrong.
----------------------------------------------------------------------------------------------  Long
Long
Long 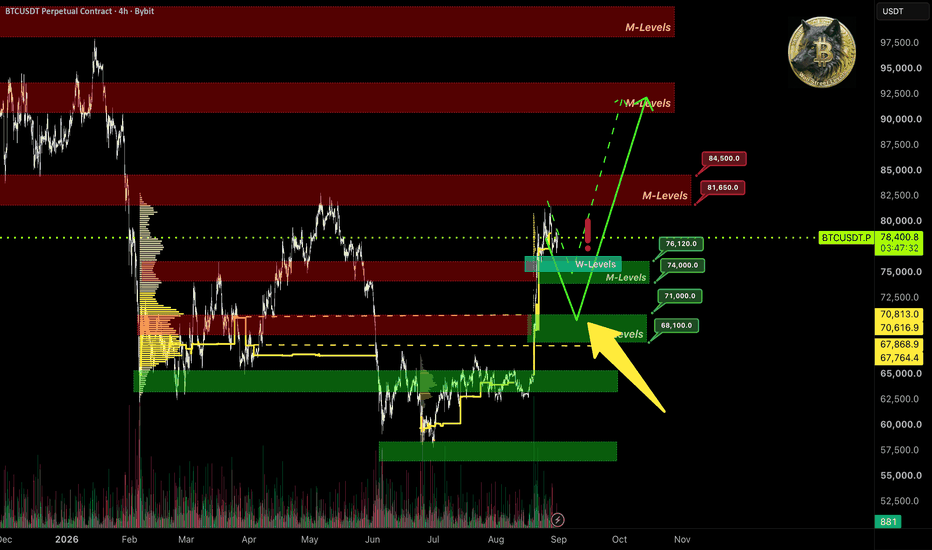
#BTC: Watch out for a pullback 📊 #BTC: Watch out for a pullback ⚠️
🏥 Apologies for the hiatus this week; I was unwell. I have now recovered and am ready to resume updates and scout for new trading opportunities.
🧠 Structurally speaking, after a period of sideways consolidation within the red target zone, a bearish structure and pattern have formed. We should therefore be alert to the possibility of a deeper pullback!
➡️ The first support zone is around 74,500–75,500. The second support zone is near 72,000.
➡️ The strongest support zone is around 66,000–67,000.
⚠️ Looking at ETH's structure, the risk of shorting here remains high; please use small position sizes if you decide to try, or simply wait patiently. If a pullback occurs, focus on long trading opportunities at the support zones.
🤜 Follow me to stay updated on market movements. Remember to like 💖 and share 💬.
BYBIT:BTCUSDT.P Short 
Long 
 Long
Long
 Short
Short
 Long
Long
dogeusdt longInstructions:
Entry point: yellow
Stop loss: red
Take profit: green
👉Leverage x 5-10-20 for crypto
👉Leverage x 20-50-100 for commodities, stocks, indices, and forex
👉Margin 1-5% max.
Always practice risk and money management.
Invest a maximum of 5% on any trade or across all your trades.
Invest only what you can afford to lose, as no one is in control of the market.
👉Our analyses are primarily based on:
breakouts: two trend lines (ascending and descending) and a line indicating a horizontal breakout.
chart patterns: shoulders and head, triangle parttern, elliott impulse, etc etc.
We don't always have the time to track them at all times or to represent them visibly, given the numerous signals, the number of channels to manage, and especially because of the often rapid pace of market movements.
indicators: We associate at least two indicators with this technique.
👉Depending on the circumstances, we use specific indicators, often setting 3 or more take profit levels.
👉Indeed, there are good days in trading and also bad days. No one can promise to win every trade, and like all traders worldwide, we also experience stop-loss orders. However, we win more than we lose and remain positive.
👉You can close the position before or after the take profit orders indicated by the green lines if you are personally satisfied; the same applies to stop loss orders.
👉We must stay positive, clear-headed, and humble.
we cannot provide all instructions or all trades here on this channel.
Good luck to us all, and may God guide us. Amen. Long 


