XRP Has Better Flows, but the Chart Still Needs RepairXRP is back near the 1.35–1.37 support area after giving back part of the recent rally.
On the surface, that looks weak.
The interesting part is that the flow picture has actually improved.
U.S. spot XRP ETFs just recorded one of their strongest stretches in months. Last week brought about $39.8 million of net inflows, the best weekly result since May, and August 26 added another $28.1 million. Cumulative inflows are now around $1.6 billion.
That does not guarantee higher prices, but it does matter.
Earlier in the year, XRP had the institutional-access story without much evidence of fresh demand. Now the flows are starting to show up while price is still struggling under descending resistance.
What the chart shows
The 1.35–1.37 area is the immediate test.
Buyers have reacted there before, and price is trying to stabilise again. But the sequence of lower highs has not been broken yet.
The first thing that would improve the structure is a clean move through the descending trendline.
The bigger test remains 1.52–1.55, where previous rallies failed.
Primary scenario
The constructive case stays alive while XRP holds the current support zone.
A bounce from here followed by a break of the descending resistance would be more convincing now because ETF demand is improving at the same time.
Alternative scenario
The other possibility is that ETF inflows are not large enough to offset broader selling pressure.
That becomes more likely if XRP loses 1.35 and starts accepting below the current support area.
In that case, the better flow data would be real, but not strong enough to change price.
What would change the view
The constructive case weakens below 1.35.
The cautious view weakens if XRP breaks the trendline and later holds above 1.52–1.55.
What comes next
The next thing I would watch is whether ETF inflows continue if price stays weak.
If buyers keep adding while XRP holds support, that divergence becomes more interesting.
The flows are finally improving, but price still has to prove that institutions are buying enough to matter.  Long
Long
 Long
Long
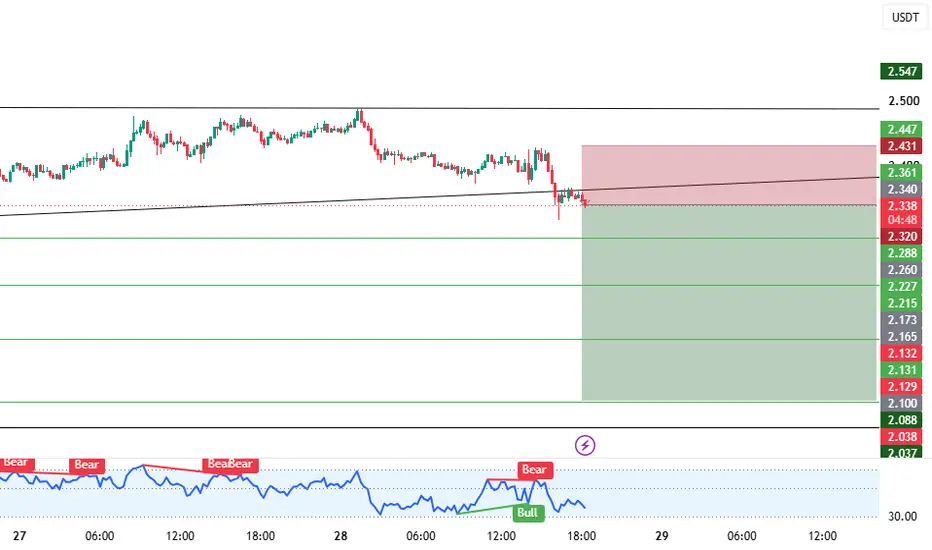
ilvusdt shortInstructions:
Entry point: yellow
Stop loss: red
Take profit: green
👉Leverage x 5-10-20 for crypto
👉Leverage x 20-50-100 for commodities, stocks, indices, and forex
👉Margin 1-5% max.
Always practice risk and money management.
Invest a maximum of 5% on any trade or across all your trades.
Invest only what you can afford to lose, as no one is in control of the market.
👉Our analyses are primarily based on:
breakouts: two trend lines (ascending and descending) and a line indicating a horizontal breakout.
chart patterns: shoulders and head, triangle parttern, elliott impulse, etc etc.
We don't always have the time to track them at all times or to represent them visibly, given the numerous signals, the number of channels to manage, and especially because of the often rapid pace of market movements.
indicators: We associate at least two indicators with this technique.
👉Depending on the circumstances, we use specific indicators, often setting 3 or more take profit levels.
👉Indeed, there are good days in trading and also bad days. No one can promise to win every trade, and like all traders worldwide, we also experience stop-loss orders. However, we win more than we lose and remain positive.
👉You can close the position before or after the take profit orders indicated by the green lines if you are personally satisfied; the same applies to stop loss orders.
👉We must stay positive, clear-headed, and humble.
we cannot provide all instructions or all trades here on this channel.
Good luck to us all, and may God guide us. Amen.  Short
Short
 Long
Long
Ethereum: Bullish Impulse or Larger Correction?The weekly ETH/USD structure suggests that Ethereum is approaching a critical decision point within a larger-degree structure — where the completion of the correction and the beginning of a new impulsive cycle remain in competition with the possibility of further corrective or bearish development.
🟢 Bullish Case
In the bullish scenario, the larger structure may indicate that the higher-degree correction has completed as a Regular Flat.
If so, the next move should gradually reveal the characteristics of a valid five-wave impulsive structure.
Confirmation from the lower degrees will be essential. Only the development of a valid impulsive sequence can meaningfully strengthen the bullish interpretation.
If confirmed, the larger structure could support the development of the next bullish wave, opening the path toward the projected targets and extensions shown on the chart.
⚫ Bearish / Corrective Case
On the other hand, until the bullish structure proves its impulsive character, the possibility that the correction is still developing cannot be ruled out.
In this case, ETH may continue developing one of the corrective structures permitted by the Elliott Wave Principle, including a Zigzag, Flat, Triangle, or more complex combinations such as a Double Three or Triple Three.
Depending on how the structure develops and how the waves relate to one another, this path could represent either a continuation of the larger correction or gradually reveal the characteristics of a bearish trend.
Ultimately, the key question is not simply where price is expected to go, but what structural character the market develops next.
Will ETH form a valid five-wave impulsive sequence and strengthen the Bullish Case, or will future price action remain primarily three-wave and corrective, keeping the Bearish / Corrective Case valid?
According to the Elliott Wave Principle, the answer will emerge through the development of the next structures.
📌 If the larger structural logic or its connection to the previous counts is not immediately clear, I recommend reviewing the earlier analyses attached to this idea. This analysis continues the same structural roadmap across multiple timeframes.
Price is the result. Structure is the cause.
— Mr. Nobody | Elliott Wave Principle
Ethereum
May 25
ETHUSD: Into the Eye of the Storm — Decoding the Final “C” Wave
 Long
Long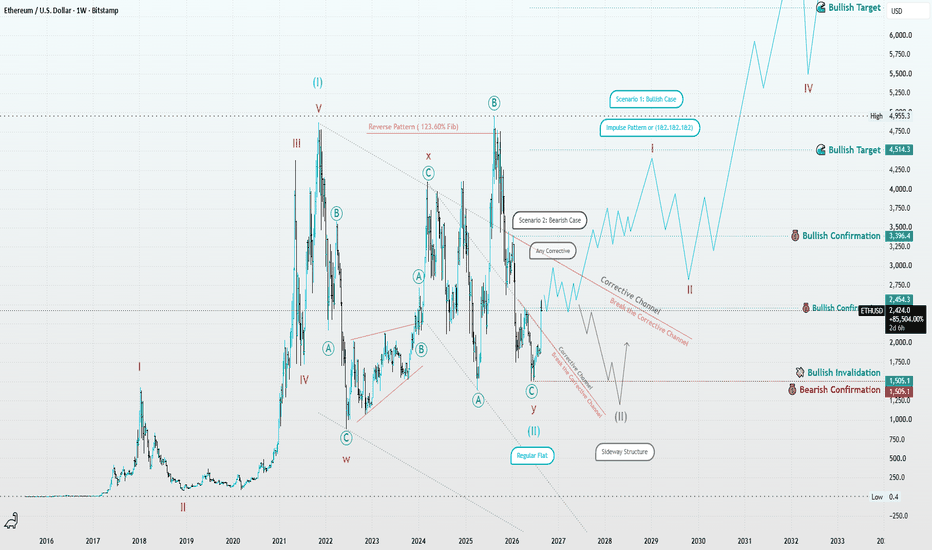
axsusdt shortInstructions:
Entry point: yellow
Stop loss: red
Take profit: green
👉Leverage x 5-10-20 for crypto
👉Leverage x 20-50-100 for commodities, stocks, indices, and forex
👉Margin 1-5% max.
Always practice risk and money management.
Invest a maximum of 5% on any trade or across all your trades.
Invest only what you can afford to lose, as no one is in control of the market.
👉Our analyses are primarily based on:
breakouts: two trend lines (ascending and descending) and a line indicating a horizontal breakout.
chart patterns: shoulders and head, triangle parttern, elliott impulse, etc etc.
We don't always have the time to track them at all times or to represent them visibly, given the numerous signals, the number of channels to manage, and especially because of the often rapid pace of market movements.
indicators: We associate at least two indicators with this technique.
👉Depending on the circumstances, we use specific indicators, often setting 3 or more take profit levels.
👉Indeed, there are good days in trading and also bad days. No one can promise to win every trade, and like all traders worldwide, we also experience stop-loss orders. However, we win more than we lose and remain positive.
👉You can close the position before or after the take profit orders indicated by the green lines if you are personally satisfied; the same applies to stop loss orders.
👉We must stay positive, clear-headed, and humble.
we cannot provide all instructions or all trades here on this channel.
Good luck to us all, and may God guide us. Amen.  Short
Short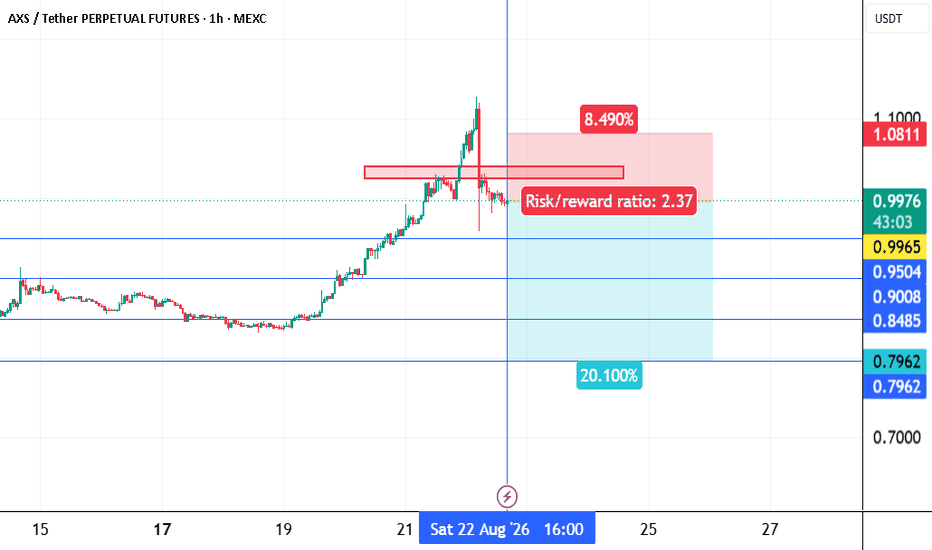
HYPE: New All-Time High — But Has Price Hit a Ceiling?Fresh High Meets Major Fib Level
HYPE has pushed to another all-time high at $86.80, almost perfectly tagging the major 0.618 Fib extension around $86.04. Sellers have since stepped in, making this an interesting area to watch.
An Explosive V-Shaped Recovery
The move from the August $51.14 low has been remarkable, with HYPE producing an aggressive V-shaped recovery before ripping into price discovery. The primary trend remains firmly in favour of the bulls.
Momentum Beginning to Cool
RSI recently pushed into overbought territory, while StochRSI is now crossing lower from overbought. Neither signals a top by itself, but both suggest some of the recent momentum is beginning to cool.
Volume Fading at the Highs
The breakout was initially backed by strong buying volume, but volume has declined as price pushed towards its latest highs. After such a sharp advance, that adds another reason to be wary of a near-term pullback.
Former All-Time High Now Important
The previous $76.96 all-time high has already been successfully retested once, with buyers stepping in around the area. If the current pullback deepens, this former resistance zone becomes the obvious first area for bulls to defend.
In Summary
HYPE has completed an impressive V-shaped recovery and surged to a fresh all-time high, but the latest move has run directly into a major Fib extension around $86. Momentum is beginning to cool and volume has declined at the highs, increasing the possibility of some short-term consolidation or profit-taking. The broader trend remains firmly bullish, with the former all-time high around $77 now an important area to watch if the pullback develops further. ETH leaves exchanges while BTC stays—what does divergence mean?Ethereum is trading near $2,494, trapped between strong demand around $2,480 and resistance at $2,535. The chart is compressing, but exchange balances are telling a more interesting story.
🐋 Since June, approximately 1.4 million ETH has left exchanges. Available balances fell from around 7.69 million ETH on June 3 to 6.28 million on August 27—a decline of nearly 18%. Another 275,000 ETH was withdrawn after August 19, even as the price continued rising.
Bitcoin is showing the opposite behavior: its exchange balance increased slightly over the same period. This divergence suggests that ETH holders may be more willing to move coins into self-custody, staking, DeFi or institutional custody, reducing the supply immediately available for sale. However, exchange withdrawals alone do not prove accumulation.
Holding $2,480 keeps another attack on $2,520–2,535 in play. A confirmed breakout above $2,535 with stronger volume could open the way toward $2,560–2,600.
Losing $2,480 would weaken the setup and expose $2,469, followed by $2,446–2,428.
The supply story favors the bulls—but the chart still needs to confirm it. Until ETH breaks $2,535, this remains accumulation beneath resistance, not a completed breakout.
Accumulation—or quiet distribution before the next move? 👇
Disclaimer: This is not investment advice. Long 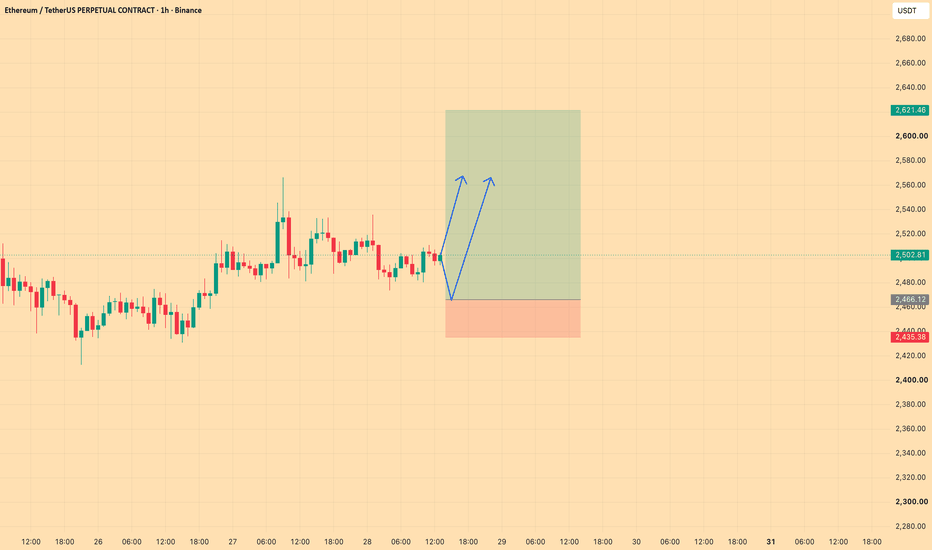
 Long
Long
 Short
Short
Long 
Long 
Short 
 Long
Long
 Long
Long
TradeCityPro | Bitcoin Daily Analysis #356👋 Welcome to TradeCityPro!
Let’s analyze Bitcoin. It looks like the market is starting its bearish move!
⌛️ 1 Hour Time Frame
Yesterday, we had a long trigger on Bitcoin at the 80621 level. However, price failed to consolidate above this area, and after a strong rejection from this level, it made a deeper correction down to 77795.
📊 Selling volume has now increased significantly, and the previous candle also showed a sell off, with price reacting to the 77795 level.
✔️ If price manages to consolidate below 77795, a deeper correction toward 75950 could take place.
📊 If we want to trade on the lower cycles, we can open a short term scalp position after a break below 77795.
💥 The RSI oscillator is also currently in the oversold zone. Considering that the overall trend is still bullish, if this RSI move turns out to be fake, fresh bullish momentum could enter the market.
❌ Disclaimer ❌
Trading futures is highly risky and dangerous. If you're not an expert, these triggers may not be suitable for you. You should first learn risk and capital management. You can also use the educational content from this channel.
Finally, these triggers reflect my personal opinions on price action, and the market may move completely against this analysis. So, do your own research before opening any position.  Long
Long
 Long
Long
 Long
Long
 Long
Long
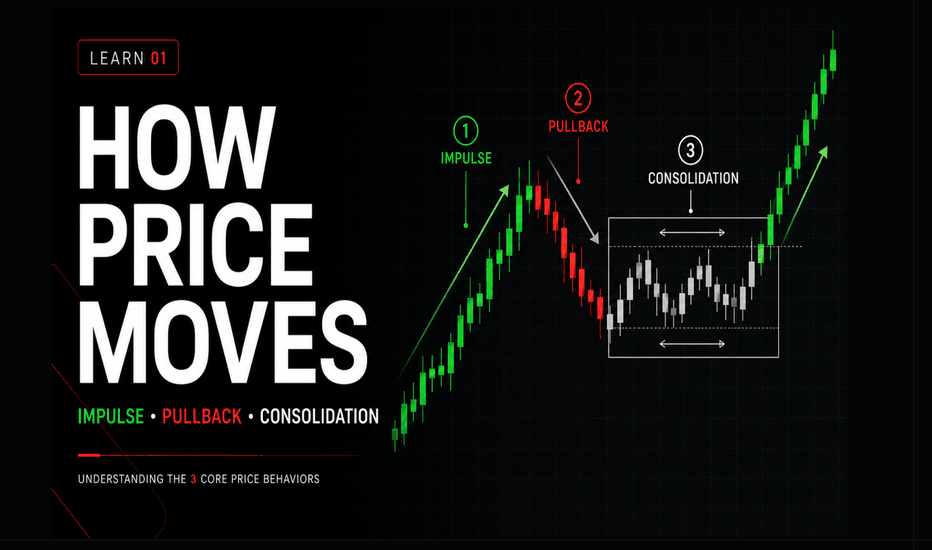
How Price Moves: Impulse, Pullback and ConsolidationBefore trying to predict where price may move next, it helps to first understand what price is doing now. 📘
A chart is not simply a sequence of bullish and bearish candles. Price continuously changes the way it travels. At times it moves efficiently in one direction. At other times it retraces part of that movement. In other periods, it repeatedly rotates through the same area without making meaningful directional progress.
A useful foundation for reading these changes is to separate price behavior into three broad states:
Impulse
Pullback
Consolidation
These are not entry signals, and they do not tell us what price must do next. They are descriptive concepts that help organize price action before more advanced ideas such as market structure, liquidity, confirmation, and risk are introduced. 🧠
The chart above provides a complete example of how these behaviors can transition from one state to another.
Rather than treating each candle as an isolated event, the goal is to observe how the character of movement changes across a sequence . 🔍
⚡ 1. IMPULSE — DIRECTIONAL EXPANSION
An impulse is a period in which price makes relatively efficient progress in one direction.
In this article, “impulse” is used in the broad price-action sense of directional expansion, rather than as a reference to any specific wave-counting methodology.
A bullish impulse advances upward, while a bearish impulse advances downward.
The important word is efficient .
Here, directional efficiency is used descriptively rather than as a standardized indicator or mathematical metric. It refers to how directly price makes net progress relative to the amount of rotation and overlap occurring along the way.
Imagine two price sequences covering approximately the same vertical distance.
In the first, price reaches the destination quickly with limited overlap and repeated directional closes.
In the second, price moves back and forth many times before eventually reaching the same destination.
Although the net distance may be similar, the first sequence displays greater directional efficiency.
This is one of the most useful ways to think about impulsive price behavior. ✅
Common characteristics of an impulse may include:
Clear directional displacement
Relatively strong net progress
Reduced overlap between consecutive candles
Repeated closes toward the direction of travel
Movement beyond nearby price areas
Faster directional travel than the surrounding price action
None of these characteristics should be treated as a rigid rule.
Impulse exists on a spectrum.
One movement can simply be more impulsive than another.
🔍 A LARGE CANDLE IS NOT AUTOMATICALLY AN IMPULSE
One common mistake is to classify every unusually large candle as an impulse.
Candle size can provide information about short-term expansion, but meaningful price behavior is usually better evaluated as a sequence rather than as one isolated candle.
A large candle may:
Immediately reverse
Occur inside a wider consolidation
Represent temporary volatility
Become the beginning of genuine directional expansion
The surrounding price action provides the context.
For that reason, impulse should be evaluated relative to the recent behavior of the same market and timeframe , not through a universal candle-size threshold. 📏
The comparison above illustrates why movement alone is not enough.
Two price sequences can travel toward a similar destination while displaying very different internal behavior.
A higher-efficiency sequence typically makes more meaningful progress with less rotation and overlap.
A lower-efficiency sequence may still move in the same general direction, but price repeatedly revisits similar areas and requires substantially more internal movement to achieve comparable net progress.
This distinction is more useful than simply asking whether individual candles are large or small.
↩️ 2. PULLBACK — A COUNTER-MOVE INSIDE A LARGER DIRECTIONAL CONTEXT
After directional expansion, price rarely continues in a perfectly straight line.
It may temporarily travel in the opposite direction.
When that counter-directional movement remains part of the broader directional sequence and the previous direction later resumes, we commonly describe it as a pullback or retracement.
After a bullish move, a pullback moves lower.
After a bearish move, a pullback moves higher.
However, there is an important real-time problem:
We do not know in advance that every counter-move will remain only a pullback.
A movement that initially appears to be a normal retracement can deepen, invalidate the previous structure, and eventually become part of a larger reversal.
This means the word “pullback” often becomes clearer only after additional price behavior develops.
In real time, what we can objectively observe first is a counter-directional movement .
Whether that movement ultimately behaves as a temporary pullback or develops into something larger depends on what happens afterward.
This is why:
Pullback does not mean automatic continuation. ⚠️
In the main chart, the section labeled 02 — Pullback should therefore be read carefully.
At the beginning of that decline, the market did not announce that the movement would eventually remain temporary.
We can observe the counter-move immediately.
Its final role becomes clearer only as subsequent price action develops.
📐 PULLBACKS DO NOT HAVE ONE SHAPE
A pullback can be:
Shallow or deep
Fast or slow
Smooth or volatile
A sharp counter-directional move
A gradual channel
A sideways correction
There is no universal retracement percentage or fixed number of candles that automatically makes a movement a valid pullback.
The relationship between the move, the preceding impulse, the surrounding structure, and the timeframe matters more than a single fixed measurement.
This is particularly important because textbook charts often make pullbacks appear much cleaner than they look while developing in real time.
📦 3. CONSOLIDATION — MOVEMENT WITHOUT EFFICIENT DIRECTIONAL PROGRESS
Consolidation occurs when price stops making efficient progress in one direction and begins spending more time rotating through a local area.
Typical characteristics may include:
Increased candle overlap
Repeated trading around similar prices
Reduced net directional progress
Identifiable local upper and lower boundaries
Multiple rotations between those boundaries
Failed attempts to sustain directional movement
A simple way to recognize consolidation is to compare movement with progress .
Price may travel a considerable total distance inside a range while ending close to where it started.
There was plenty of movement, but very little net directional progress.
That is very different from an impulse.
In the consolidation area shown on the main chart, price continues moving from candle to candle, but much of that movement occurs inside the same local region.
This is the idea behind:
Movement ≠ Progress 📉📈
🧠 CONSOLIDATION DOES NOT ALWAYS MEAN LOW VOLATILITY
Another common misconception is that consolidation must consist of very small candles and extremely narrow price action.
Some consolidations are quiet and compressed.
Others are wide and volatile.
What matters most is not whether every candle is small, but whether price is repeatedly rotating through a relatively contained area instead of producing sustained directional progress.
A market can therefore generate considerable intrarange movement and still remain consolidated.
The defining characteristic is not inactivity.
It is reduced directional efficiency .
🎯 CONSOLIDATION DOES NOT PREDICT THE BREAKOUT DIRECTION
A consolidation can appear:
Before continuation
Before reversal
After a strong directional move
As part of a much larger period of balance
The existence of consolidation alone does not tell us which side will eventually gain control.
It describes the current condition.
It does not guarantee the next one.
The comparison above demonstrates why this distinction matters.
Both examples initially display similar characteristics:
Price remains range-bound
Repeated rotations occur inside local boundaries
Net directional progress remains limited
Yet the eventual outcomes are different.
One consolidation is followed by bullish expansion.
The other is followed by bearish expansion.
Consolidation alone does not determine the direction of the next expansion.
Market context can support a probabilistic expectation, but the outcome cannot be known with certainty from consolidation alone. 🎲
🔄 4. EXPANSION AND CONTRACTION
Impulse, pullback, and consolidation become easier to understand when viewed through a broader concept:
Expansion versus contraction.
During expansion, price becomes more directionally efficient and begins covering distance.
During contraction, directional efficiency decreases and price spends more time interacting with similar price levels.
Markets frequently transition between these conditions.
A common sequence might look like:
Impulse → Pullback → Re-expansion
Another may look like:
Impulse → Consolidation → Expansion
But this should not be interpreted as a fixed market cycle.
Other outcomes are possible:
Impulse → Pullback → Deeper Reversal
or:
Impulse → Consolidation → Expansion in the Opposite Direction
Price behavior is conditional, not mechanical.
The value of these concepts comes from recognizing how the current environment is changing, not from assuming that one state guarantees the next. 🔄
🧩 5. HOW THE THREE BEHAVIORS CONNECT
Consider a bullish directional sequence.
Price first advances aggressively and efficiently.
That is the impulse .
Directional progress then slows and price begins moving lower against the preceding leg.
That is the counter-move .
If buyers later regain control and price resumes its previous direction, the counter-move can be understood as a pullback within the larger bullish sequence.
At another point, price may stop advancing but also fail to produce a meaningful bearish move.
Candles begin overlapping, local boundaries become clearer, and price repeatedly rotates through the same area.
That is consolidation .
Eventually, price may expand away from that area.
But the direction of that expansion should be observed rather than assumed.
This distinction matters:
Impulse describes directional efficiency.
Pullback describes the relationship of a counter-move to a broader directional move.
Consolidation describes reduced directional progress and increased two-sided rotation.
They are related, but they are not interchangeable.
The main chart is therefore better understood as a sequence of changing behaviors , rather than a collection of isolated patterns.
🕒 6. PRICE BEHAVIOR IS TIMEFRAME-DEPENDENT
No price behavior exists independently of timeframe.
A movement that appears to be one simple pullback on a four-hour chart may contain several complete impulses, pullbacks, and consolidations on a fifteen-minute chart.
Likewise, what appears to be a strong trend on a five-minute chart may represent only a small retracement inside a much larger daily move.
This is sometimes described as the nested nature of price action.
It creates an important rule for chart reading:
Always define the timeframe from which you are describing price behavior.
“Price is impulsive” is less informative than:
“Price is displaying relatively impulsive behavior on this timeframe compared with the preceding sequence.”
That additional context prevents many classification mistakes.
The labels themselves are therefore not absolute properties of price.
They describe market behavior from a particular observational perspective. ⏱️
🧭 7. A REAL-TIME FRAMEWORK FOR READING PRICE
Instead of trying to predict the next candle, begin by asking observational questions.
Question 1 — Is Price Making Directional Progress?
Is price consistently moving away from its previous area, or repeatedly returning to similar prices?
Consistent directional progress suggests expansion.
Repeated rotation suggests balance or contraction.
Question 2 — How Much Candle Overlap Is Present?
Lower overlap often accompanies stronger directional movement.
Increasing overlap can indicate that directional efficiency is weakening.
This is contextual rather than mechanical, but the change itself can be informative.
Question 3 — Where Are Candles Closing?
Are closes repeatedly advancing in one direction?
Or are bullish and bearish closes alternating around similar levels?
Closes can help reveal whether price is progressing or simply rotating.
Question 4 — Is the Current Move With or Against the Previous Directional Leg?
A move traveling against the previous impulse may be developing into a pullback.
But remember: its final role cannot be known with certainty while it is still developing.
Question 5 — Is the Market Expanding or Contracting?
Compare the current sequence with the one immediately before it.
Is price becoming more directional?
Less directional?
More overlapping?
More compressed?
The change in behavior is often more informative than an isolated candle.
Question 6 — What Timeframe Am I Reading?
Before assigning a label, define the observational timeframe.
The same movement can represent different behavior at different levels of market structure.
The objective is not to predict an outcome from these questions.
The objective is to build a more accurate description of the environment that currently exists. 🧭
⚠️ 8. COMMON MISTAKES
1. Calling Every Large Candle an Impulse
Large candles can be part of impulsive behavior, but one candle alone does not define the broader sequence.
2. Treating Every Counter-Move as a Pullback
A counter-directional move can continue developing into a larger reversal.
Continuation is not guaranteed.
3. Assuming Every Consolidation Must Break With the Previous Trend
Consolidation represents balance or reduced directional progress.
It does not determine the direction of the next expansion.
4. Using Fixed Candle Counts
There is no rule stating that an impulse, pullback, or consolidation must contain a specific number of candles.
5. Ignoring Timeframe
Price behavior is nested.
A pullback on one timeframe can contain a directional trend on another.
6. Looking at Candles Individually
The goal is to classify behavior across a sequence , not to give every candle a separate label.
7. Forcing a Classification
Not every section of a chart will fit neatly into one category.
Transitions can be messy.
Uncertainty is part of real-time analysis, and sometimes the correct conclusion is simply that the current behavior is not yet clear. 🚧
🧱 9. LIMITATIONS
Impulse, pullback, and consolidation are descriptive frameworks.
They are not mechanical trading signals.
Their interpretation can change according to:
Timeframe
Volatility regime
Instrument characteristics
Market session
The amount of context visible on the chart
The definition used for meaningful directional progress
Their boundaries are not always exact.
Different traders can reasonably classify transitional price action differently.
Most importantly, identifying the current state does not reveal the future with certainty.
An impulse can fail.
A pullback can become a reversal.
A consolidation can expand in either direction.
These concepts become more useful when they are later combined with market structure, location, volatility, confirmation, and risk management. 🛠️
✅ KEY TAKEAWAYS
Price behavior can be easier to understand when viewed as sequences rather than isolated candles.
Impulse describes relatively efficient directional expansion.
Pullback describes a counter-directional move that remains part of a broader directional context, but continuation cannot be assumed while the move is developing.
Consolidation describes reduced net directional progress and repeated rotation through a local area.
Expansion and contraction help explain how these behaviors transition into one another.
All three concepts are timeframe-dependent.
Most importantly:
Describe first. Interpret second. Predict last. ✨
Learning to recognize how price is behaving now creates a stronger foundation for understanding what the market may be communicating later. 📚🚀 Education