Bitcoin Crossroads Bitcoin Crossroads ⚡
Hello everyone, here is my latest Bitcoin Weekly Update, using my new analytical style.
After reviewing the larger-degree structure, Bitcoin appears to be at a point where two important paths are still on the table. At this stage, the structure needs more development before we can confidently favor one scenario over the other.
In the Aggressive Path — the Turquoise Scenario, the larger decline may have completed a corrective structure, with the current advance potentially marking the beginning of a new bullish cycle. If price continues to maintain an impulsive structure, the intermediate pullbacks can be viewed as natural corrections within the larger move, allowing higher-degree waves to develop after each correction.
On the other hand, the Conservative Path — the Black Scenario keeps open the possibility that the larger correction is not finished yet. From this perspective, the current rise could still be part of a broader corrective structure, potentially becoming more complex before another decline develops to complete the larger corrective cycle.
So the question is not simply bullish or bearish. What matters more is the personality of the structure.
Is Bitcoin showing the strength, subdivision, and momentum of an impulsive move? Or are the overlapping price movements still pointing toward a corrective structure?
For now, Bitcoin stands at a structural crossroads. The turquoise path looks toward the development of a new bullish structure, while the black path keeps the possibility of a deeper corrective phase alive.
Rather than forcing an outcome, I’ll let price take the next step and reveal which structure is actually developing.
The market speaks through structure. We just have to listen.
— Patterns whisper. I listen.
Mr. Nobody 🎧📊
Bitcoin
Jul 4
Bitcoin 4H | Is the First Bearish Leg Complete?
 Short
Short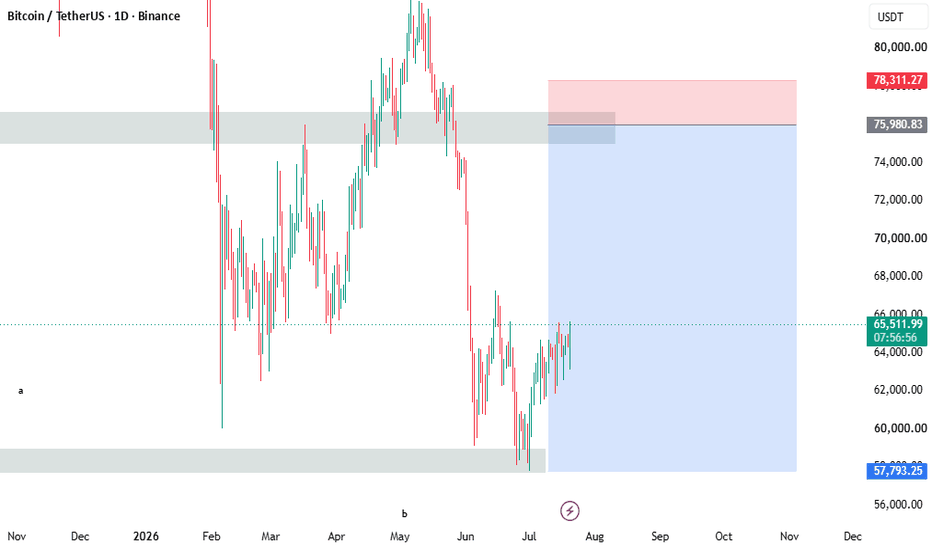
B T C : (Perfect Profit)BTCUSD Signal Update — Take Profit Hit
The latest BTCUSD signal successfully reached the Take Profit target, with price moving exactly in line with the technical structure identified in the analysis. The setup was based on market direction, key support and resistance levels, and confirmation that momentum was building in favour of the trade.
By waiting for price to respect the important level and confirm the expected direction, the signal focused on entering with the trend rather than chasing the market. Once momentum strengthened, BTCUSD continued toward the projected target and successfully reached Take Profit.
This result highlights the importance of patience, technical confirmation, and disciplined risk management. A successful trade is not about predicting every move perfectly—it is about identifying high-probability opportunities, managing risk, and allowing a well-planned setup to play out.
Take Profit hit on BTCUSD. The analysis, patience, and technical structure came together once again. Long 
 Short
Short
Long 
Long 
 Long
Long
 Long
Long
 Short
Short
BTCUSDT Long: Rebound from Demand Toward 81,400$ SupplyHello traders! Here’s my technical outlook based on the current BTCUSDT (1H) chart. Bitcoin broke out of a descending channel, shifted bullish, formed a short range, then entered an ascending channel and approached the 81,400 Supply Zone.
Currently, BTC is trading below the 81,400 Supply Zone while holding above the Demand Zone and the lower boundary of the ascending channel. The recent pullback suggests a possible retest of support before another move higher.
As long as Bitcoin remains above the Demand Zone and respects the ascending channel, the bullish scenario remains valid. A successful rebound from support could push price toward the 81,400 Supply Zone (TP1). However, a breakdown and close below the Demand Zone or the channel’s lower trend line would weaken the bullish outlook and increase the risk of further downside. Manage your risk! Long 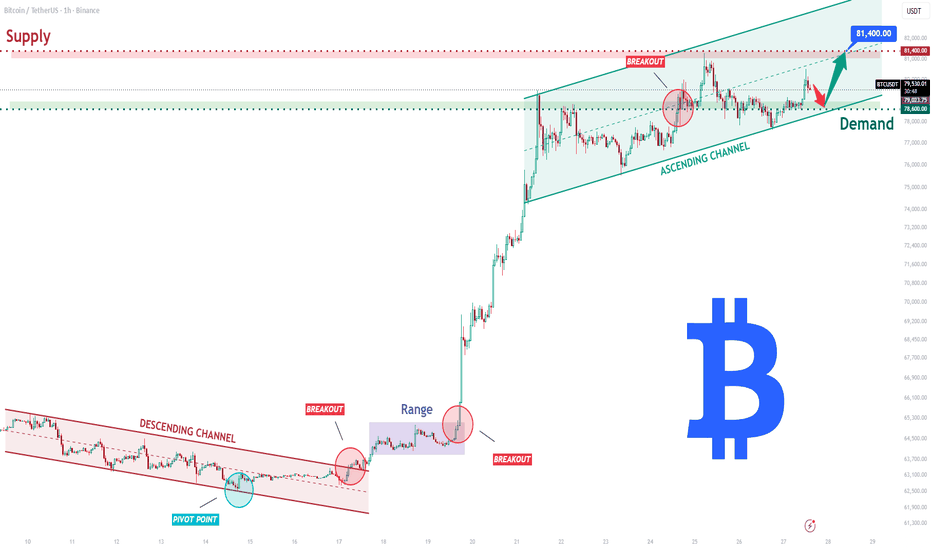
Long 
 Short
Short
BTC Printed A New High Then Faded To 79,700.BTC Printed A New High Then Faded To 79,700.
BTC pushed to a marginal new high at 81,479 overnight, then faded back to 79,700 - the first sign of exhaustion after the relentless melt-up. Price is still holding above the 78,028 shelf, but anti-signals are now firing, a high-sweep and compression, the kind of markers that precede a first real pullback. The trend is intact and the shelf holds, but the extension is showing its age. Respect, not chase - and now watch 78,028 more closely. Neutral.
Resistance: 81,479 - the new high
Key resistance: 82,450 - next shelf up
Current price: 79,702
Support: 78,028 - the shelf holding it
Key support: 76,237 - the deeper shelf
Structural floor: 74,182 - first real pullback level
Two paths from here:
It holds 78,028 and pushes back up. If the shelf holds and the fade is just noise, BTC can retest 81,479 and higher. The melt-up has shrugged off every stall so far.
It loses 78,028 and the first pullback starts. A new high that fades with anti-signals firing is a classic exhaustion setup. A loss of 78,028 opens 76,237 and 74,182 - the first real pullback and the spot to assess. This is where the extension finally matters.
BTC tagged a new high and faded, with exhaustion signals appearing for the first time. Holding 78,028 keeps the melt-up alive; losing it starts the pullback the tape has been overdue for. Respect the trend, but 78,028 is now the line that matters.
Built with SYNTHESIS v3.3 | SOM / ACE / IMP / SYNTHESIS
Study, not financial advice.  Short
Short
Short 
Bitcoin (BTC) 1H — Bullish Above $80,300, Bearish Below $78,800📊 MARKET STATUS: 🟡 WAITING
BTC remains inside an H1 decision area following a strong higher-timeframe recovery.
D1 structure has improved significantly, while H4 remains bullish above its major moving averages. H1 is still structurally constructive, but the rejection from the $81,000–$81,500 region and failure to maintain price above $80,000 mean continuation is not yet confirmed.
Key Zones
Major Resistance: $81,000–$81,500
Immediate Resistance: $80,000–$80,300
Decision Zone: $79,000–$80,300
Immediate Support: $78,800–$79,000
Major Support: $77,800–$78,200
⭐ FXGV A-SETUP — Higher Quality
🟢 BUY ABOVE $80,300 (H1 Close)
Bullish confirmation requires an H1 close above $80,300. Acceptance or a successful retest would strengthen continuation.
If confirmed:
🎯 TP1: $80,800
🎯 TP2: $81,200
🎯 TP3: $81,500
Invalidation: Failure to hold the breakout and an H1 close back below $80,000 weakens the bullish thesis.
↩ FXGV B-SETUP — Alternative
🔴 SELL BELOW $78,800 (H1 Close)
Bearish confirmation requires an H1 close below $78,800 followed preferably by failure to reclaim the broken support.
If confirmed:
🎯 TP1: $78,200
🎯 TP2: $77,800
🎯 TP3: $77,000
Invalidation: H1 acceptance back above $79,000 weakens the bearish thesis.
⚠ RISK
The supplied economic calendar shows Fed Chair Warsh speaking at 19:30 UTC+5:30. Event-driven volatility can create temporary sweeps through technical levels, so an initial wick should not be treated as confirmation.
Current Status: 🟡 WAITING — neither H1 confirmation boundary has been objectively broken and accepted.
Confirmation First • Capital Protection Always
⏳ Wait. Confirm. Execute.
No confirmation = No trade.
Educational Analysis Only.
The title and description above deliberately preserve the same confirmation and target levels as the drawing plan, as required by the supplied publishing framework. Long 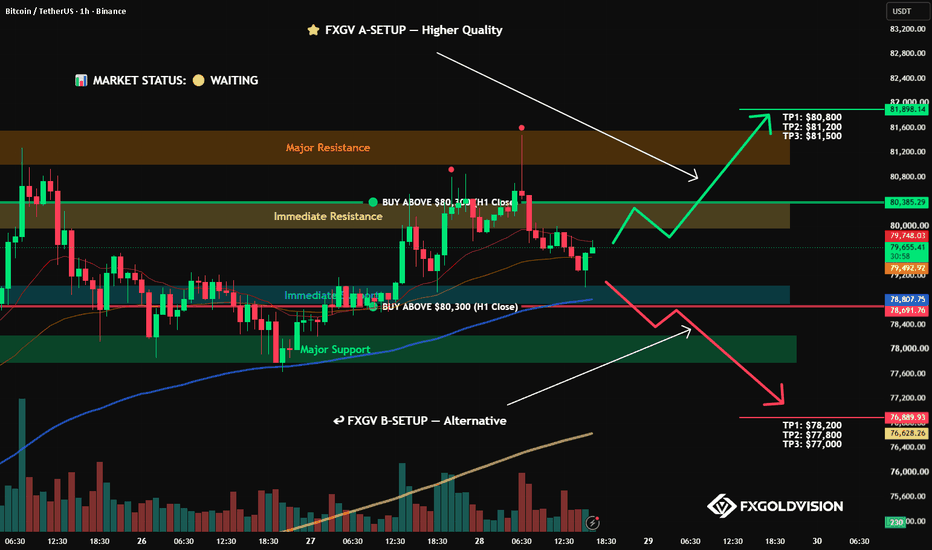
BTC 15M Liquidity Reclaim in ProgressMarket Thesis:
BTC/USDT on the 15-minute chart is attempting a recovery after a sharp rejection from the upper LuxAlgo bearish zone near 81K. Price is currently trading at 79,743.60, above the recent equal-low liquidity area, but directly underneath a nearby bearish reaction zone around 79.86K–80.00K.
Short-term order flow is therefore neutral-to-bullish while above 79.50K, but buyers still need a clean reclaim of 80K to regain momentum toward the higher range.
Visible Confluences (15M)
Current price: 79,743.60.
Near-term LuxAlgo bearish zone: approximately 79,860–80,000 — immediate resistance and the key decision area.
Major upper bearish zone: approximately 80,700–81,160; price already produced a strong rejection from this region.
Upper structural high: approximately 81,460–81,500.
Visible EQL liquidity: approximately 79,480–79,500. Price traded beneath this liquidity pocket and is now recovering back above it.
Earlier bullish CHoCH: approximately 79,250, confirming the prior transition from bearish to bullish structure before the expansion higher.
First highlighted bullish zone: 78,600–78,800.
Second highlighted bullish zone: 78,200–78,460.
Deeper highlighted bullish zone: 77,850–78,140, with broader structural support near 77,610.
Earlier EQH/EQL liquidity markings are also visible within the prior consolidation, supporting the liquidity-driven expansion that followed.
No clearly labelled FVG is visible on this screenshot, so no FVG is being assumed. Likewise, the colored rectangles are referenced strictly as the LuxAlgo-highlighted bullish/bearish zones visible on the chart rather than assigning an unsupported classification.
Trade Scenarios
Setup 1 — SELL: Rejection From Immediate Bearish Zone
Entry Zone: 79,860–80,000
Trigger: Wait for price to trade into the zone and print an LTF bearish CHoCH, strong bearish displacement candle, or failed breakout/retest.
Stop Loss: 80,080
TP1: 79,500
TP2: 79,100
TP3: 78,800
This is the cleaner short while BTC remains unable to establish acceptance above 80K.
Setup 2 — BUY: Confirmed 80K Reclaim
Entry Zone: 79,880–80,000 on a confirmed breakout/retest
Trigger: A decisive close above the bearish zone followed by an LTF bullish structural hold / CHoCH. Avoid buying the first spike into resistance.
Stop Loss: 79,620
TP1: 80,300
TP2: 80,700
TP3: 81,100
Acceptance above 80K would shift the immediate objective back toward the larger 80,700–81,160 bearish zone.
Setup 3 — BUY: Discount Pullback Into Bullish Zone
Entry Zone: 78,600–78,800
Trigger: Prefer a liquidity sweep into the zone followed by an LTF bullish CHoCH or strong bullish momentum candle.
Stop Loss: 78,450
TP1: 79,100
TP2: 79,500
TP3: 79,860
A deeper failure through 78,600 would bring the 78,200–78,460 and 77,850–78,140 highlighted zones back into focus rather than justify blindly averaging down.
Refinement Tip
The provided chart is 15M, so treat these as higher-timeframe execution zones relative to very short-term entries. For the best Risk/Reward, drop into lower timeframes and wait for LTF CHoCH, liquidity sweeps, displacement/momentum candles, or a clean break-and-retest before committing capital.
⚠️ Disclaimer:
Trading financial markets involves significant risk and there are no guaranteed outcomes. This analysis reflects only the market structure, liquidity markings, and LuxAlgo information visibly present on the supplied chart at this moment. It is strictly educational and analytical, not financial advice. Always define risk before entry and size positions according to your own trading plan. BTCUSDT Breakout & Retest — $82,000 Becomes Next TargetHello traders! Here’s my technical outlook based on the current BTCUSDT (2H) chart structure. BTCUSDT previously traded inside a broad range before breaking above the resistance line and shifting bullish. Price then rallied strongly and formed an ascending channel toward the 82,000 Seller Zone. Currently, BTCUSDT is trading above the 78,700 Buyer Zone while respecting the ascending support line. The recent breakout and retest suggest that buyers remain active, with price potentially moving higher after a successful support retest. As long as BTCUSDT remains above the 78,700 Buyer Zone and respects the ascending support line, the bullish scenario remains valid. A successful retest of support could push price toward the 82,000 Seller Zone (TP1). However, a breakdown below 78,700 and the support line would weaken the bullish outlook and increase the risk of further downside. Please share this idea with your friends and click "Boost" 🚀 Long 
 Long
Long
 Long
Long
 Long
Long