 Long
Long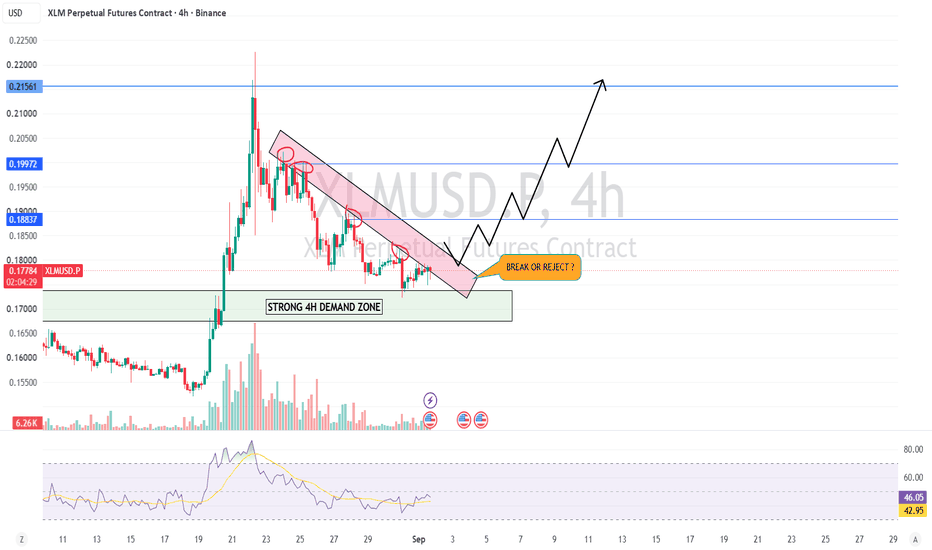
 Long
Long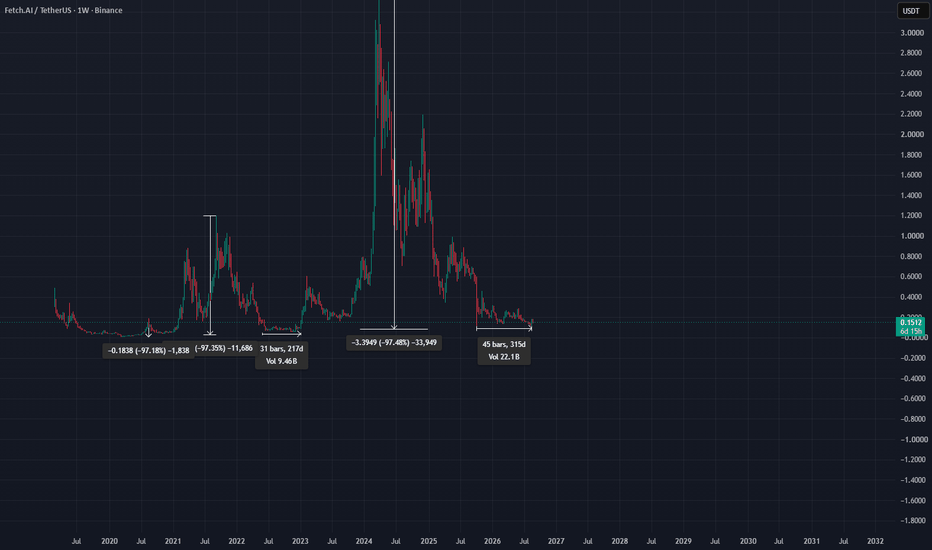
 Long
Long
 Long
Long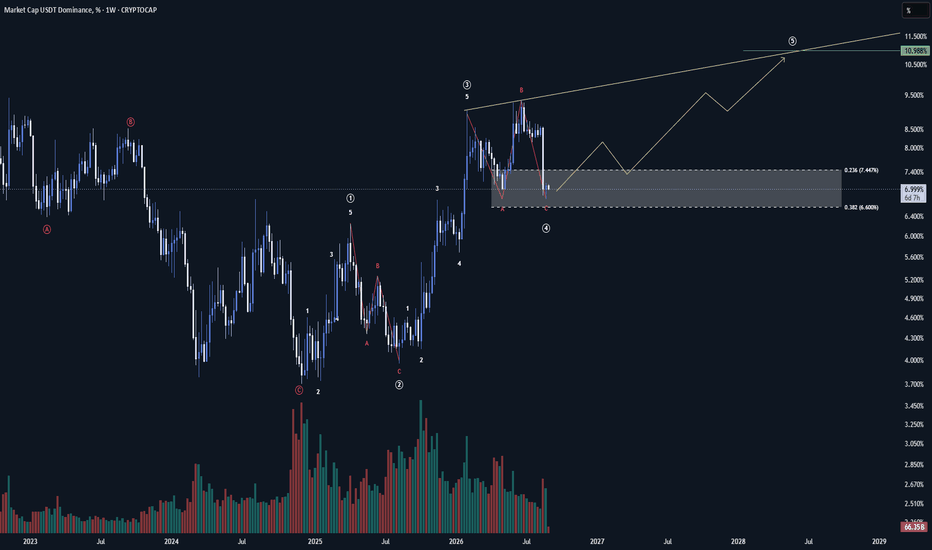
Short 
Bitcoin: range narrows into payrolls — is $77,000 the floor?Bitcoin has spent nine days locked between $75,577 and $81,438 after a 23% vertical repricing in mid-August, and the swing inside that range has now compressed to 1,631 points with price at $77,730. This analysis argues that the 23.6% retracement at $77,000, sitting inside the range floor, is where the August move is either confirmed as a base or exposed as an overshoot.
Key topics covered
- The rate repricing is a crypto story too: After Warsh's Jackson Hole remarks, CME FedWatch pricing for a September hike moved from roughly 36% to about 65%, and the two-year yield jumped more than twelve basis points. Bitcoin is a liquidity asset before it is anything else, so a market pricing tighter policy is removing the fuel that drove the August advance.
- Compression, not direction, since 28 August: Three failed pushes above $80,000 with only three closes above it, four separate bases between $76,656 and $76,999, and a swing that has shrunk from 4,580 points to 1,631.
- $77,000 carries two arguments at once: The 23.6% retracement of the $62,631 to $81,438 advance lands at $76,999, exactly where the range floor cluster sits. It is the last shelf before the market has to revisit the vertical candle that created this level.
The setup
Our 22 August map flagged $79,460 as the ceiling with three touches. It broke on 25 August and the market ran to $81,438, so the level did its job and then flipped. Price has failed there four times since 30 August.
Above price: $78,900 to $79,470, then $80,200 to $80,820 where three pushes stalled, then $81,250 to $81,440. Below: $77,365 to $77,670, then $76,650 to $77,000 which holds four lows and the 23.6% level, then $75,400 to $75,700, the 23 August low that anchors the range.
Inside it, a pennant has formed since 28 August. The upper boundary falls through the 30 August high at $79,376, the 31 August high at $79,231 and today's high at $79,180, three touches sloping about 22 points down per four-hour candle, and sits at $79,135. The lower boundary rises through the 30 August low at $76,999 and today's low at $77,504, two anchors, so it is a reference boundary. At this rate they converge within about two days, putting the apex on Friday's payrolls.
RSI on the four-hour is 43.3, mid-range, with no divergence either way.
Scenarios
- Bullish — pennant break and a retest of the top: The upper boundary gives way before the $79,470 zone does. A four-hour close above $79,470 reclaims the old ceiling and puts $80,200 to $80,820 in play. The structure voids below $76,650.
- Bearish — the floor and the retracement go together: Losing $77,504 exits the pennant before price reaches the base cluster. A close below $76,650 then removes that cluster and the 23.6% level in one move, leaving $75,400 to $75,700, and beneath it the 38.2% at $74,254.
- No confirmation: Closes between $77,504 and $79,135 through ISM, JOLTS, ADP and Friday's payrolls mean the pennant is still compressing.
What this tells us
A vertical move creates levels that have never been tested. August took price from $62,600 to $81,400 in four days, so everything between those numbers is empty of history: no prior consolidation, no repeated touches, nothing to lean on except retracement mathematics. And when a pattern narrows towards an apex that lands on a scheduled event, the chart is not predicting the event. It is telling you the market has run out of room to keep waiting for it.
Does $77,000 hold and confirm the August range as a base, or does payrolls week send Bitcoin back into the vacuum below it?
Any opinions, news, research, analyses, prices or other information contained on this website is provided as general market commentary and does not constitute investment advice. ThinkMarkets will not accept liability for any loss or damage including, without limitation, to any loss of profit which may arise directly or indirectly from use of or reliance on such information. Market Concepts · Lesson 14 — Building A Solid S/R MapLesson 14 - Building a Support & Resistance Map That Actually Holds Up
Difficulty: Intermediate
Every trader draws support and resistance. Very few draw levels that consistently hold. The difference isn't the tool — it's knowing which levels actually matter and which ones are just noise.
🔵 WHY MOST S/R MAPS FAIL
Open any trader's chart and you'll usually find the same thing: dozens of lines drawn everywhere, some of them long forgotten, most of them ignored by price. The map becomes clutter instead of guidance.
The problem isn't the concept. Support and resistance is one of the most basic and powerful ideas in trading. The problem is HOW those levels get chosen. When every minor high and low gets a line, the meaningful levels disappear in the noise. Every level looks equally important, so none of them are.
A good S/R map does the opposite: it isolates the few levels that actually carry weight, and ignores the rest.
🔵 WHAT MAKES A LEVEL MEANINGFUL
Not all swing points deserve a line on your chart. The ones that do usually share a few traits:
- Price has reacted from that level more than once — a single touch is a coincidence; multiple touches mean the market is watching that price
- The reactions were decisive — sharp rejections with clear momentum away, not slow drifts
- The level is visible on higher timeframes, not just the one you're trading — daily and 4H levels carry more weight than 5-minute ones
- The level lines up with something else meaningful — a prior swing high or low, a round number, an old range boundary
When two or three of these traits stack, you're looking at a level worth marking. When none of them do, you're probably drawing noise.
🔵 THE HIGHER-TIMEFRAME PRIORITY
The most reliable S/R levels come from higher timeframes. A daily support level respected by weeks of price action will dominate any 15-minute level you can find inside it.
The practical order most traders find useful:
- Start on the daily. Mark 2–4 clear, obvious levels that have been respected multiple times
- Drop to the 4-hour. Add 2–3 intermediate levels that sit between the daily ones
- Drop to your trading timeframe. Add only the levels that are directly relevant to your current setup
This prevents the clutter problem. Instead of forty lines fighting for attention, you have maybe eight — and each one has a clear role in the hierarchy.
🔵 FILTERING FOR STRENGTH
Once you've marked the candidate levels, filter them further. Strength comes from a few observable things:
- Number of tests — the more times price has reacted from a level (without breaking it), the stronger it is
- Age — a level that's been holding for weeks is more meaningful than one from yesterday
- Reaction size — clean, decisive bounces beat weak, hesitant reactions every time
- Volume on the reactions — heavier volume on the bounce suggests real participation
The strongest levels usually have all four working for them. The weakest levels have maybe one, and don't deserve much of your attention.
🔵 HOW LEVELS BEHAVE OVER TIME
S/R levels aren't permanent. They have a lifecycle: they form, get tested, hold multiple times, and eventually break. What happens after the break is often the most interesting part.
A broken resistance commonly flips to become support on the next retest. A broken support often becomes resistance. This role reversal isn't guaranteed, but it's one of the most reliable patterns in price action — because the traders who were positioned at the original level are now sitting on losses and looking to exit at breakeven when price comes back.
Watching this transition happen in real time is one of the higher-quality signals a chart gives you.
🔵 USING YOUR S/R MAP IN PRACTICE
Once you have a clean, filtered S/R map, a few practical uses emerge:
- Use levels as decision points, not entry triggers. Price reaching a level tells you WHERE to watch closely, not WHAT to do
- Combine S/R with other tools (order blocks, FVGs, liquidity zones) — when multiple concepts point to the same area, the level carries much more weight
- Update your map regularly. Old levels lose relevance, new ones form, and clutter accumulates if you don't clean up
- Trade the reactions, not the touches. Wait for price to actually show it's respecting the level before committing
🔵 COMMON MISTAKES TO AVOID
- Marking every visible swing point — most of them don't matter and just add noise
- Ignoring the higher timeframe — a strong 15-minute level inside a broken daily zone is much weaker than it looks
- Treating S/R as exact prices — think of levels as zones with a small buffer, not razor-thin lines
- Refusing to remove old levels that price has long since stopped respecting
🐳 PRO TIPS
- The best levels are the ones you can spot on the chart in under three seconds without any indicator — if you have to squint to find it, it's probably not important enough to trade
- Round numbers (10000, 50000, 100000) often act as strong S/R even without prior structure, because psychological levels attract orders naturally
- When a strong level finally breaks, don't just fade the break — watch for the retest, because that's usually where the higher-probability trade lives
- The cleanest S/R maps often use different colors or line styles to indicate strength — bold lines for major daily levels, thin lines for minor intraday ones
A good support and resistance map isn't the one with the most lines. It's the one where every line is there for a reason, and you can defend each one out loud.
Market Concepts — All Lessons
Lesson 01 — What Order Blocks Are
Lesson 02 — Zone Strength Isn't About Size
Lesson 03 — Entering Trades With Order Blocks
Lesson 04 — Old Order Blocks As New S/R
Lesson 05 — Breaker Blocks
Lesson 06 — HTF Blocks With LTF Entries
Lesson 07 — BOS vs Change of Character
Lesson 08 — Structure Quality: Strong vs Weak
Lesson 09 — Fair Value Gaps
Lesson 10 — Order Blocks + FVG Confluence
Lesson 11 — Swing Failure Patterns (SFP)
Lesson 12 — Buyside & Sellside Liquidity
Lesson 13 — SFP + Liquidity Combo
Best Regards, BigBeluga 🐳  Education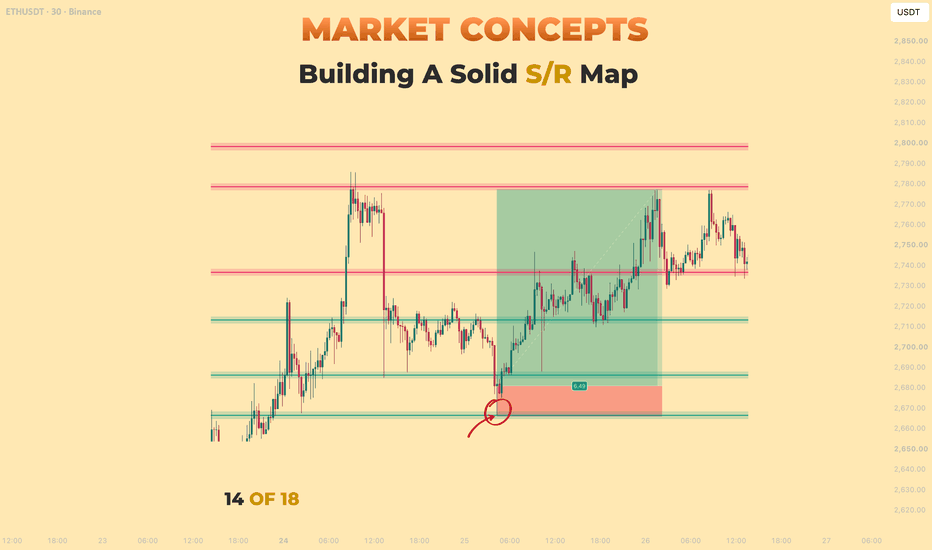
Long 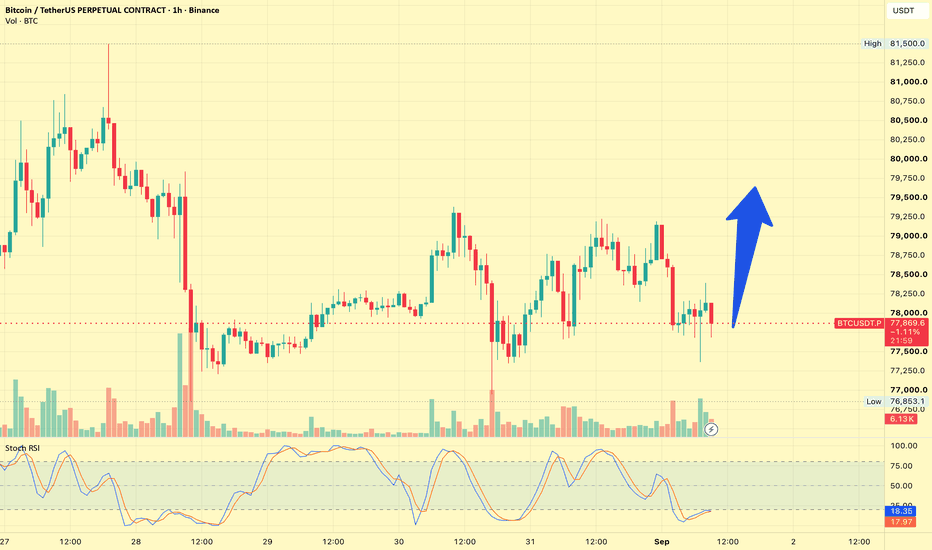
Long 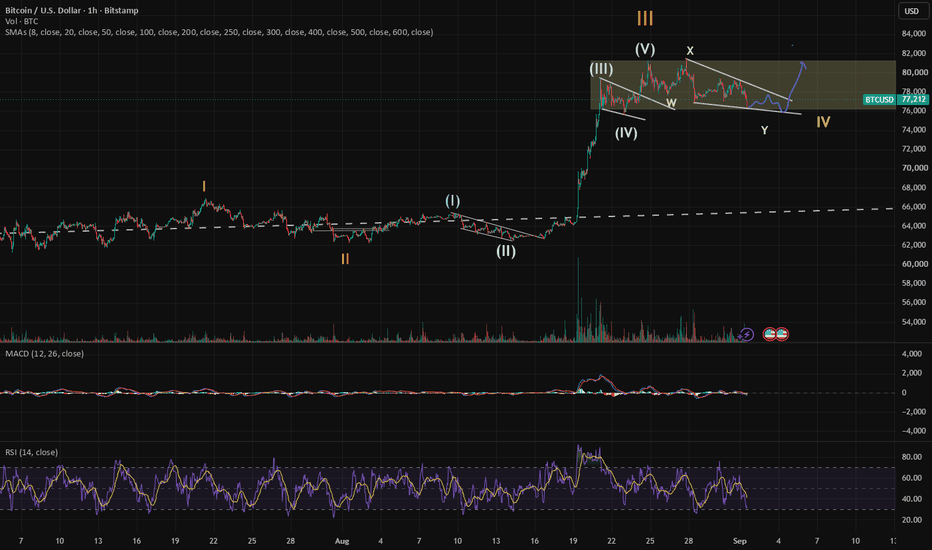
BTC SHORT TP:73,500 31-08-2026Alright, BTC might need one clean drop before giving us the next long opportunity 😮💨
We’re watching a possible short from 79,000–80,500, aiming for targets between 73,000 and 73,800.
This setup is based on the 4H timeframe, and we expect it to play out within 2 days.
Technical context: BTC could be setting up a downside move first, basically clearing the path before looking for a future long. The idea is to catch the drop, secure the move, and then stay ready for the next bullish setup once price reaches a better zone.
Manage your stop according to your strategy and don’t chase if the entry zone is missed.
We don’t use indicators, we’re not out here drawing lines or cute little shapes — I just give you a clean trade.
If price doesn’t move within the expected time, the trade becomes invalid. Short 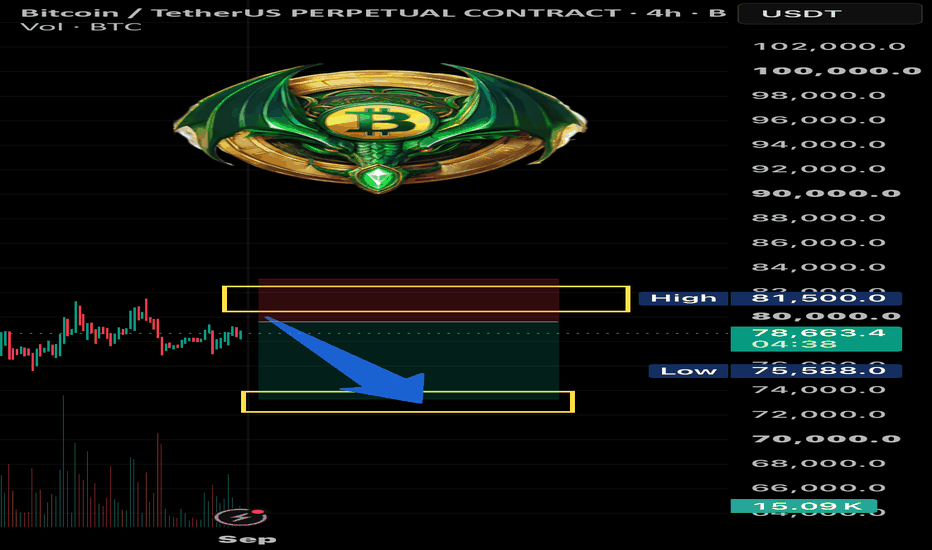
Long 
ARB/USDT: A Repeating Fibonacci Fractal, and Why 0.618 Keeps WinWeekly chart analysis — ARBUSDT
## The setup
Since its January 2024 all-time high of $2.4263, ARB has traded in three consecutive, self-similar cycles. Each cycle takes the prior cycle's swing high and low, builds a fresh Fibonacci retracement off it, and each new impulse move is roughly half the size of the one before it. It's a textbook diminishing-amplitude fractal — and once you overlay it with ARB's token-unlock calendar, the pattern starts to explain itself.
## The three cycles
**Cycle 1:** 0.4310 → 2.4263
**Cycle 2:** 0.2419 → 1.2412 (which is almost exactly Cycle 1's 0.618 retracement)
**Cycle 3:** 0.0704 → 0.6246 (almost exactly Cycle 2's 0.618 retracement)
In other words: every counter-trend rally inside the larger downtrend has topped out at the 0.618 retracement of the prior leg down, then rolled over into a new, smaller cycle. This has happened twice in a row without exception on this chart. Price is currently rebuilding off the Cycle 3 low of 0.0704, printing a strong weekly reversal candle, with the equivalent 0.618 level for this cycle sitting at 0.2821.
## Why 0.618, specifically? The unlock calendar lines up
This isn't just a technical curiosity — Arbitrum's vesting schedule maps onto the price structure surprisingly well:
- **The one break in the pattern** came in March 2024, when a one-time cliff unlock released roughly 1.11 billion ARB (about 87% of circulating supply at the time) to the team, advisors, and investors. That event overwhelmed the usual technical structure and drove price through 0.618 and further down toward the eventual Cycle 1 low near $0.43 — reached almost to the day in August 2024.
- After that cliff, Arbitrum shifted to steady linear unlocks of roughly 92.6 million ARB every month, a schedule that runs through March 2027. Once the shock event was behind it, the market went back to respecting technical resistance — both subsequent counter-trend rallies (into the Cycle 2 high near $1.24 in December 2024, and the Cycle 3 high near $0.62 later) stalled almost exactly at their respective 0.618 levels.
- The reasoning: a predictable, priced-in monthly drip of new supply is a persistent headwind but not a shock — it reinforces whatever level was already going to act as resistance (trapped sellers from the prior leg down), rather than overwhelming the chart the way a cliff event does.
## The lows aren't spikes — they're tested double bottoms
There's a fourth layer to the fractal that's easy to miss at a glance: none of the three major cycle lows are single sharp spikes. Each one is a double-bottom ("W") formation, and in every instance the second touch holds *above* the first rather than undercutting it:
- **~0.4310 (mid-2024):** price taps the level, ticks up, retests without breaking lower, then reverses into the rally toward 1.2412.
- **~0.2419 (mid-2025):** same shape — a touch, a small bounce, a second touch that holds, then the move up to 0.6246.
- **~0.0704 (mid-2026):** the clearest example on the current chart — several weeks of small-bodied candles hovering just above the low, testing it more than once without a fresh breakdown, before the large reversal candle that kicked off the current bounce.
This matters because a spike low usually reflects a single panic flush, while a tested double bottom with a rising second low suggests sellers were actually absorbed on the retest rather than simply running out of momentum. It's a classic accumulation signature, and the fact that it shows up at all three cycle bottoms — not just the current one — adds another layer of self-similarity to the fractal: each cycle doesn't just repeat in price ratio and rough duration, it repeats in the *shape* of its own bottom.
## Momentum confirmation
The weekly RSI shows the same fractal decay as price: three successive peaks, each one lower than the last (roughly 75 → 68 → 57). Connecting those peaks draws a clean descending trendline — and the current RSI uptick appears to be pushing back above that trendline for the first time this cycle. Worth confirming precisely on your own chart rather than taking this at face value, but if it holds and gets retested as support, it's a second, independent signal lining up with the price structure.
## Where this leaves the current setup
- Price is round-tripping off the Cycle 3 low with a large (~33%) weekly reversal candle — similar in relative size to the ignition candles that kicked off both prior cycle rallies.
- The next scheduled unlock (mid-September, ~92.6M ARB / under 1% of supply) is routine and in line with the ongoing monthly cadence — nothing on the calendar stands out as an unusual near-term shock.
- If the pattern holds a third time, the technically "expected" ceiling for this bounce is the 0.618 retracement at 0.2821 — not a breakout into the 0.5/0.382/0.236 zone, which would represent the pattern *breaking* rather than repeating.
- Separately, other technical takes on ARB (independent of this fib structure) have also flagged a descending-trendline breakout with a first recovery target in the low-$0.20s, based on prior instances of similar setups producing relief rallies over 100%. That's a useful outside sanity check pointing toward a similar zone.
## What would invalidate this
- A clean break and weekly close above 0.2821 (0.618) would be the pattern *breaking* rather than confirming — arguably bullish beyond what history here supports, but it would need a genuine catalyst (protocol-specific news, a shift in L2 competitive dynamics, or a broader altcoin risk-on regime) rather than just technical momentum.
- A failure to hold the current bounce and a fresh low below 0.0704 would suggest the fractal is decaying into a fourth, even smaller cycle rather than reversing.
- Ongoing monthly dilution is a real, structural headwind for any ARB rally regardless of how clean the chart looks — L2 competition and continued unlocks through March 2027 mean the token faces sustained, recurring supply pressure independent of price action.
---
*Not financial advice. This is a technical/structural read of price and on-chain vesting data, not a fundamental valuation of Arbitrum or a recommendation to buy or sell. Do your own research.*  Long
Long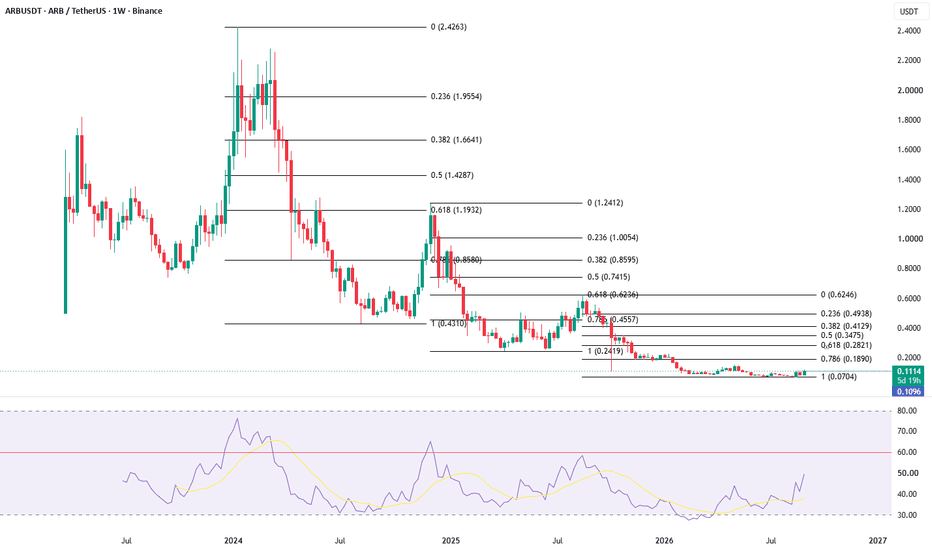
 Long
Long
BTC LongBroader Market Structure
BTC on the 15-minute chart is showing a bullish short-term structure. Price recovered strongly from the $77,000 area and has been printing higher highs and higher lows into the current $79,018 region. The chart does not show a clearly labeled CHoCH/BOS price level, so I would not assign an exact structural-break level that isn't visible. The important structural point is that the rebound has reclaimed the prior intraday swing area and is now testing the $79,000–$79,400 resistance region.
The broader move favors continuation higher as long as the recent demand structure remains intact.
Supply & Demand
The nearest demand zone is approximately $78,450–$78,700. This is a relatively fresh zone, and buyers previously stepped in strongly from this area, producing the latest expansion toward $79,000. Below it, the $77,700–$78,050 demand zone is stronger because price previously reacted aggressively there and launched another substantial move higher. The deeper $77,450–$77,650 region is additional support and would become important if the first two zones fail.
There is no clearly marked red supply zone immediately above current price, but the prior high around $79,394 is important resistance/liquidity. A clean break above that high would expose the $79,700–$80,000 psychological area.
Price Action in the Marked Region
Price is currently around $79,018 after a strong bullish expansion. Your projected path shows a pullback toward approximately $78,200–$78,500, followed by a potential bullish reversal and continuation toward $79,700+.
I agree with the general structure, but the ideal retracement would be into the marked demand rather than chasing price at $79K. If price pulls back into $78,450–$78,700 and produces rejection/absorption, that would provide a better confirmation for the next upside leg.
Bias & Expected Direction
Bias: Bullish
Expected path:
$79,000 → pullback toward $78,450–$78,700 → bullish reaction → $79,400 → $79,700–$80,000
The key bullish invalidation is a decisive break and acceptance below approximately $77,700. That would damage the current higher-low structure and open the door toward the deeper $77,450 area and potentially lower.
A clean breakout and acceptance above $79,394 would instead strengthen the bullish continuation thesis.
Momentum & Footprint Analysis
Momentum currently favors buyers. The strong upward displacement from the $77.7K–$78K area and the series of higher highs show aggressive demand.
The chart itself does not display footprint/cluster data, so there is no legitimate footprint confirmation I can claim from the image. At the marked demand, the ideal footprint confirmation would be sell-side absorption, positive delta divergence, stacked buy imbalances, or a failed auction below the demand zone. That would support the bullish continuation.
If price reaches $79.3K–$79.4K and shows buying exhaustion or heavy offer absorption, a deeper pullback becomes more likely before another attempt higher.
News / Macro Catalyst
There are significant current catalysts supporting the setup but also creating volatility. Bitcoin has gained roughly 23–26% during August, making it one of the strongest major assets for the month. Strategy also announced a new purchase of 4,603 BTC for approximately $369.7 million, bringing its holdings to 845,050 BTC.
However, the macro backdrop is mixed. Fed Chair Kevin Warsh's hawkish comments have pushed markets toward pricing a higher probability of a September rate hike, while renewed U.S.–Iran tensions have increased risk and oil-price volatility.
This combination explains why $79.4K–$80K is important resistance: bullish institutional demand is present, but macro conditions could create sharp rejection and volatility.
Overall Setup
Bullish structure → wait for pullback → demand reaction → continuation toward $79.4K/$80K.
Bullish above: $77,700
Key demand: $78,450–$78,700
Resistance: $79,394
Upside objective: $79,700–$80,000
Invalidation: sustained break below $77,700 Long 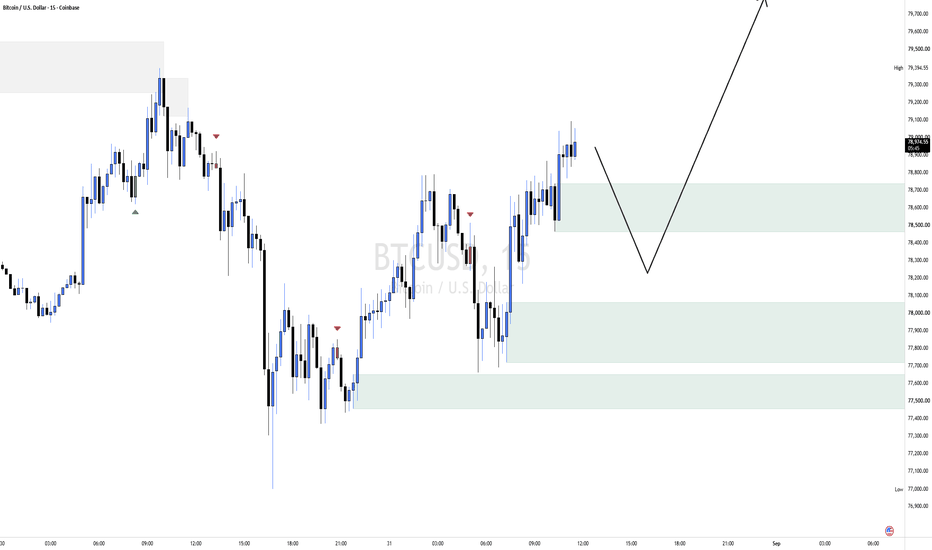
 Long
Long
 Long
Long
ADA | The Structure Flips Bullish — Buying The Discount!By analyzing the #Cardano (ADA) chart across multiple timeframes, we can see that the market is showing its first genuine signs of a bullish shift after an extended downtrend.
Price has broken a key level with force and is now offering a potential accumulation setup from discount. Let's break it down frame by frame.
📊 4H Timeframe
On the 4H, the broader move had been a clean downtrend — a steady sequence of bearish BOS pressing against a descending trendline.
That picture has now changed: price broke the Key Level with force and printed a bullish CHoCH, then returned to react from the Order Block ( OB + Key Level at $0.1631 – $0.1674 ) sitting right inside it. This is the first real signal of a shift in momentum.
What makes this compelling is location. Price is currently trading around $0.1719 , sitting below the 0.5 equilibrium ( $0.1691 ) — meaning we're in the discount half of the range, exactly where high-probability longs live. As long as price holds above the Protected Low at $0.1387 , the bullish structure stays intact. A break below it would flip the trend bearish again.
⏱️ 30m Timeframe
On the 30m, price is still working through a sideways range with a short-term down trend. There's a pocket of buy-side liquidity ($$$) resting at the equal lows around the current zone — and my expectation is for price to sweep that liquidity first, then push higher.
Alternatively, if price breaks the Flip Zone ( $0.1631 – $0.1763 ) with a few clean closes above it, I'll look for a corrective pullback into that zone and a bullish reaction from there — which would be a high-quality long entry.
🎯 The Bias
My base case is bullish while price holds above the Protected Low.
The cleanest path: a liquidity sweep of the equal lows below, a reaction from the OB / discount zone, and then a rally toward the buy-side liquidity (BSL) stacked overhead at $0.2185 , $0.2390 , and ultimately $0.2888 .
The fib projection lines up with this, targeting the 0.786 ($0.1866) and 1.0 ($0.1996) extensions on the way up.
In my view, buying the discount here — with risk defined below the Protected Low — offers a favourable setup, as long as buyers confirm with the sweep-and-reclaim.
📰 Fundamental Backdrop
The bullish technical shift is backed by a genuinely improving fundamental picture. Despite closing June down nearly 40%, ADA has since bounced roughly 18% off its $0.1387 low and reclaimed a top-15 ranking — and crucially, whale wallets holding 10M–100M ADA increased their share of supply from 37.66% to 38.13% right through the selloff, a clear sign that larger players were accumulating into weakness. On the catalyst front, Cardano's van Rossem hard fork (a major Plutus/scaling upgrade) is scheduled to potentially enact on one of several July dates, while on the regulatory side, Grayscale has filed with the SEC for a spot Cardano ETF ("GADA"), with a streamlined review window opening August 9. It's also worth noting July has historically been one of ADA's strongest months, averaging an 11.2% gain with six of the last nine Julys closing green. That said, risks remain: on-chain transaction activity recently hit a 45-day low, high Bitcoin dominance continues to squeeze altcoins, and broader sentiment sits in Extreme Fear — so confirmation of the technical setup matters before committing.
This analysis will be updated as the market evolves. If this breakdown added value, drop a like 👍 and a comment 💬 to support the work — and share where you see Cardano heading next! Best Regards, BigBeluga 🐳


