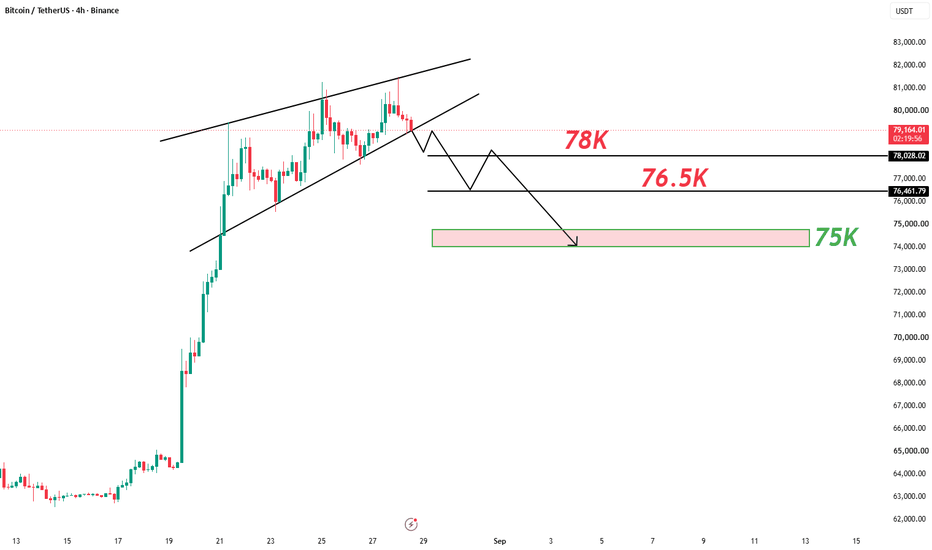
Short
Short
ARB: Is History About to Repeat? +120% SetupARB | Daily
I’ve been looking at ARB and the current structure is getting very interesting.
1. Descending channel
ARB has been moving inside a very clear descending channel, which has been remarkably consistent.
2. 2023 price pattern
I took the price action pattern from 2023 and projected it onto the current structure. The match with the previous movement is surprisingly close.
3. RSI
RSI is now sitting at almost exactly the same levels as it was back in 2023.
4. Open Interest
OI is slightly lower, but that’s not surprising after such a long bearish period. More importantly, we’re starting to see OI increase, just like in 2023.
5. VDS
I pushed VDS to its maximum sensitivity to find the strongest historical entries. Over the last few months, it has now triggered its **4th BUY**.
Price bounced after each signal, then moved lower again. But the declines are becoming relatively minor.
That tells me something important:
ARB doesn’t seem particularly interested in falling further.
### The setup
A pullback toward $0.088 , followed by a move toward the upper boundary of the channel around $0.19 .
That would be roughly +120% .
Of course, there are major risks.
The broader bearish market structure is still intact, and ARB has essentially been trading in a downtrend throughout its history.
So for now, the trend still gives shorts the priority .
But when the price pattern, RSI, OI and VDS start telling a very similar story…
What if the next move is simply history repeating itself?
 Long
Long
 Long
Long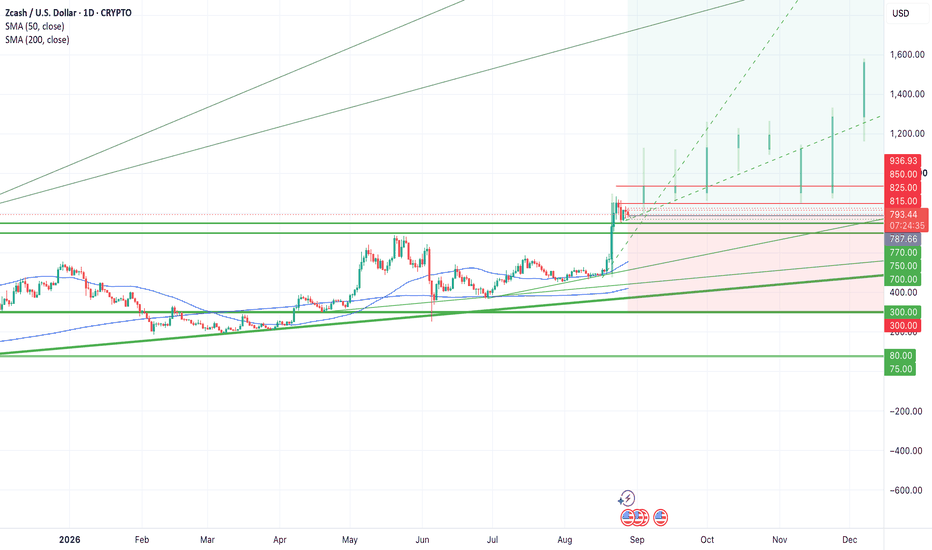
Short 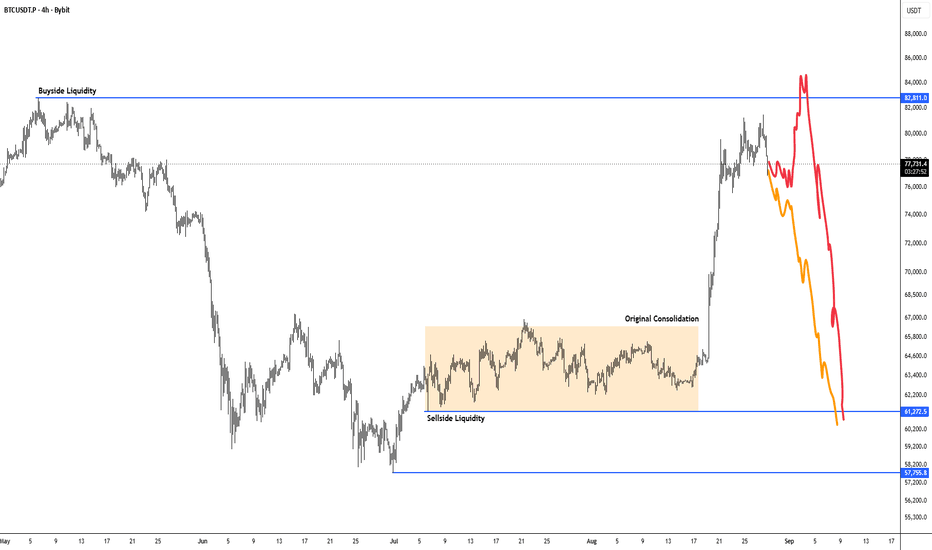
ENA 8H –Rising Channel Breakout Pulling Back Into Upper BoundarENA on the 8H timeframe is currently trading around 0.1707 after breaking above the upper boundary of a rising parallel channel near 0.1700–0.1750 on August 22 and spiking to a high near 0.1800 before pulling back, with price now sitting directly on the broken upper channel boundary as the first critical test of whether the breakout holds.
The chart shows a rising parallel channel originating from the late June low near 0.0704, with the lower trendline connecting that bottom through the July lows and the August 18 touch near 0.0820–0.0840, while the upper trendline connected the March high near 0.1250, the May high near 0.1350, and continued climbing into the 0.1700–0.1750 area before the breakout.
Price oscillated inside the channel across the entire visible structure, with the upper trendline capping every recovery including the June spike near 0.1190 and the August pre-breakout high near 0.0970. The breakout candle on August 21–22 pushed through the upper channel boundary near 0.1700–0.1750 and extended to a high near 0.1800 before pulling back. Price is now sitting directly on the broken upper trendline near 0.1700–0.1750, which is the first meaningful test of the breakout as the prior resistance attempts to flip to support.
A broken upper channel boundary retested from above is a textbook post-breakout setup, and the quality of the hold at 0.1700–0.1750 will determine whether the breakout extends or collapses back into the channel.
Key Levels To Watch
→ 0.1780–0.1800 Spike high, immediate resistance above
→ 0.1700–0.1750 Broken upper channel boundary, current support test
→ 0.1600–0.1620 Secondary support below breakout level
→ 0.1500–0.1520 Mid-channel reference, deeper support
→ 0.1300–0.1350 Prior upper trendline touch zone, support
→ 0.0970–0.1000 Mid-channel support zone
→ 0.0820–0.0840 Rising lower trendline, macro support (climbing)
A hold at the broken upper channel boundary near 0.1700–0.1750 and a recovery back above 0.1780–0.1800 would confirm the breakout as structural and open upside above the prior high with no visible channel resistance overhead.
A confirmed 8H close back below 0.1700–0.1750 and a return into the channel would invalidate the breakout, exposing price to a move toward 0.1600–0.1620 and potentially 0.1500–0.1520 on a deeper pullback back into the channel structure.
Upper channel boundary broken and now being retested from above. Hold 0.1700–0.1750 → breakout confirmed, eyes above 0.1800. Lose 0.1700–0.1750 → back inside channel, downside toward 0.1600–0.1500. Bias bullish above broken upper boundary. Shift only on confirmed close back below 0.1700–0.1750. Short 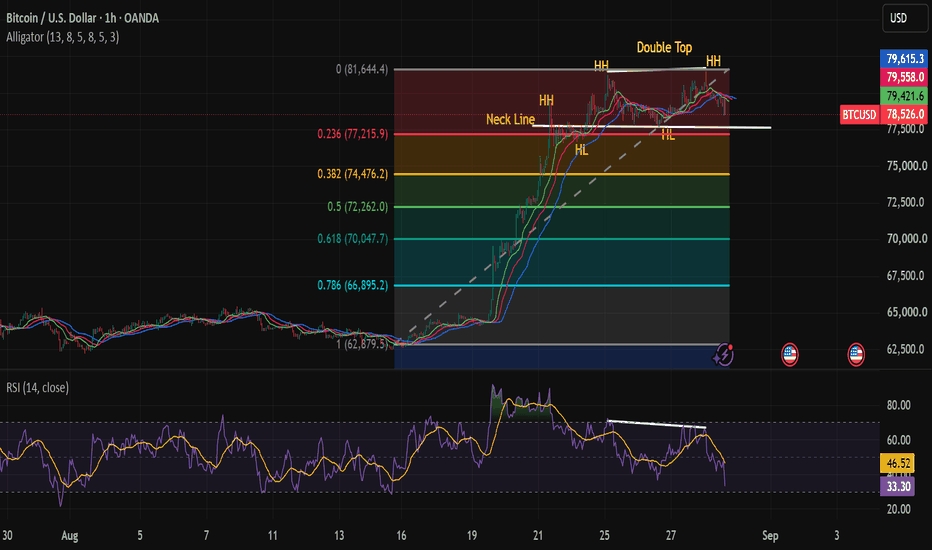
 Long
Long
BTC/USD 1H AnalysisBTC/USD 1H Analysis
BTC is currently around 78,970 and consolidating below the 80,700–81,000 resistance zone.
Key levels:
Resistance: 80,700–81,000
EMA 7: 79,392
EMA 21: 79,610
EMA 50: 79,468
Support: 78,000–78,300
Downside target: 77,000
Bullish target: 82,000–82,800
Bearish scenario
Price is struggling below the EMA cluster and remains under the major resistance zone. A rejection around 79,500–80,000 could send BTC toward 78,000, followed by 77,000 if support breaks.
Bullish scenario
A strong 1H close above 81,000 would invalidate the bearish projection and could trigger a move toward 82,000–82,800, as shown by the green arrow.
Overall bias: Bearish/neutral below 81,000.
Key confirmation: Break above 81K = bullish; rejection = downside toward 77K.
BTC/USD: Bullish Breakout Setup from SupportBitcoin is currently trading within an ascending structure, with price approaching a key resistance zone around 81,000–81,100.
A confirmed breakout and close above resistance could open the way for further upside toward the 81,500+ area. If price is rejected, the highlighted 77,700–77,900 support zone remains an important area to watch for a potential reaction.
A deeper pullback could bring the 75,800–76,000 support zone into focus.
Key levels:
Resistance: 81,000–81,100
Support: 77,700–77,900
Major Support: 75,800–76,000
Bullish confirmation: Breakout and close above resistance
This is a technical analysis scenario, not financial advice. Always manage risk and consider your own trading plan before making any decision. BTC/USD 1H Chart Analysis — Bullish Setup Above SupportBTC/USD 1H Chart Analysis — Bullish Setup Above Support
The chart shows a **bullish structure forming after BTC bounced from the 77,800–78,000 support zone**.
**Current price:** around **79,585**
#### Key levels
* **Support:** 77,800–78,000
* **Near-term resistance:** 80,000–80,500
* **Bullish target:** 81,500 → 82,300
* **Major invalidation:** sustained break below **77,800**
#### Bullish scenario
BTC is holding above the marked support zone and has been making a recovery toward the **80K area**. The projected setup suggests a possible short-term pullback toward **79,000–78,800**, followed by another bullish move if buyers defend that area.
A clean **1H breakout and close above 80,000–80,500** would strengthen the bullish case and could open the way toward **81,500 and 82,300**.
#### Bearish risk
If BTC loses **77,800** with strong 1H closes below the support zone, the bullish structure would weaken significantly, with downside risk toward approximately **76,500**.
**Overall bias:** 🟢 **Bullish above 77,800–78,000**, with confirmation needed around the 80K resistance.
Long 
 Short
Short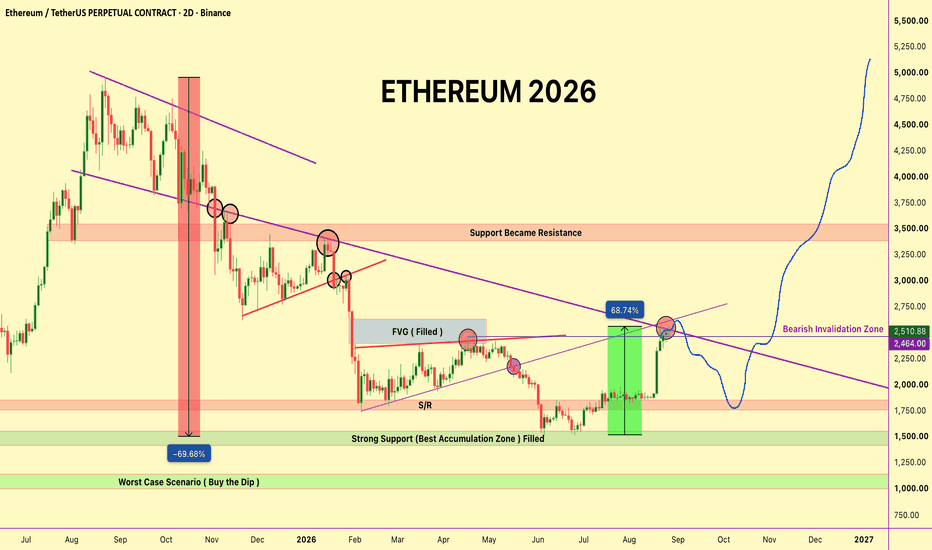
UNI/USDT H3: Testing KEY highs🎯 TP1: $4.7843 (+3.89%) │ TP2: $4.9501 (+7.49%)
🛑 SL: $4.2366 (-8.00%) │ R/R: 1 : 0.94
⚠️ Stop is wider than TP2 target (R/R < 1) — the closer target is hit more often, but adjust position size according to the stop loss
FUNDAMENTAL BACKGROUND
UNI is moving in line with the general altcoin rally, supported by strong BTC and ETH performance. The lack of fresh project-specific news shifts focus to technical factors and overall market appetite for risk assets. The Fear & Greed Index is in extreme territory, signaling overbought conditions but maintaining upward momentum. Recent macroeconomic data has not exerted significant pressure, leaving the crypto market to follow its own dynamics.
TECHNICAL PICTURE
Price is trading confidently above key moving averages (EMA 20 - $4.5, EMA 50 - $4.34), confirming the bullish trend. ADX 31.6 indicates strong directional momentum favoring buyers. MACD shows a positive histogram (0.01), albeit with minimal line divergence. VWAP ($4.56) acts as dynamic support, while the current quote ($4.6050) tests the upper boundary of the recent range ($3.2230–$4.8440).
PROBABILITY MODEL
The probability of continued growth is estimated at 50%, considering the strong trend and positive market backdrop. Correction risk (31%) stems from overbought conditions but lacks technical confirmation. A sideways scenario is least likely (19%) due to high volatility (ATR 0.1302).
DIRECTION
🟢 BUY on a bounce from VWAP $4.56, targeting a retest of the local high at $4.8440.
 Long
Long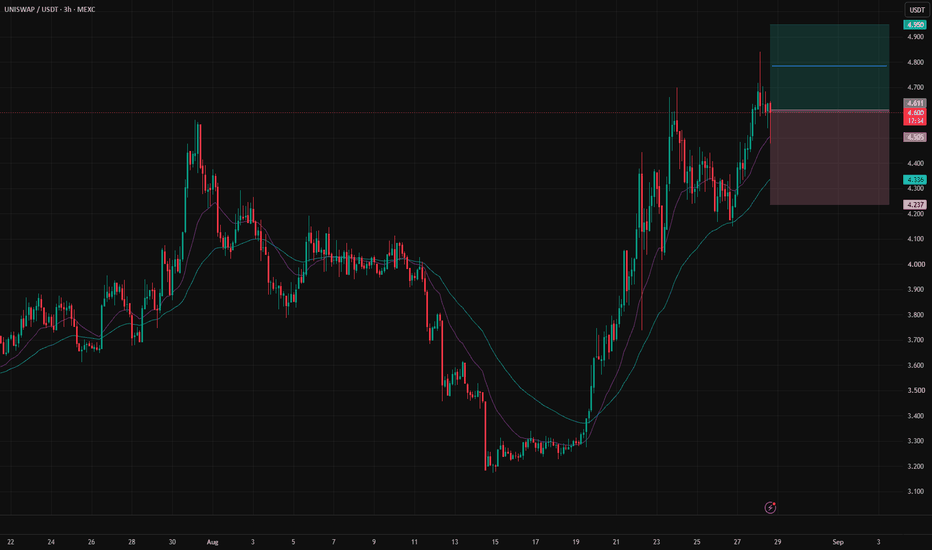
Short 
 Long
Long
 Long
Long
 Short
Short
ETHEREUM (ETH/USDT) — BULLISH TREND CONTINUATION SETUP 🟣 ETHEREUM (ETH/USDT) — BULLISH TREND CONTINUATION SETUP 🚀📈
⏱️ 2H Timeframe | Technical Market Structure Analysis
Ethereum is currently trading around $2,504, and the 2H chart is showing a clear bullish structure inside an ascending trend channel. Price has been respecting higher lows while consolidating near the upper-middle portion of the structure, suggesting that another expansion move could develop if buyers maintain control.
🟢 1. Overall Market Structure — BULLISH 📈
The broader structure on the chart remains bullish.
ETH has established a sequence of:
Higher Highs → Higher Lows → Higher Highs → Consolidation
The ascending trendline underneath price is acting as dynamic support. As long as ETH continues to respect this rising structure, the probability favors buy-side continuation rather than a major bearish reversal.
The important point is that the market has not broken the main bullish trendline yet.
📐 2. Ascending Channel Formation
The chart shows a clearly defined ascending channel with:
🔼 Upper trendline = potential resistance/target zone
🔽 Lower trendline = dynamic support
➖ Middle/dashed structure = current price equilibrium area
Price is currently around the $2,500 area, where it has been consolidating after the previous upward move.
This type of consolidation can potentially act as a continuation phase if buyers successfully defend the lower levels.
🔄 3. Possible Pullback Before Continuation
The projected path on the chart suggests a potential:
Current Zone → Pullback → Support Reaction → Recovery → Breakout/Expansion
A short-term retracement toward approximately $2,440–$2,400 could occur before the next significant bullish leg.
This doesn't necessarily mean the trend has turned bearish.
Instead, a controlled pullback into the ascending structure could provide the market with liquidity and allow buyers to reload before another move higher.
⚠️ Important: The projected movement is a technical scenario, not a guaranteed future path.
🟩 4. Key Support Zone — $2,400–$2,440
This is one of the most important areas on the chart.
The zone is close to the rising lower trendline and could become an important reaction area.
If ETH moves down into this region and produces:
✅ Strong bullish rejection
✅ Higher low formation
✅ Increased buying momentum
✅ Break back above short-term resistance
then the bullish continuation setup becomes considerably stronger.
A clean loss of this support area, however, would weaken the current bullish thesis.
🟦 5. FVG — Important Demand Area
The chart also highlights a large Fair Value Gap (FVG) around the $2,120–$2,220 region.
This area is significantly below the current market price and represents a deeper potential demand/rebalancing zone.
An FVG can sometimes act as an area where price returns to rebalance an inefficient move.
However, because this FVG is considerably below current price, it should be viewed as a deeper support/reference zone, not necessarily an immediate target.
🎯 6. Bullish Targets
If ETH successfully holds the ascending structure and buyers regain momentum, the chart suggests potential upside toward:
🎯 TP1 — $2,600
First important upside objective and psychological resistance.
🎯 TP2 — $2,680–$2,720
This area aligns closely with the upper portion of the current ascending structure.
🚀 TP3 — $2,760–$2,800
A stronger bullish expansion could potentially bring ETH toward the upper channel region and the psychological $2,800 level.
The upper trendline provides the major technical reference for the larger bullish scenario.
🔥 7. Bullish Confirmation
For the continuation setup to become stronger, I would watch for:
1️⃣ ETH holds $2,400–$2,440 support
2️⃣ A bullish rejection appears from the rising trendline
3️⃣ Price reclaims the recent local highs
4️⃣ ETH breaks and holds above $2,520–$2,550
5️⃣ Momentum expands toward $2,600+
A confirmed breakout with strong candles and volume would provide better confirmation than simply touching the resistance.
🔴 8. Bearish Invalidation
The bullish setup is not risk-free.
If ETH breaks below the ascending trend structure and starts forming:
❌ Lower Highs
❌ Lower Lows
❌ Strong bearish candles
❌ Sustained trading below the $2,400 area
then the current bullish continuation thesis would weaken significantly.
A deeper correction could then bring the $2,220–$2,120 FVG back into focus.
🧠 MARKET PSYCHOLOGY
The current structure looks like a market that has already experienced a strong impulsive move and is now absorbing/consolidating near the highs.
Instead of immediately assuming that consolidation means weakness, we need to watch where the next liquidity sweep occurs and how price reacts afterward.
A downside sweep followed by strong recovery could trap late sellers and provide fuel for another bullish expansion.
On the other hand, a breakdown with no recovery would indicate that sellers are gaining control.
📊 COMPLETE BULLISH SCENARIO
ETH holds the ascending support
⬇️
Short-term pullback toward $2,440–$2,400
⬇️
Bullish rejection / higher low
⬇️
Recovery above $2,500–$2,550
⬇️
Breakout toward $2,600
⬇️
Continuation toward $2,680–$2,720
⬇️
🚀 Potential extension toward $2,760–$2,800
⚠️ KEY LEVELS TO WATCH
Level Importance
$2,760–$2,800 🚀 Major bullish target
$2,680–$2,720 🎯 Upper-channel target
$2,600 🎯 First major upside objective
$2,500–$2,550 🔑 Breakout/confirmation area
$2,440–$2,400 🟢 Key pullback support
$2,220–$2,120 🟦 Deeper FVG/support zone
🏆 FINAL VIEW
ETH/USDT remains technically bullish on the 2H chart while the ascending trend structure remains intact. 📈
The most interesting scenario is a controlled pullback into the $2,440–$2,400 region, followed by a bullish reaction and recovery above the current consolidation.
If buyers manage to break the nearby resistance with strong momentum, the next major upside areas are $2,600 → $2,680–$2,720 → potentially $2,760–$2,800.
However, traders should avoid treating the projected path as guaranteed. Trendline support and price reaction are the key confirmation factors.
🔥 Structure is bullish. Patience is key. Let price confirm the move.
Educational purpose only. Not financial advice.
#ETH #Ethereum #ETHUSDT #Crypto #CryptoTrading #TechnicalAnalysis #PriceAction #Trading #Altcoins #Bullish #MarketStructure #FVG #TradingView Long 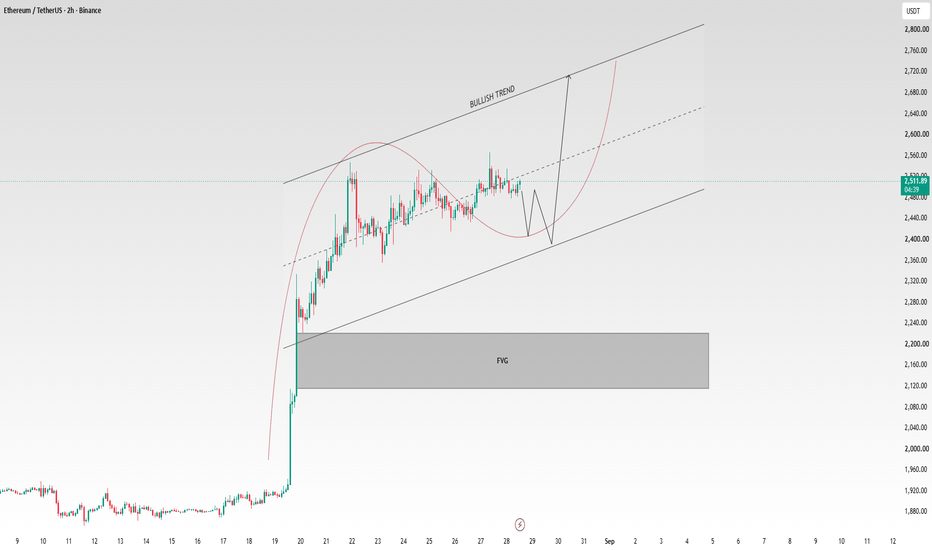
Short