LG ELECTRONICS (KRX: 066570)🏢 LG ELECTRONICS (KRX: 066570)
🇰🇷 South Korea’s consumer-electronics leader, offering diversified exposure to home appliances, premium televisions, automotive electronics, HVAC, robotics, and AI data-center cooling.
Approximately 34,900 employees · Technology / Consumer Electronics sector.
─────────────────────────────
💰 KEY VALUATION
• Price: KRW 201,500 (≈ $146.5)
• Market Cap: KRW 33.95T (~$24.7B)
• P/E (trailing): 38.0x
• Forward P/E: 12.6x (PEG 0.27)
• P/B: 1.06x
• Dividend Yield: 0.84% (KRW 1,700 DPS, payout 31.5%)
• 52-Week Range: KRW 72,000 – 438,000
• 52-Week Change: +167.95%
• Beta: 2.04 (high-volatility stock)
• Consensus: Buy · target KRW 216,923 (+7.65%)
─────────────────────────────
🗞 LATEST 3 NEWS
1️⃣ NVIDIA–LG AI/Robotics Collaboration (Aug 17–18, 2026)
NVIDIA CEO Jensen Huang’s daughter, Madison Huang, visited LG to discuss a robotics partnership, with AI and robotics serving as the primary catalyst.
2️⃣ Morgan Stanley Upgrade → +8.6% Surge (Aug 12, 2026)
The upgrade prompted a single-day increase to approximately KRW 205,000.
3️⃣ Q2 2026 Results: +28.1% Profit Growth (Jul 30, 2026)
Record Q2 profit driven by strong performance in appliances, premium TVs, and automotive electronics; KRW 100B buyback completed. (WSJ: “on track for recovery.”)
➕ Additional Note: A new Brazil appliance factory was announced on Aug 16.
─────────────────────────────
🏛 SHAREHOLDERS / INSTITUTIONAL
• LG Corp (controlling): ~35.3%
• National Pension Service: ~6.5%
• Vanguard: ~2.8%
• Dimensional: ~1.1%
• Skagen: ~1.1%
• Norges Bank: ~1.0%
Float ~121.8M shares · KRW 100B buyback completed in Q2 2026.
─────────────────────────────
🔍 TECHNICAL SETUP
Following a +60% rally from the July 30 low to the August 18 high, the price has pulled back to the 61.8% Fibonacci retracement level, often considered a key area for trend continuation.
✅ Holding above the 18 & 50 SMA
✅ Higher-low structure intact
✅ Uptrend valid
✅ New Moon on Aug 28 adds timing confluence
─────────────────────────────
🎯 TRADE PLAN
Level | Price (USD) | ≈ KRW equiv.
🟢 Entry | $145.53 | ≈ 200,200
🔴 Stop Loss | $135.53 | ≈ 186,460
🥇 Take Profit 1 | $165.89 | ≈ 228,190
🚀 Take Profit 2 | $200.00 | ≈ 275,130
Risk/Reward (TP1): ≈ 1 : 2.04
📌 Partial profits at TP1 → trail stop to breakeven → allow remaining position to run to TP2.
─────────────────────────────
⚠️ RISK NOTE
#LG #LGElectronics #066570 #KRX #KOSPI #ConsumerElectronics #NVIDIA #Robotics
#AI #Stocks #TechnicalAnalysis #Trading #Investing
For educational purposes only. Not financial advice.
 Long
Long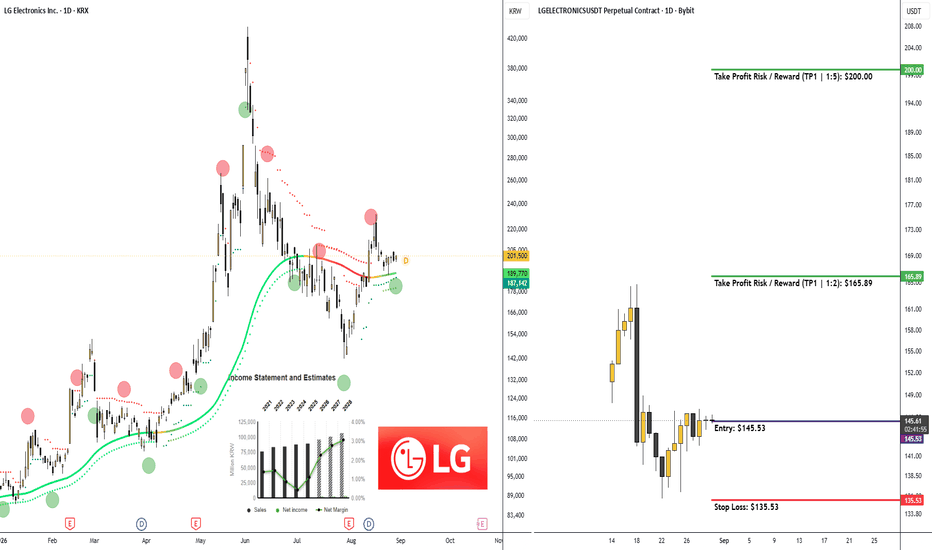
BTC Long1. Broader market structure
On the 15-minute chart, the broader intraday structure remains bullish, despite the current pullback. BTC first established a low around $77,945, then produced a strong bullish displacement and broke above the prior structure around $78,200–$78,250, confirming a bullish BOS. Price subsequently expanded toward $79,300–$79,395, creating a clear higher-high sequence.
The important point now is that the decline from the $79,300–$79,395 area has not yet broken the major bullish structure. The current move looks more like a retracement into demand rather than a confirmed bearish CHoCH. A decisive 15-minute break and close below approximately $78,100 would weaken this interpretation and could turn the short-term structure bearish.
2. Supply and demand
The $79,100–$79,395 supply region is strong because price repeatedly reacted negatively there, with sellers producing several sharp rejection candles and ultimately driving the current decline. Above it, the $79,300–$79,395 area is particularly important because it produced the strongest rejection.
The marked $78,100–$78,180 demand zone is currently the key support. It is strong because the previous departure from this area was aggressive: buyers stepped in and produced a large bullish displacement candle that launched BTC toward $79K+. That makes this zone a logical location for buyers to defend the retracement.
3. Price action in your marked region
This is the important part of the setup.
BTC has fallen aggressively from roughly $79,050 toward $78,380, but the decline is now approaching the $78,100–$78,180 demand zone. The current candles show bearish momentum, but price has not yet reached the main demand area.
Your projected path—drop into demand → reaction → bullish recovery—is technically reasonable.
I would specifically watch $78,180–$78,100 for a reaction. If price enters the zone and produces a bullish rejection, bullish engulfing candle, strong lower wick, or a small internal CHoCH back upward, that would provide confirmation for a move toward approximately $78,700–$78,900, with the larger objective potentially returning toward $79,000+.
However, if BTC simply slices through $78,100 with strong bearish candles, I would not buy the first touch. That would indicate that the demand zone is being consumed and the probability of a deeper retracement increases.
4. Current bias
Bias: Bullish, but waiting for confirmation at demand.
Expected direction:
$78,100–$78,180 demand → bullish reaction → $78,700–$78,900 → potentially $79,000–$79,300.
Key invalidation: approximately $78,000, with a decisive 15-minute close below the demand zone being the stronger structural warning. A break below $77,945 would invalidate the broader bullish intraday structure shown on this chart.
5. Momentum
Short-term momentum currently favors sellers because the decline from $79K has been relatively impulsive. But that does not automatically make the structure bearish—the bearish momentum is occurring inside a bullish retracement.
The strongest confirmation would therefore come after price reaches the green demand zone, rather than trying to predict the reversal while BTC is still falling toward it.
6. Macro/news catalyst
There is a meaningful macro catalyst behind the current volatility. Federal Reserve Chair Kevin Warsh's recent Jackson Hole comments were interpreted as hawkish, pushing market expectations toward a possible September rate hike and putting pressure on risk assets including Bitcoin. Reuters reported that September rate-hike expectations rose substantially after his comments, while Bitcoin fell sharply on Friday.
At the same time, recent ETF demand and broader liquidity factors are providing some support for BTC, creating a bullish technical structure versus bearish short-term macro pressure.
Bottom line: I would not chase the current short at $78,381. The better technical location is the $78,100–$78,180 demand zone. If buyers defend it and generate confirmation, the chart favors a rebound. If that zone fails decisively, stand aside—the next move could become substantially deeper rather than following the bullish arrow.  Long
Long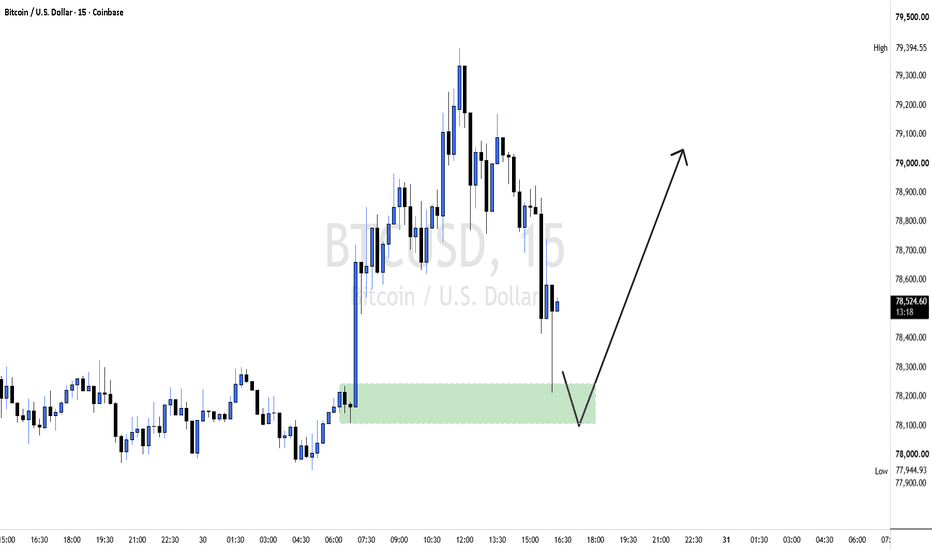
A Break Can Hold at Bar 10 Without Staying Above the LevelA close beyond a swing level and a successful trade are different observations. Even the word “held” needs a clock.
On this BTCUSDT four-hour chart, Structure Participation Matrix records a break only after a confirmed close beyond an eligible swing plus the ATR buffer. At that close it freezes four measurements of the completed leg: path efficiency, final close location, relative chart volume and a close-location-weighted volume proxy.
Those readings describe the move that has already occurred. A score of 60 is not a 60% probability, and reported volume is not proof of who traded.
The second observation comes later. With the default window, the script checks one closing price exactly ten confirmed bars after the break:
• HELD 10: that endpoint is beyond the broken level in the break direction.
• FAILED 10: it is not.
HELD does not mean that every intervening candle stayed beyond the level. Price can cross back through it during those ten bars and still finish on the broken side. The path matters to a trader even when the final label is identical.
The selected example shows exactly that. Its original swing high was 78,828.15. The August 24,
12:00 UTC bar closed at 79,100.01 and received a frozen 59.8 score. Eight bars later, the close
was 78,539.14, below the level. At bar ten it was 78,925.56, back above the level: HELD @10.
These are bar-open timestamps; each four-hour candle confirms at its close four hours later.
The adjacent 66.5-score break is marked FAILED @10. The bottom-right panel summarizes the most
recent event on the chart; it does not describe the selected 59.8-score example.
Here is a repeatable chart-reading exercise. Pick the most recent resolved break before looking at its score. Locate the break candle, count ten subsequent closed bars, and compare the tenth close with the original level. Then inspect the intervening candles separately. Do not move the horizon to make the example look better.
The matrix groups those endpoint observations by the score frozen at the break. Small samples remain “collecting”; missing volume or an overlong measured leg can leave a break UNSCORED. Changing the symbol, timeframe, settings or loaded history changes the sample.
The useful distinction is between three questions: what broke, what accompanied that move, and where price closed at a predefined horizon. None of them, by itself, supplies an entry, stop or trade return.
Educational chart study only. Historical endpoint frequencies are not forecasts or win rates. Education 
Ethereum (ETH): From $1,500 to a Potential $3,132 targetEthereum is trading around $2,500 on the 4-hour chart after a strong recovery from the $1,502.79 low.
The current structure is now approaching an important technical decision point at $2,560.33.
A sustained break above that level would confirm the higher-move scenario in the current Elliott Wave structure. From there, the chart identifies $2,740.92 and $2,869.19 as intermediate upside levels, with $3,132.53 as the larger target.
What makes the setup particularly interesting is that Ethereum is also attracting significant institutional demand while preparing for another major protocol upgrade.
--
What's Driving Ethereum?
The strongest current catalyst is institutional demand through U.S. spot Ethereum ETFs.
According to CoinMarketCap's latest market report, U.S. spot ETH ETFs recorded approximately $225.8 million in net inflows on August 28, marking nine consecutive sessions of inflows and bringing the nine-session total to roughly $1.42 billion.
BlackRock's Ethereum products have been a significant part of that institutional demand. Its ETHA fund had approximately $8.38 billion in net assets as of August 28, while its staked Ethereum product, ETHB, had approximately $846.6 million.
Ethereum also has a fundamental development catalyst ahead.
The network is preparing for Glamsterdam, a major upgrade planned for Q4 2026 that is focused on scaling Ethereum's Layer 1. The Ethereum Foundation says the upgrade will introduce changes including enshrined proposer-builder separation and block-level access lists.
Testing is already underway through the Platåberget testnet, with developers working through the upgrade's consensus and execution-layer changes.
So the current narrative is relatively clear:
Institutional demand is providing the immediate market catalyst, while Ethereum's development roadmap provides a longer-term fundamental backdrop.
--
Technical Analysis
The 4-hour structure shows Ethereum completing a substantial decline into the $1,502.79 low before beginning a new impulsive recovery.
From that low, the chart labels an advancing sequence through waves 1, 2, 3, 4 and 5, followed by a larger corrective/consolidation structure.
Price then broke sharply higher from the $1,855.33 area and moved into the current $2,500 region.
The market is now pressing against the chart's $2,560.33 confirmation level.
That level is important because a sustained break would confirm the scenario for a higher move.
Key Levels
$2,560.33 — confirmation of move higher
$2,740.92 — first upside level shown
$2,869.19 — larger Wave 3 / (C) target
$3,132.53 — major upside target
$1,855.33 — key structural reference
$1,502.79 — major chart low
The chart also highlights an ETH futures price gap between roughly $1,925 and $2,240.
That gap is important because the chart explicitly allows for a deeper retracement into this area before the larger upside move develops.
Bullish Scenario
The cleanest bullish scenario is a sustained break above $2,560.33.
If confirmed, the chart points first toward:
$2,740.92 → $2,869.19
Beyond that, the larger projected target is:
$3,132.53
However, the chart also presents an alternative path in which Ethereum first retraces into the highlighted $1,925–$2,240 futures gap before resuming higher.
That means a pullback into the gap would not necessarily invalidate the broader bullish structure.
Bearish Scenario
The first bearish development would be a failure to reclaim $2,560.33 followed by a deeper correction.
The chart specifically highlights the $1,925–$2,240 futures gap as an area that could be revisited.
A deeper move toward $1,855.33 would become increasingly important for the current structure.
The major chart low is $1,502.79.
Rather than treating every pullback as bearish, the key distinction is whether Ethereum is simply filling the highlighted gap before another advance or whether the larger impulsive structure begins to break down.
--
Kap Waves Outlook
Ethereum currently has a strong combination of institutional demand, improving protocol fundamentals and a constructive technical structure.
The ETF data is particularly notable: nine consecutive sessions of inflows totaling roughly $1.42 billion is a meaningful demand signal.
At the same time, Ethereum's upcoming Glamsterdam upgrade is advancing through public testing, with the upgrade designed to improve Layer-1 scalability.
But technically, the next phase still needs confirmation.
$2,560.33 is the level to watch.
A sustained break above it would strengthen the current wave interpretation and open the path toward $2,740.92, $2,869.19 and potentially $3,132.53.
The alternative is a retracement into the $1,925–$2,240 futures gap before the next attempt higher.
For Kap Waves, the structure remains constructive, but confirmation comes above $2,560.33.  Long
Long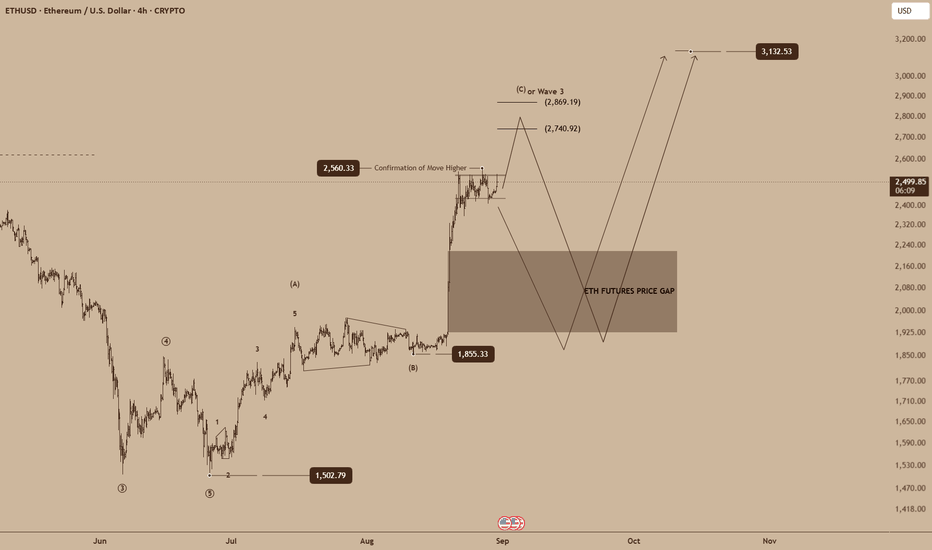
 Long
Long

Bitcoin: First Impulse, Real Confirmation?This 4-hour Bitcoin analysis is based on the structural scenarios previously discussed on the higher timeframes and now focuses on the market's first potential impulsive move.
The recent advance from the marked area raises the possibility that Bitcoin is developing its first valid five-wave impulsive structure. If this count remains consistent with the rules and guidelines of the Elliott Wave Principle, it could become the first important structural evidence supporting the bullish scenario.
However, a five-wave advance alone is not enough to confirm the beginning of a new bull market. After the impulsive structure is completed, the market should develop a clear corrective structure proportional to the preceding advance while remaining above the key invalidation area.
The next stage will be crucial. After the correction, price action should once again demonstrate impulsive characteristics. A new Impulse, a Leading Diagonal, or nested 1–2 structures could provide stronger structural evidence that the market is developing a larger bullish cycle.
On the other hand, if the current advance eventually develops into only the first leg of a larger corrective structure, the bearish scenario will remain valid. In that case, the current five-wave move could represent Wave A or the first leg of a broader correction rather than the beginning of a sustained bullish trend.
Therefore, the most important question at this stage is not simply whether Bitcoin moves higher or lower.
The first impulsive move is the evidence. The structure that follows will provide the confirmation.
This analysis is based on market structure and the rules and guidelines of the Elliott Wave Principle. The preferred interpretation will continue to be reassessed as new price action develops.
— Mr. Nobody
Independent Elliott Wave Principle Researcher
“Patterns whisper. I listen.” 📊🎧
Bitcoin
2 days ago
Bitcoin Crossroads
BTCUSD — Chapter 2: Structure Before Fortune
Long 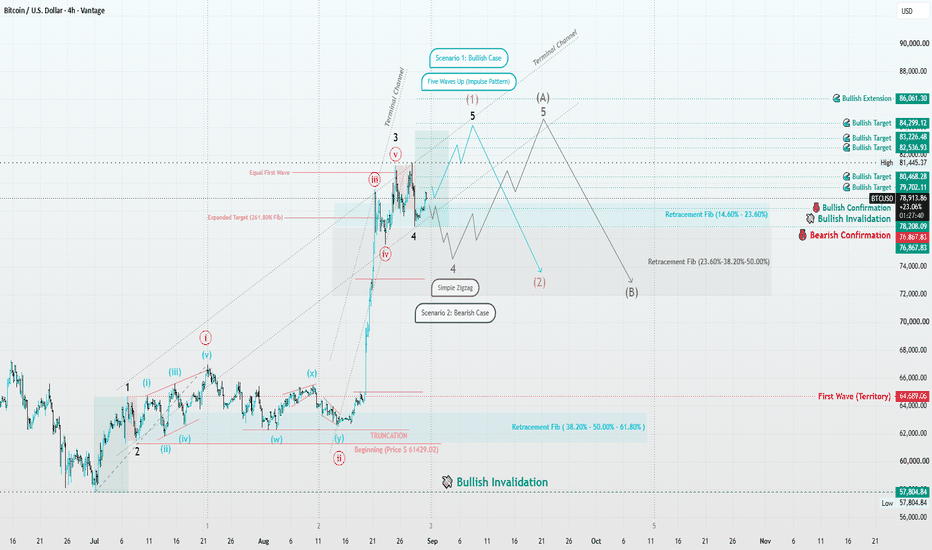
Bullish momentum to continue?Bitcoin (BTC/USD) is falling towards the pivot and could bounce towards the 1st resistance, which is a pullback resistance.
Pivot: 74,570.88
1st Support: 65,844.01
1st Resistance: 85,317.68
Disclaimer:
The opinions given above constitute general market commentary and do not constitute the opinion or advice of IC Markets or any form of personal or investment advice.
Any opinions, news, research, analyses, prices, other information, or links to third-party sites contained on this website are provided on an "as-is" basis, are intended to be informative only, and are not advice, a recommendation, research, a record of our trading prices, an offer of, or solicitation for, a transaction in any financial instrument and thus should not be treated as such. The information provided does not involve any specific investment objectives, financial situation, or needs of any specific person who may receive it. Please be aware that past performance is not a reliable indicator of future performance and/or results. Past performance or forward-looking scenarios based upon the reasonable beliefs of the third-party provider are not a guarantee of future performance. Actual results may differ materially from those anticipated in forward-looking or past performance statements. IC Markets makes no representation or warranty and assumes no liability as to the accuracy or completeness of the information provided, nor any loss arising from any investment based on a recommendation, forecast, or any information supplied by any third party. Long 
 Long
Long
TradeCityPro | Bitcoin Daily Analysis #358👋 Welcome to TradeCity Pro!
Let’s analyze Bitcoin. Today is the last day of our weekly candle.
⌛️ 1 Hour Time Frame
Yesterday, I told you that if Bitcoin managed to consolidate above 77795, it would invalidate the bearish move it had made. That’s exactly what happened, and price is now moving toward the main resistance at 80621.
📊 Market volume has increased slightly compared to yesterday, but it is still very low overall, so we need to wait for the new weekly candle.
✔️ At the moment, a support zone has formed between 77347 and 77795. If price forms a lower high compared to 80621, the probability of breaking this zone increases significantly. If price consolidates below this zone, we can open a short position.
💡 For a long position, a break above 80621 is a very good trigger and is one of the levels we absolutely should not miss if it breaks.
⚖️ As long as price remains between our support zone and the 80621 high, it’s better not to open any significant positions.
❌ Disclaimer ❌
Trading futures is highly risky and dangerous. If you're not an expert, these triggers may not be suitable for you. You should first learn risk and capital management. You can also use the educational content from this channel.
Finally, these triggers reflect my personal opinions on price action, and the market may move completely against this analysis. So, do your own research before opening any position.  Long
Long
Long 
 Long
Long
 Short
Short
 Long
Long
Short 
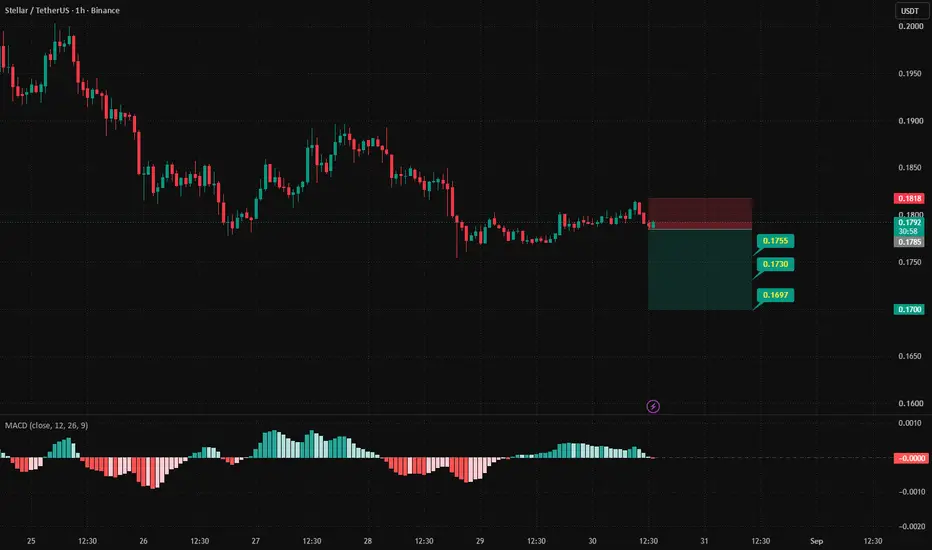
XLM ForecastBINANCE:XLMUSDT On the higher timeframe, we are seeing an overall downtrend followed by a corrective move. However, the smaller bearish waves are strong and impulsive, while the smaller bullish waves are relatively weak and corrective.
If our NEW trigger breaks strongly to the downside, we expect further downside and a continuation of the bearish move.
I would greatly appreciate hearing your technical opinions and insights on this potential scenario.
⚠️ Risk Disclaimer
All analyses, market views, and scenarios presented on this page are provided for informational and educational purposes only and should not be considered financial advice or a recommendation to buy or sell any financial instrument.
Financial markets involve substantial risk, and none of the scenarios presented here are guaranteed to occur. Each trader is solely responsible for their own trading decisions, risk management, and any profits or losses resulting from their trades.
Please consider your own financial situation, risk tolerance, and trading strategy before making any trading decision. Do not rely solely on the information provided on this page when making investment or trading decisions.  Short
Short
XLM ForecastBINANCE:XLMUSDT On the higher timeframe, we are seeing an overall downtrend followed by a corrective move. However, the smaller bearish waves are strong and impulsive, while the smaller bullish waves are relatively weak and corrective.
If our trigger breaks strongly to the downside, we expect further downside and a continuation of the bearish move.
I would greatly appreciate hearing your technical opinions and insights on this potential scenario.
⚠️ Risk Disclaimer
All analyses, market views, and scenarios presented on this page are provided for informational and educational purposes only and should not be considered financial advice or a recommendation to buy or sell any financial instrument.
Financial markets involve substantial risk, and none of the scenarios presented here are guaranteed to occur. Each trader is solely responsible for their own trading decisions, risk management, and any profits or losses resulting from their trades.
Please consider your own financial situation, risk tolerance, and trading strategy before making any trading decision. Do not rely solely on the information provided on this page when making investment or trading decisions. Short 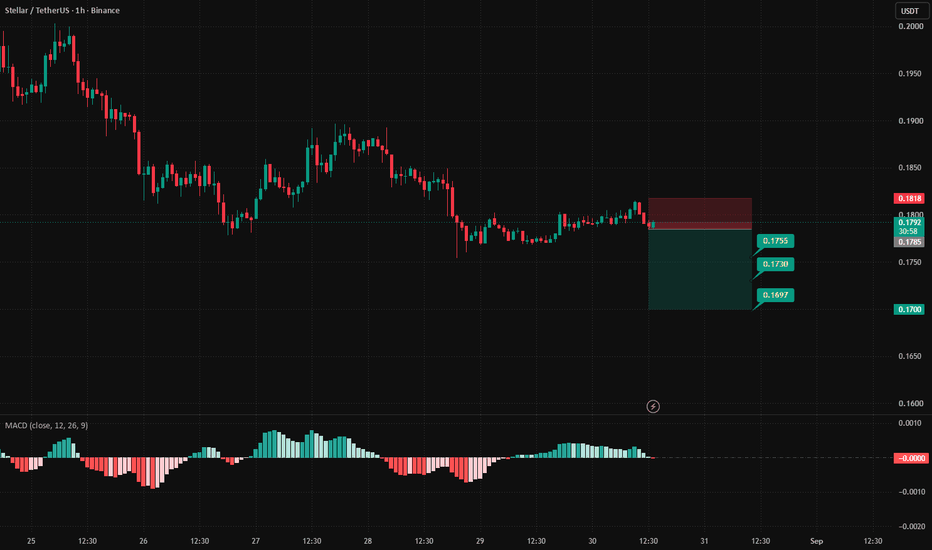
Long 
 Long
Long