Long
Long
 Long
Long
 Short
Short
BTC Bearish Confirmation Received | 76.6K Is the Next Key Level# Bitcoin Market Analysis (BTCUSDT)
## Quick Summary
**Bias:** Bearish / Correction Confirmed
**Confirmed Signals:** 1H • 2H • 3H
**Next Confirmation:** 4H Timeframe
**Key Level:** 76.6K
---
# Previous Result
BTC has now provided the confirmation I was waiting for on multiple higher timeframes.
We have received signals confirming the beginning of the corrective/bearish structure on:
• **1H Timeframe**
• **2H Timeframe**
• **3H Timeframe**
This gives stronger confirmation that the market structure is entering a new corrective or bearish phase.
---
# Market Bias
**Bearish — Waiting for Final 4H Confirmation**
The bearish/corrective signals are now confirmed across multiple timeframes.
However, the next important confirmation will come from the **4H timeframe**.
The key level I am monitoring before evaluating this confirmation is **76.6K**.
---
# Current Scenario
We have now received confirmation of the beginning of the BTC correction/bearish structure through the **1H, 2H, and 3H timeframes**.
The next important step is monitoring the **4H timeframe**.
I will closely evaluate the 4H structure after BTC breaks below the **76.6K level**.
Based on the current structure, I consider:
• **Blue Wave C completed**
• **Green Wave A completed**
However, there is still a possible higher-timeframe interpretation of Green Wave A.
If BTC develops another corrective move, **Green Wave A may still be active within the 1D timeframe structure**.
On the other hand, if the current bearish move develops into a stronger trend continuation, the entire current structure could be interpreted as a **correction within the 1W timeframe**.
For now, I will continue monitoring the structure step by step and wait for the next confirmation.
---
# Key Confirmation
🟢 **Confirmed Signals**
• **1H Bearish/Correction Signal**
• **2H Bearish/Correction Signal**
• **3H Bearish/Correction Signal**
🔴 **Next Key Level**
• **76.6K**
⏱️ **Next Important Timeframe**
• **4H**
---
💬 **What do you think?**
Will the break below **76.6K** confirm a stronger bearish continuation, or will BTC develop another corrective structure first?
👍 If you find this analysis useful, don't forget to follow **MAS Crypto Analysis** for future Bitcoin updates.
*This publication is intended for educational and market analysis purposes only and does not constitute financial advice.*
#Bitcoin #BTCUSDT #BTCUSD #Crypto #PriceAction #ElliottWave #WaveAnalysis #SupplyAndDemand #TrendAnalysis  Long
Long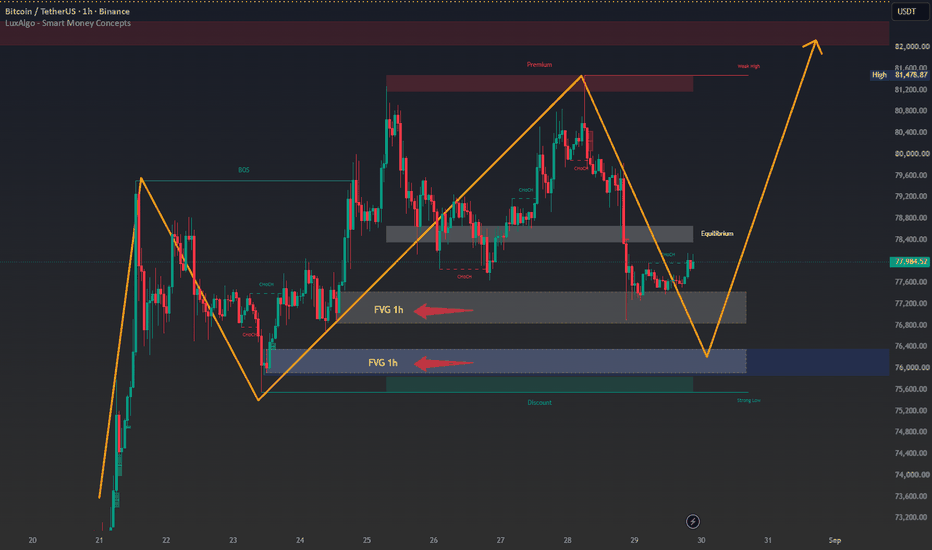
 Short
Short
 Long
Long
 Long
Long
TOTAL - Why This Monthly Close MattersThis is an updated outlook to this idea:
In that idea I outlined how TOTAL was likely nearing the lows around $2T. I stated: "I am expecting a local low, if not the bear market bottom, to form between $1.9 trillion and $2 trillion."
The low formed at $1.99 trillion, and since then the total market cap has added over $700 billion from that low to the recent high.
Why This Monthly Close Matters
August is about to have its monthly close in the next couple of days, and the total market cap is sitting at a critical level right now. Let me explain why.
The $2.6 trillion to $2.65 trillion level (yellow ray) is arguably the most important crypto market cap level for distinguishing bear markets from bull markets. I have outlined some of the key monthly closes that have used this level as major selling pressure when price was trading below it, and major buying support when price was trading above it (yellow arrows). Take a close look at this chart and specifically notice how many times the monthly candles have closed right at this yellow ray.
Once again, the market cap is about to close its monthly candle right at this same level. So what does this mean?
Since price is still trading below this level, it should act as a zone for sellers to step back in once again. This makes sense when zooming into the lower timeframe, where the total market cap has now established a quad top around the $2.71 trillion level. You can find that related idea here:
The good news is that the next major pullback from this level is likely to establish the next macro low before the true bull market begins. This gives us a very clean level to track money flow between bear and bull market conditions. As long as price continues closing below it, sellers can still regain control, and further outflows should be expected from this key market cap level.
However, once price does close a monthly candle above this level, the entire dynamic flips. The $2.6 trillion level would then start acting as new support and demand, and that would likely kick off the next bull market. Once the market cap closes above it, it becomes highly unlikely we see another monthly close below that level, as the next bull cycle takes hold.
I also want to outline something developing on the RSI. In my last idea I pointed out how the RSI was nearing the low (green trendline) and what happened after is price did find its low right there, with trend momentum beginning to increase off that level.
Now the RSI has entered what I consider the midpoint of the trend. Looking at the heartline (50 level) of the weekly RSI channel, it has historically acted as either a bottom or a top depending on which direction momentum was approaching it from. I have outlined these periods with white boxes, since once the weekly RSI decisively broke above this median line, it served as another clear indication of the bull market beginning.
Right now, it appears the RSI will close the month below this median line, which could look similar to what occurred last cycle as the monthly RSI was coming out of the bear market. Keep a close eye on both the RSI and the market cap at this key $2.6 trillion level heading into September.
Another idea related to this, but specifically focusing on Bitcoin is this one:
PAX GOLD BEARISH SETUP: IS ANOTHER DROP TOWARD THE LOWS COMING?Yello Paradisers! are #PAX Gold bulls about to get trapped before another strong move to the downside? Price action is currently showing a high-probability bearish setup, supported by both market structure and Dow Theory.
💎#PAX Gold first formed a clear Double Top pattern, followed by a decisive break of market structure. After that breakdown, price created another Lower Low, confirming that sellers remain in control and that the broader short-term structure is still bearish.
💎Right now, price is correcting the latest bearish impulse and has retraced into the 0.78 Fibonacci level. This is an important area because price reacted strongly from it and then formed another Lower Low on the smaller timeframe.
💎That lower-timeframe confirmation shows clear rejection from the retracement zone and further strengthens the probability that the correction is ending.
💎As long as the current bearish structure remains intact, we can expect price to continue moving lower toward the previous low, which is also acting as an important support zone and the most logical downside target for this setup.
💎The bearish scenario will be invalidated if price breaks and closes above the previous swing high, as that would signal that sellers are losing control and the current market structure is changing.
The key here is not to chase the move. The highest-probability trades come from waiting for confirmation, respecting invalidation levels, and allowing the market structure to do the work. Discipline and patience will always outperform emotional execution over the long run.
MyCryptoParadise
iFeel the success🌴
 Short
Short
Short 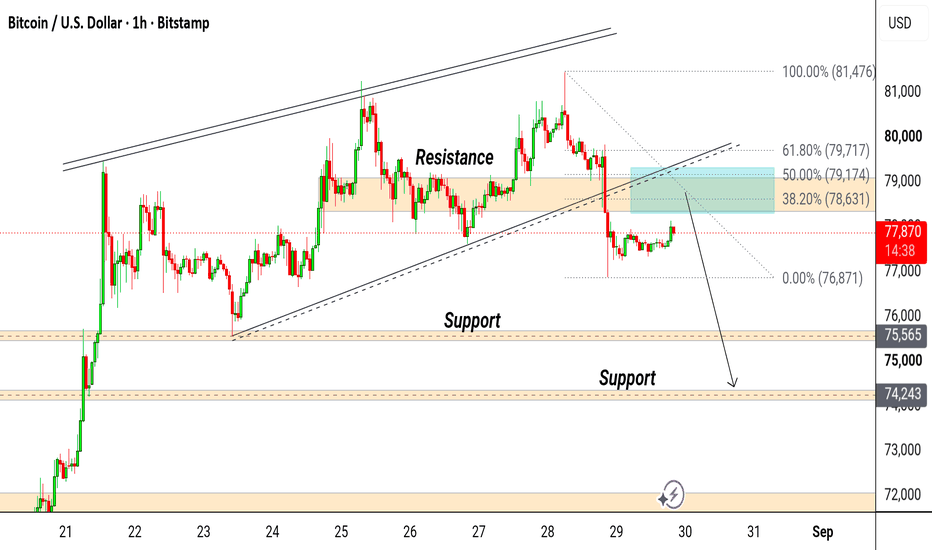
XRP/USDT | H2 | SURGE AMID BITCOIN RALLY🎯 TP1: $1.4127 (+1.35%) │ TP2: $1.4267 (+2.35%)
🛑 SL: $1.3524 (-2.98%) │ R/R: 1 : 0.79
⚠️ Stop is wider than TP2 target (R/R < 1) — the closer target is hit more often, but size your position according to the stop
FUNDAMENTAL BACKGROUND
The main driver for XRP in recent days is the overall crypto market uptick following the Bitcoin and Ethereum rally. Institutional interest in altcoins is growing, and XRP is gaining momentum through risk-on sentiment. Project-specific factors include ongoing XRP-ETF discussions with notable inflows, as well as infrastructure news (withdrawal bridge amendment, Evernorth progress). These news items are more medium-term in nature, so in the short term the price reacts in waves rather than a sustained trend. No significant macro releases are expected in the coming days, leaving technicals as the main guide.
TECHNICAL PICTURE
The price is below the Ichimoku cloud ($1.40–$1.43), creating technical resistance in the $1.40–$1.43 zone. The tenkan-sen line ($1.39) has aligned with VWAP ($1.39), forming the nearest support — as long as the price holds above it, the bullish scenario remains intact. The Williams indicator at -58.3 points to a neutral zone without overbought conditions, leaving room for upside. The Keltner channel width (4.8%) indicates moderate volatility — a breakout above $1.40 could accelerate the move toward $1.43 (kijun-sen and senkou B).
PROBABILITY MODEL
The market is in a bullish mode with a 40% probability of continued upside versus 39% for a bearish reversal — the balance favors buyers, but only slightly. The high probability of a sideways move (21%) reflects technical uncertainty near key levels. Model confidence (50%) leaves room for false moves, so the trader should wait for confirmation of a $1.40 breakout on volume.
DIRECTION
🟢 BUY — the price is consolidating near VWAP support with a neutral Williams reading, indicating no overbought conditions  Long
Long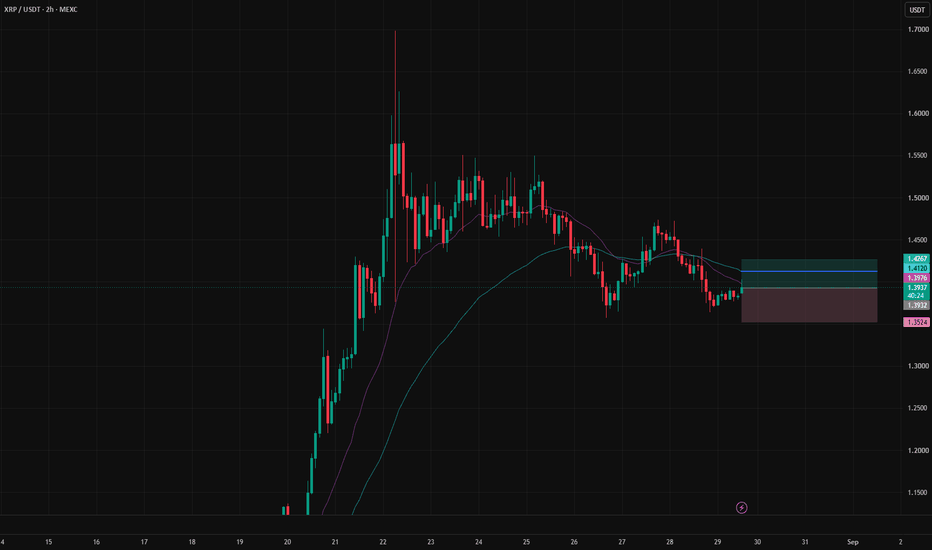
 Long
Long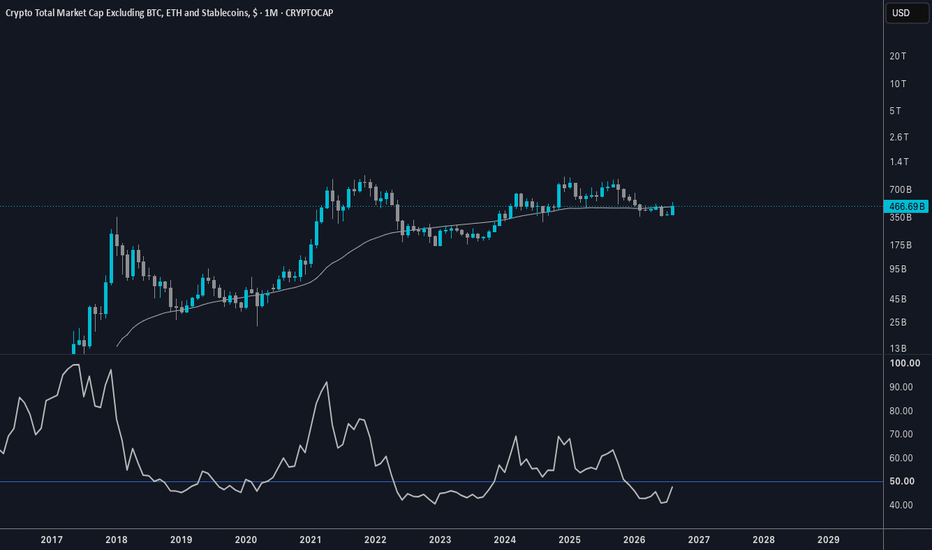
 Long
Long
BTCUSD LONG SETUP — 8H Bullish ReversalBTCUSD | 8H
📈 BUY: 77,400–78,050
🛑 SL: 76,050
🎯 TP1: 79,665
🎯 TP2: 80,300
Bitcoin is reacting strongly from the 76,880 support zone after the recent bearish move. The latest candles show buyers stepping back in, creating a potential bullish reversal from the lower trend-channel area.
The key level is 77,400–78,050. If BTC maintains this zone and continues building bullish momentum, the next major objective is the 79,665 resistance, with potential continuation toward 80,300.
📌 Bullish confirmation: A strong 8H close above 78,200 would strengthen the setup.
⚠️ Invalidation: A decisive break below 76,050 cancels the bullish idea.
BTCUSD BIAS: BUY 🟢
Wait for confirmation and proper risk management. Long 
 Long
Long
 Long
Long
BTCUSD LONG SETUP — 4H Bullish ReversalBTCUSD | 4H
📈 BUY: 77,850–78,050
🛑 SL: 76,900
🎯 TP1: 79,627
🎯 TP2: 80,200
Bitcoin is showing signs of a bullish reaction from the 76,900 support zone after the recent sharp selloff. Price has started consolidating and is now pushing back above the short-term structure.
The 77,850–78,050 area is the key entry zone. Holding above this region could give buyers momentum toward 79,627, followed by the 80,200 resistance area.
📌 Key confirmation: Sustained 4H price action above 78,000 strengthens the bullish setup.
⚠️ Invalidation: A decisive break below 76,900 would invalidate the long idea and expose further downside.
BTCUSD BIAS: BUY 🟢
Patience for confirmation — don't chase the candle. Long 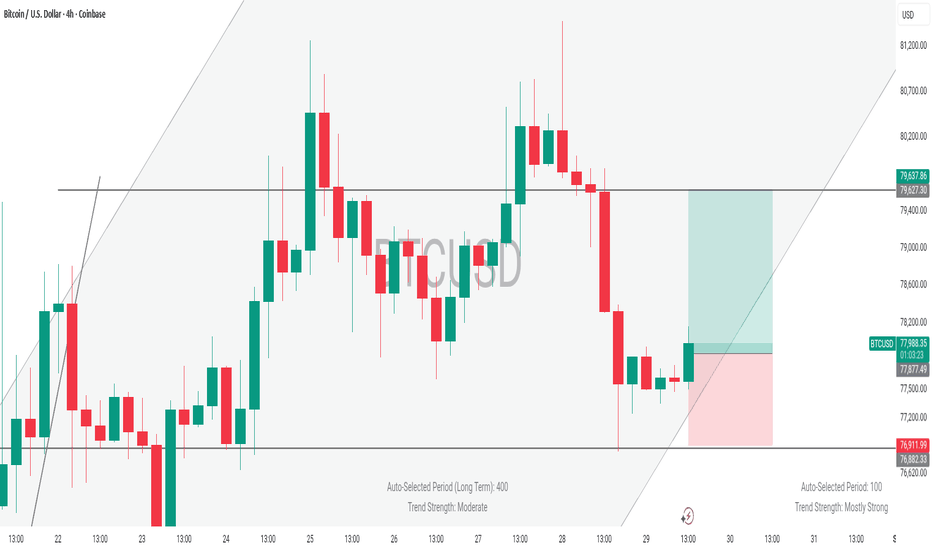
BTCUSD: Inverse H-S-Formation to Determine Next Steps!Hello Community,
welcome to my new analysis of BTCUSD from a weekly time frame perspective. BTCUSD is forming some important developments after the huge bullish momentum, and volatility pushed into the higher spheres of the local price data. In this case, I have spotted pivotal developments which will determine the upcoming outcomes of BTCUSD and what the underlying formation is.
When looking at my chart, we can see how BTCUSD recently moved right into this 50-MA marked in blue and tested it with strong bullish momentum. The most important part of it is that BTCUSD already formed the first parts of an inverse head-shoulder formation. The left shoulder and the head have already been completed.
Next time, when BTCUSD pulls back from the 50-MA, as seen in my chart, this is likely to lead to the right shoulder forming from there on. BTCUSD has strong support within the ascending trendline, also matching the 200-MA. It is likely that BTCUSD will find support in these areas.
Once a bounce in these areas occurs and BTCUSD manages to break out above the neckline of the inverse head-shoulder formation, there is a strong potential for the targets seen in my chart to be activated. Such a price move will also be supported by a golden MA-cross with the 200-MA crossing the 50-MA to the upside.
In this manner, thank you a lot for watching!
The support is highly appreciated.
VP  Long
Long
BNB/USDT | H1 | FEAR INDEX SUPPORTS SIDEWAYS RANGE🎯 TP1: $692.02 (+0.23%) │ TP2: $694.10 (+0.54%)
🛑 SL: $685.41 (-0.72%) │ R/R: 1 : 0.74
⚠️ Stop is wider than TP2 target (R/R < 1) — the close target is taken more often, but calculate your position size based on the stop size
FUNDAMENTAL BACKGROUND
This week, BNB received a project catalyst in the form of the activation of the Pasteur hard fork on BSC, but part of the effect has already been priced in by the market. The overall backdrop for altcoins remains neutral: BTC and ETH have stabilized after the bounce, and the fear and greed index is in the greed zone (57–78 pts), which is typical for a sideways market with an increased risk of profit-taking. On the macro front, Fed Governor Warsh's speech on August 28 had a hawkish tone but without specific figures, and was received cautiously by the market, without significant pressure on cryptocurrencies. No major macro releases for the asset are expected in the coming days, leaving the price in a technical consolidation zone.
TECHNICAL PICTURE
On the hourly chart of BNB/USDT, the price is concentrated in a narrow range around the middle Bollinger Bands (middle at $690.45) and VWAP ($690.16), confirming a sideways phase. The lower Bollinger Band ($688.07) acts as the nearest technical support, and the upper band ($692.83) as local resistance. The CCI 20 indicator is at -3.3, i.e., near neutral zero, giving no signal for either buying or selling. With low volatility (ATR 2.6), sharp movements are not expected, and the price remains in a consolidation zone without momentum for a breakout.
PROBABILITY MODEL
The model assesses the current regime as sideways (probability 51%) with low volatility. The chances of a bullish scenario (27%) and a bearish reversal (22%) differ slightly, indicating the absence of a dominant impulse. Model confidence is reduced (31%) due to uncertainty on low volumes and the price's proximity to the technical equilibrium zone.
DIRECTION
🟢 BUY
The price is holding above VWAP and the lower Bollinger Band, which, in the absence of bearish momentum, gives a technical advantage for a bounce to the middle of the channel.  Long
Long