 Long
Long
Short 
 Long
Long
Long 
BTC/USD — 4H Technical AnalysisCurrent Price: 77,680
The chart shows BTC trading inside a large ascending channel, with price currently performing a retest of the upper breakout area around 79K–80K. The structure remains bullish on the larger 4H setup, but the immediate risk is a rejection from this resistance zone.
🔴 Resistance / Supply Zones
R1 — 79,150
First major resistance.
A 4H close above this level would improve bullish momentum.
R2 — 79,850–80,000
Strong psychological + technical resistance.
This is the key breakout-retest zone shown on your chart.
Rejection here can initiate the corrective leg.
R3 — 82,900
Major upside target/resistance.
A confirmed break above 80K would make this the primary bullish target.
R4 — 88,000–90,000
Upper-channel resistance / extended bullish target.
R5 — 95,000–96,000
Long-term channel top shown on the chart.
🟢 Potential Bounce / Demand Zones
Zone 1 — 72,000–73,000
First potential reaction area.
If BTC pulls back from 79–80K, this is the first level where buyers could attempt to defend the trend.
Zone 2 — 68,000–69,500
Major demand zone
This corresponds closely with the rectangle you've drawn and represents the most important retracement area in the current structure.
A decline from 77,681 to 69,000 would be approximately −11.2%.
Zone 3 — 65,500–66,500
Secondary demand/support.
A sustained break below 68K would expose this area.
Zone 4 — 59,500–61,000
Major structural support
This corresponds to the previous A/C lows and would be the critical level for preserving the broader bullish structure.
📉 Bearish Scenario — Corrective Wave
The most logical path from your chart is:
79,150–80,000 rejection
⬇️
72,000–73,000
⬇️
68,000–69,500
⬇️
Potential strong rebound
The 68K–69.5K area is particularly important because it can act as the completion zone of the corrective move before another bullish attempt.
Fibonacci-style decline levels from current price
77,680 → 73,000: −6.0%
77,680 → 72,000: −7.3%
77,680 → 69,000: −11.2%
77,680 → 66,000: −15.0%
77,680 → 60,000: −22.8%
🚀 Bullish Scenario
If BTC manages to obtain a 4H close above 79,850–80,000 and successfully retests the level as support:
Targets:
TP1: 82,900
TP2: 88,000–90,000
TP3: 95,000–96,000
The move above 80K would invalidate the immediate bearish-retracement idea and strongly favor continuation toward the upper channel.
⚠️ Key Invalidation Levels
Bullish confirmation:
4H close above 80,000 + successful retest.
Bearish confirmation:
Failure at 79–80K followed by a break below 72K.
Major bearish invalidation of the current larger structure:
Sustained break below 59,500–60,000.
📊 TradingView-style conclusion
BTC/USD 4H remains structurally bullish inside the ascending channel, but price is currently facing a critical 79,150–80,000 resistance/retest zone. A rejection from this area could trigger a corrective move toward 72K first, followed by the major 68K–69.5K demand zone. If buyers defend this zone, BTC could resume the bullish structure toward 80K → 82.9K → 88–90K, with 95–96K representing the upper-channel extension.
Bullish trigger: 4H close above 80K.
Bearish trigger: loss of 72K.
Major demand: 68–69.5K.
Major structural support: 59.5–61K.
My preferred interpretation of your drawn scenario: the teal projection is technically reasonable — rejection → 69K area → strong bounce → retest 79–80K → breakout attempt toward 83–85K, provided the 68K–69K zone holds. Long 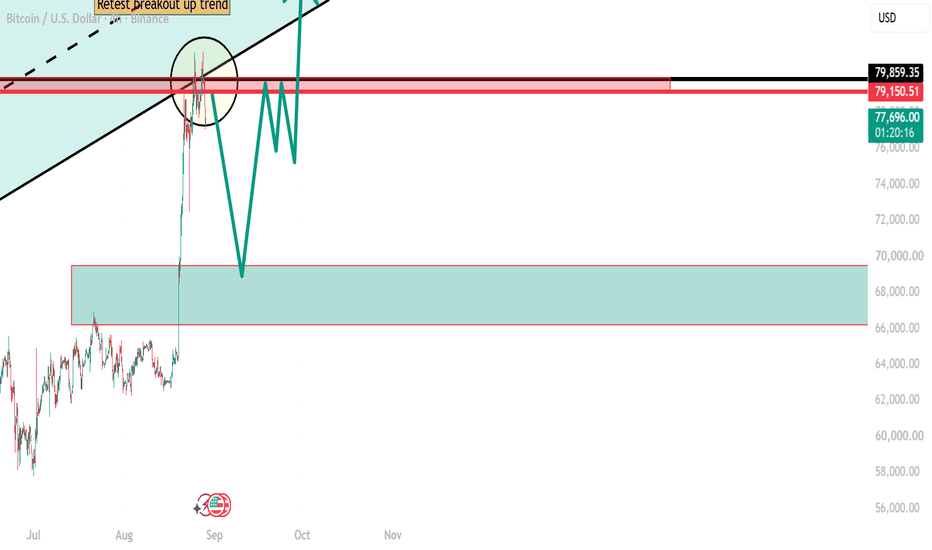
ETHUSDT: Method B Entry at the 0.295 Sweet SpotAdded to ETH at 2,421 based on two CAP signals stacking on the same level.
The correction off the recent high traced a clean ABC. Wave A bottomed, wave B retraced back up into the prior structure, and wave C pushed down into a zone defined by the 0.295 inverse fib retracement, which lined up almost exactly with the Value Area Low and the A equals C measured move target. Three independent methods of measuring the same pullback converging on one price is the kind of confluence CAP treats as a Method B execution, entering into the zone itself rather than waiting for confirmation through it.
Underneath that, a Method A entry also triggered separately. The final leg down into wave C printed a range sweep & breaker CHoCH combo, a break of structure through the prior swing low followed immediately by a change of character back through it, which confirmed the C wave was complete on its own terms, independent of where the fib and VAL happened to sit.
Two separate entry methods inside the Continuation Acceleration Protocol both pointed to the same zone at the same time, which is why this got sized as an add rather than a starter position.
If continuation follows through, the read is that this ABC was corrective within a larger impulsive structure that began at 1,820. Target is a close at the projected 5th wave of that move. This isn't confirmed, the correction only just completed and the market still has to prove the next leg is impulsive and not another corrective structure in disguise. Invalidation would be a break back below the wave C low with structure shifting bearish on the follow through.  Long
Long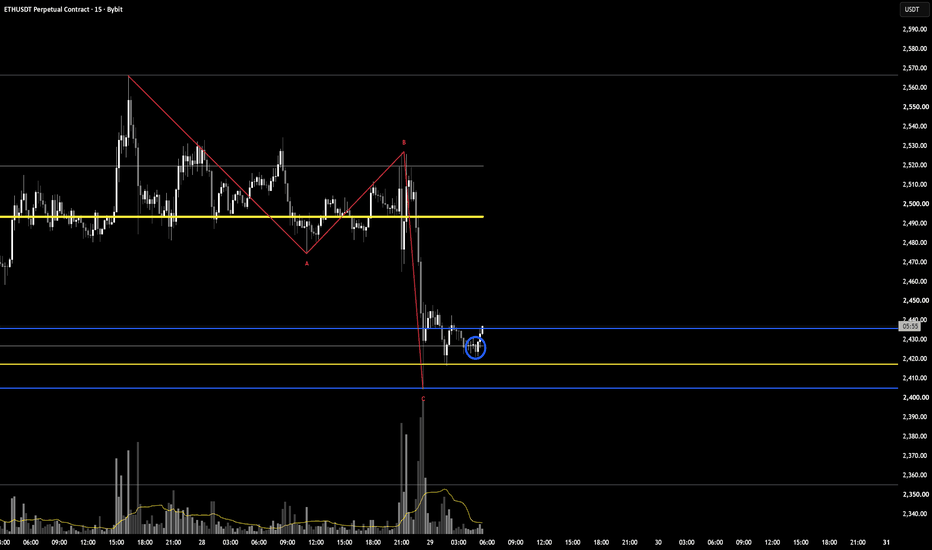
 Short
Short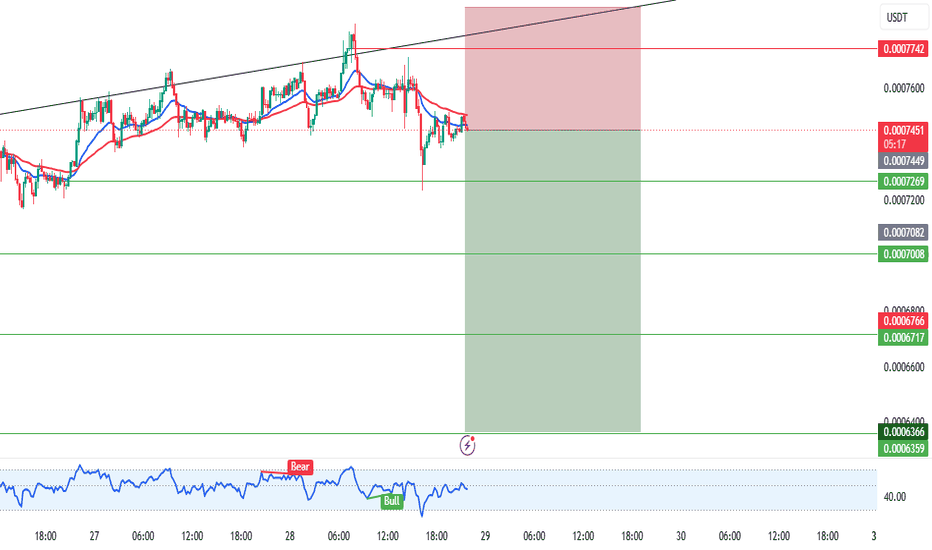
Short 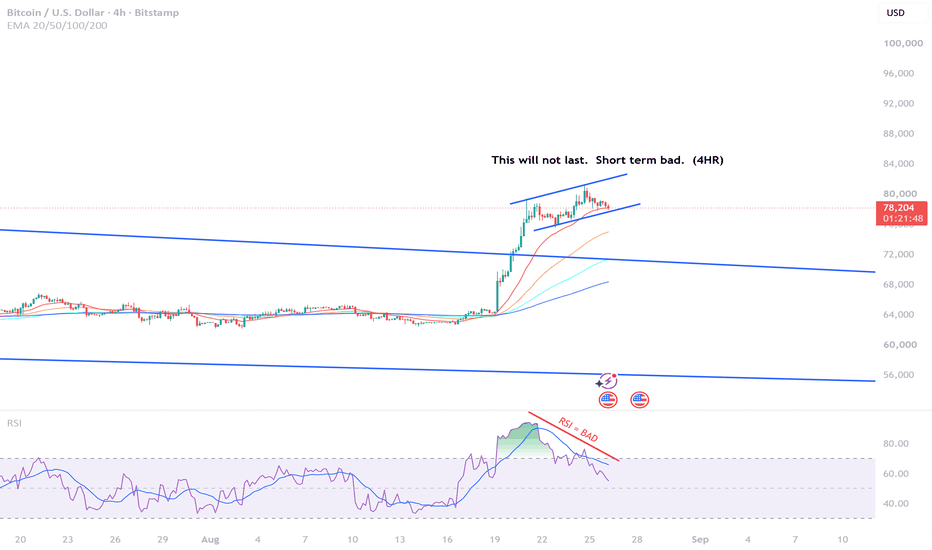
Long
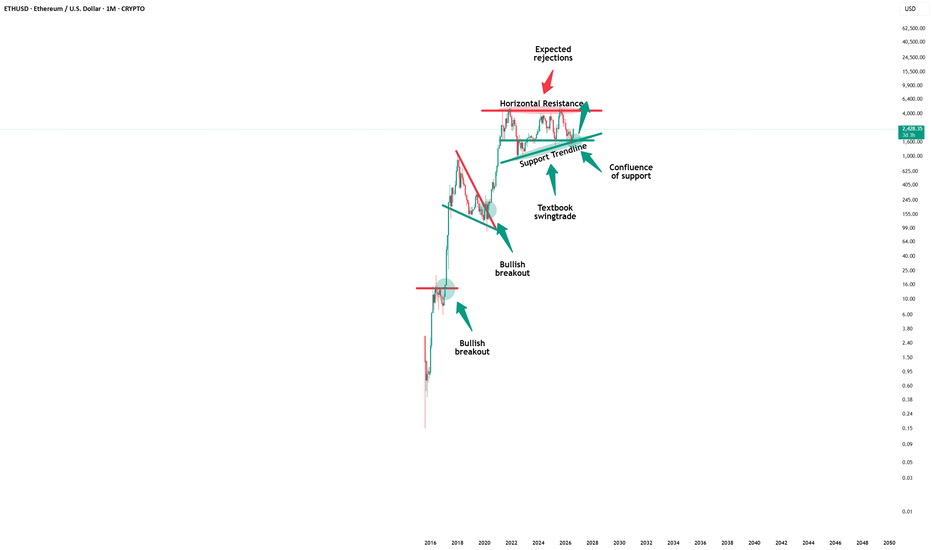
Bitcoin Gave A Clean False Breakout Lesson Today + Trading PlanNot every missed trade is a failure. Some are pure education.
15-Minute Lesson: False Breakout
On the 15-minute chart, Bitcoin pushed above the local resistance near 80,800 – 81,000, trapped breakout buyers, and immediately reversed. That was a textbook false breakout.
How to trade this structure:
Mark a clean resistance zone that has already rejected price.
Wait for price to break above it and fail to hold.
Enter only after a clear reclaim back below the zone.
Place invalidation above the fake breakout wick.
Target the next liquidity pools below.
Today that sequence offered a clean short from the failed breakout toward the downside. We did not catch this exact move, but the structure is worth studying carefully. False breakouts punish FOMO and reward patience.
Higher-Timeframe Context
Over recent weeks, Bitcoin delivered a strong mid-term expansion. After a move like that, a corrective phase is normal. This is exactly why we reduced risk: when Bitcoin cools down, altcoins usually correct harder.
Key Levels
Local decision zone: 75,600 – 75,000
Major support: 74,000
Major resistance: 82,000 – 82,800
Upside expansion target: 90,000
Downside expansion target: 68,900
Current Plan
Our bias is simple:
First, we want to see how price behaves around 75,000.
If 74,000 breaks with acceptance, the path toward 68,900 opens quickly.
If Bitcoin reclaims and breaks 82,000 – 82,800 with strength, the market can accelerate toward 90,000.
Execution Philosophy
Lower timeframes give the entry trigger.
Higher timeframes give the direction and invalidation.
We do not force Bitcoin trades in the middle of nowhere. We wait for the market to reach a decision zone, show its hand, and only then execute.
This is our Bitcoin framework for now. In selected altcoins, cleaner asymmetric setups may appear earlier.
Patience before execution.
Risk Warning:
Trading cryptocurrencies involves significant financial risk. This analysis represents a personal market view and structural perspective, not financial advice. Always define your risk before entering any trade and never risk capital you cannot afford to lose. Long
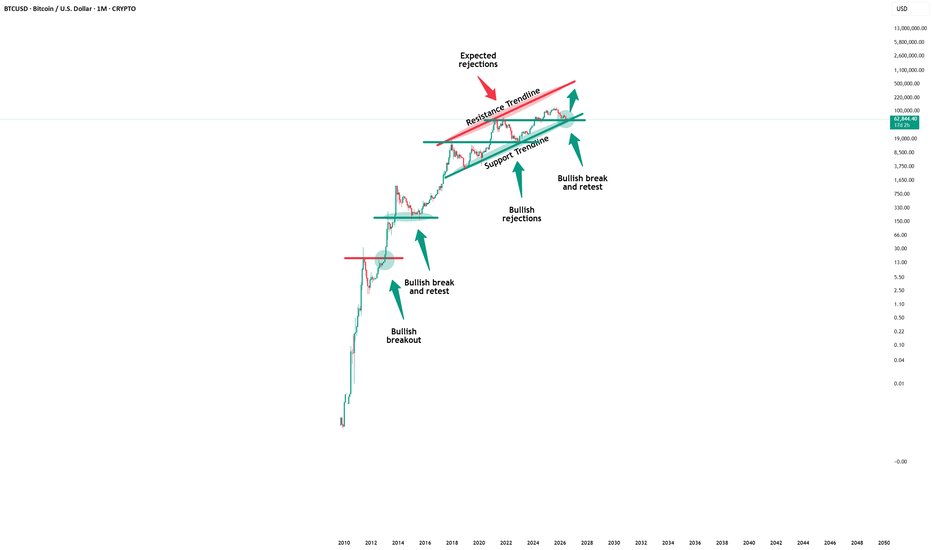
 Long
Long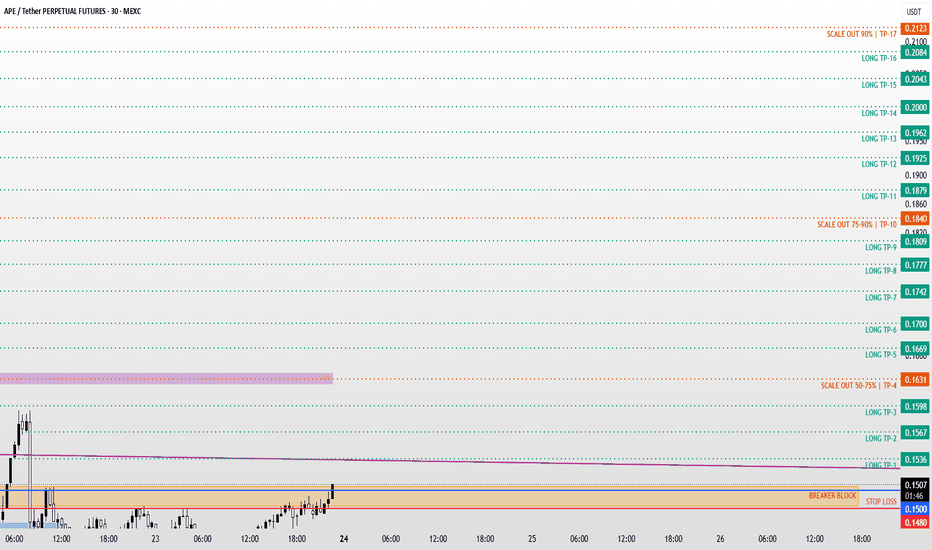
Long 
ETHUSD — The Path to $180,000: Macro Cycle Extension PlayZooming out on ETH’s monthly chart reveals a well-respected ascending channel dating back to 2016. Price has repeatedly reacted off both the lower and upper boundaries of this structure — and right now we’re coiling in a multi-month range between $1,900–$3,800, similar to prior pre-expansion phases (2020, 2016).
📊 Key Levels
🔴 Support: $1,922 → $1,512 (invalidation)
🟡 Range: $2,000 – $3,800
🟢 Breakout trigger: Monthly close > $3,800
🎯 TP1: $8,092
🎯 TP2: $85,000
🎯 TP3 (channel top): $181,369
📈 The Thesis
The log-scale channel that’s contained ETH since its inception projects the upper rail intersecting price around 2027–2028 in the $180K–$215K zone. If ETH follows the same rhythm as prior cycles — accumulation → breakout → parabolic expansion → channel top rejection — this is where the move could top out.
⚠️ Not financial advice. Long-term speculative thesis based on channel/fractal analysis — always manage risk and size accordingly.
#ETH #Ethereum #Crypto #ETHUSD #Altcoins #CryptoAnalysis Long 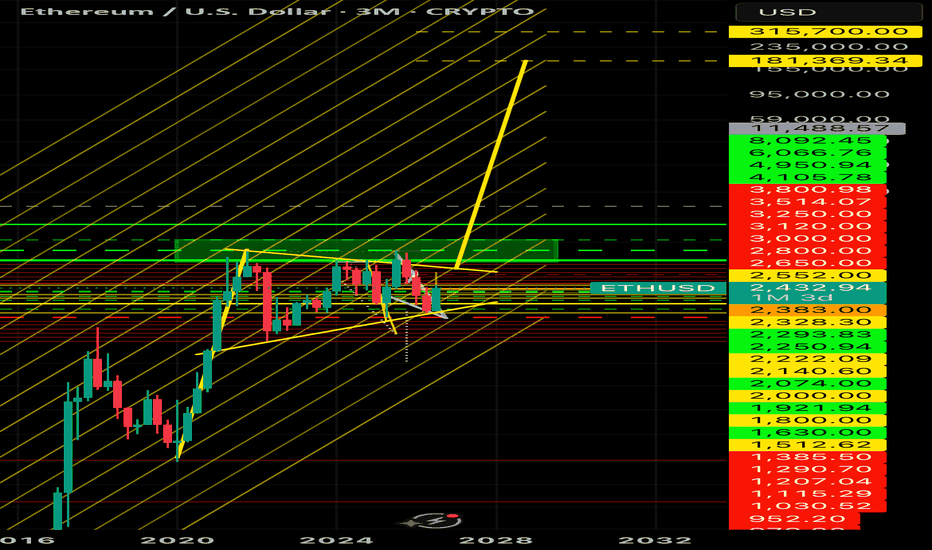
Short 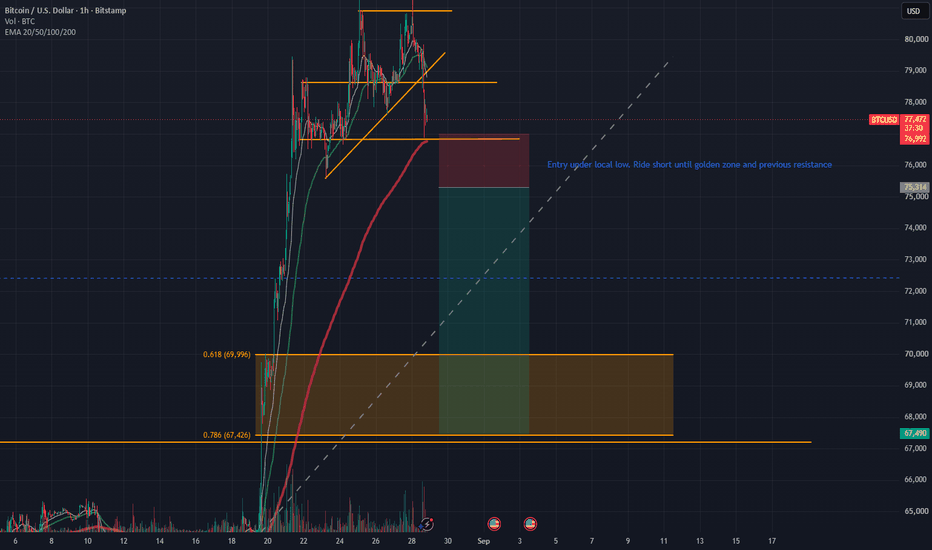
 Long
Long
 Long
Long
TRX Breaks a Two-Month Range — Acceptance or Deviation?TRX has finally pushed above the upper boundary of the broader 4H range around 0.3334, after spending roughly two months trading below it. The initial structure following the breakout is constructive: price moved above the range, pulled back toward the breakout area and has so far remained above it.
────────────────────────────
4H CONTEXT
────────────────────────────
The 4H chart is the main context here. The former range high around 0.3334 was tested repeatedly during June and July before the current expansion finally moved through it. Price is now trading above that level while the broader structure remains bullish.
For now, that looks more like an acceptance attempt above the old range than a simple wick through resistance.
────────────────────────────
1H STRUCTURE
────────────────────────────
The 1H chart adds useful detail underneath the breakout. Bullish OBs have formed around the move, the pullback held above the broader breakout area, and the structure has continued with additional bullish BOS.
That gives the current move some internal structure rather than just one isolated push above the range.
────────────────────────────
RETEST OR DEVIATION?
────────────────────────────
The key distinction now is whether the former range high can remain accepted structure.
If TRX continues holding above roughly 0.3334 while the 1H structure remains constructive, the breakout-and-retest interpretation stays intact.
If price loses that area and begins closing back inside the old range, the move above the highs starts looking more like a deviation than a successful breakout.
────────────────────────────
CURRENT READ
────────────────────────────
At the moment, the evidence leans toward bullish breakout acceptance, with 4H and 1H structure aligned in the same direction. The 15m also remains constructive, but I would treat that as lower-timeframe detail rather than the main reason for the view.
The level that matters most is still the old 4H range boundary. The next few higher-timeframe closes should make the distinction between acceptance and deviation much clearer.
Would you classify this as a clean breakout/retest already, or are you still waiting for more acceptance above the former range high?
Structure observations, not signals.  Long
Long
 Long
Long
 Short
Short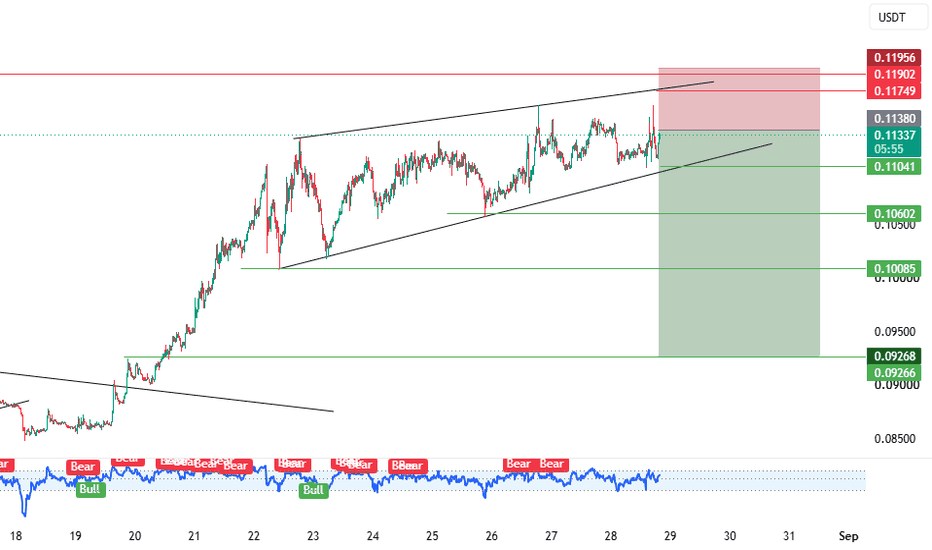
APEUSDT SHORTInstructions:
Entry point: yellow
Stop loss: red
Take profit: green
👉Leverage x 5-10-20 for crypto
👉Leverage x 20-50-100 for commodities, stocks, indices, and forex
👉Margin 1-5% max.
Always practice risk and money management.
Invest a maximum of 5% on any trade or across all your trades.
Invest only what you can afford to lose, as no one is in control of the market.
👉Our analyses are primarily based on:
breakouts: two trend lines (ascending and descending) and a line indicating a horizontal breakout.
chart patterns: shoulders and head, triangle parttern, elliott impulse, etc etc.
We don't always have the time to track them at all times or to represent them visibly, given the numerous signals, the number of channels to manage, and especially because of the often rapid pace of market movements.
indicators: We associate at least two indicators with this technique.
👉Depending on the circumstances, we use specific indicators, often setting 3 or more take profit levels.
👉Indeed, there are good days in trading and also bad days. No one can promise to win every trade, and like all traders worldwide, we also experience stop-loss orders. However, we win more than we lose and remain positive.
👉You can close the position before or after the take profit orders indicated by the green lines if you are personally satisfied; the same applies to stop loss orders.
👉We must stay positive, clear-headed, and humble.
we cannot provide all instructions or all trades here on this channel.
Good luck to us all, and may God guide us. Amen. Short 


