HEMI/USDT | H1 | TESTING THE UPPER BOUNDARY AFTER A NEWS IMPULSE🎯 TP1: $0.016338 (+10.59%) │ TP2: $0.017366 (+17.54%)
🛑 SL: $0.012418 (-15.95%) │ R/R: 1 : 1.1
⚠️ SL is placed beyond the nearest candle wicks to reduce the risk of accidental stop-out
FUNDAMENTAL BACKGROUND
HEMI received a fresh project catalyst — the announcement of a $15 million round closure for the development of Bitcoin programmability. This creates a news impulse that supports interest in the token, although no immediate on-chain effect followed the announcement. The overall crypto market backdrop remains supportive: BTC and ETH are showing strength, and the Fear and Greed Index is in the "greed" zone (65–67), which encourages selective capital rotation into alts. With no significant macro releases in the coming days (the next one is the Manufacturing PMI on 01.09.2026), HEMI is moving primarily on technicals and the news driver.
TECHNICAL PICTURE
The price has consolidated above the Ichimoku cloud, and the Tenkan line is above the Kijun — a classic bullish signal. The ADX at 29.2 indicates a strong trend with buyer advantage. The CMF indicator at 0.324 confirms a confident capital inflow, strengthening the bullish scenario. The CCI at a neutral 13.2 does not yet signal overbought conditions, leaving room for continued growth. The nearest resistance is at the upper boundary of the last 100 candles ($0.016859), with support around the Kijun ($0.01).
PROBABILITY MODEL
The current regime is bullish with a 49% probability of continuation versus 45% for a bearish reversal. Such a small gap between scenarios is explained by the price's proximity to the upper boundary of the range: a breakout above $0.016859 would open the path to new highs, but a rejection from resistance could trigger sharp profit-taking. The model leans with 75% confidence toward a continuation of the upward movement, supported by the strong ADX trend and capital inflow according to CMF.
DIRECTION
🟢 BUY — the price has consolidated above the Ichimoku cloud with a strong ADX trend and capital inflow according to CMF.  Long
Long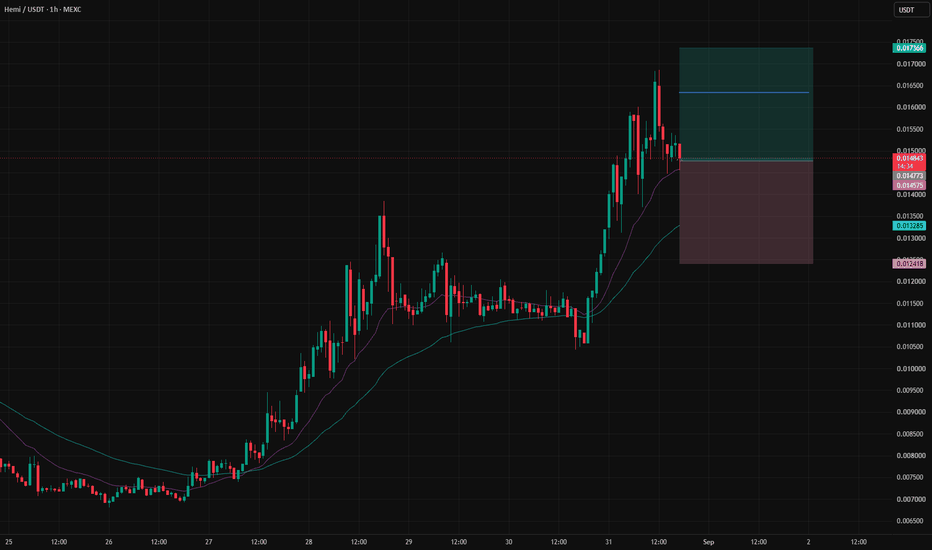
Is PUMP starting its biggest run?The pump.fun token, which looked dead for a long time, suddenly pumped more than 300% on the back of team buybacks and ecosystem growth.
But after such a strong move, there is usually potential for a big correction.
Is that also the case with NYSE:PUMP ?
1️⃣ Right now, price has dropped into the gap zone at $0.00464–$0.00389. Just below this level, diagonal support begins.
This lines up perfectly with a simple thesis: price closes the FVG, tests support, and bounces back. But there are risks.
2️⃣ Right now, at the end of the second FVG, the first major cluster of buyer liquidity has formed, which could become the next target.
3️⃣ In general, there is more buyer liquidity in NYSE:PUMP than seller liquidity. And as we know, price usually moves toward where there is more liquidity.
4️⃣ At the same time, directly above us, at $0.00509, there is a strong order block, a tight zone with almost $600B in short liquidity.
So right now, there are two working theses:
📈 Price squeezes the order block above, collects liquidity, and then moves lower toward $0.00376, where the first long positions can be accumulated.
📉 Or price goes straight to $0.00376, and if we get a bounce, short-term trades can be opened toward the order block at $0.00509.
 Long
Long
XRP Just Hit a Make-or-Break Level at $1.34Hi guys, so I spent way too long on the XRP chart today. Moving lines around, throwing RSI and MACD on top, checking SMAs, and yeah, most of that ended up not mattering. For me the whole thing comes down to one number: $1.40. XRP spiked to $1.69-$1.70 last week, got sold off hard, and now it's just sitting there around $1.36-$1.38 like it's thinking about its next move.
Underneath that, though, $1.34 on the 4H is the one I'm actually watching. Supertrend flipped support there; it's the 50% retrace of the whole August move, and there's a nasty liquidation cluster sitting right on it too. Buyers already saved it once this week already. If it holds, we're fine. If it goes, honestly, there's nothing until $1.20, so I'm not trying to catch a falling knife here.
Here's my plan, nothing fancy: long $1.35-$1.37 if we retest, but I want RSI back in the mid-40s and MACD turning up first, not just buying because a candle went green. Stop $1.33, first target at $1.40, and stretch to $1.50. If $1.40-$1.50 rejects again like last time, whatever, I'll just flip and look at shorts instead.
Also worth knowing, spot XRP ETFs just had their best inflow week all year, and that CLARITY Act vote mid-September is a real wildcard either way. That's probably why dips keep getting bought.
Anyway, I'm just sitting here staring at $1.34. Is anyone already in, or are you waiting to see if $1.40 actually breaks first this time?
Disclaimer: Trading crypto involves substantial risk, and this is only my personal read of XRP's structure, not financial advice. I always define invalidation before entering, size positions carefully, and accept that price can do something different from my base case.
Zcash $853 Resistance Level in FocusZcash (ZEC) price action is currently trading around a locally established resistance region near the $853 level. The market previously showed a strong bullish engulfing move into this area, followed by a period of consolidation as price attempts to establish its next direction.
From a technical perspective, the reaction around this resistance level may provide useful insight into the near-term market structure. If ZEC faces sustained rejection from the $853 region, the possibility of a corrective move towards lower technical levels may increase. In this scenario, the 0.618 Fibonacci retracement and a lower support area around $486 could become relevant areas to monitor.
Alternatively, continued consolidation around the current resistance level followed by a sustained move above it could support the possibility of further bullish continuation towards higher price regions. Such a development would depend on price maintaining momentum and establishing acceptance above the current resistance.
Overall, the $853 region represents an important technical area for ZEC in the immediate short term. Price behaviour around this level may help determine whether the existing bullish trend continues or whether the market enters a broader corrective and consolidation phase. No particular outcome is guaranteed.
-----------------------------------------------------------------------------------------------
Don't invest unless you're prepared to lose all the money you invest. This is a high-risk investment and you should not expect to be protected if something goes wrong. Take 2 mins to learn more: coinjar.com/uk/risk-summary
The article is an opinion expressed by the author at a point in time and does not represent the views of CoinJar UK Limited or CoinJar Australia Pty Ltd. Take care to consider the date of this article and be aware that this opinion is based on circumstances at the time of publishing. No responsibility or liability is accepted for any errors of fact or omission expressed therein. Past performance is not a reliable indicator of future results.
This above article is not to be read as investment, legal or tax advice and it takes no account of particular personal or market circumstances; all readers should seek independent investment advice before investing in cryptocurrencies.
We recommend you obtain financial advice before making a decision to use your credit card to purchase cryptoassets or to invest in cryptoassets.In the UK, it's legal to buy, hold, and trade crypto, however cryptocurrency is not regulated in the UK. It's vital to understand that once your money is in the crypto ecosystem, there are no rules to protect it, unlike with regular investments.
You should not expect to be protected if something goes wrong. So, if you make any crypto-related investments, you're unlikely to have recourse to the Financial Services Compensation Scheme (FSCS) or the Financial Ombudsman Service (FOS) if something goes wrong.
----------------------------------------------------------------------------------------------  Long
Long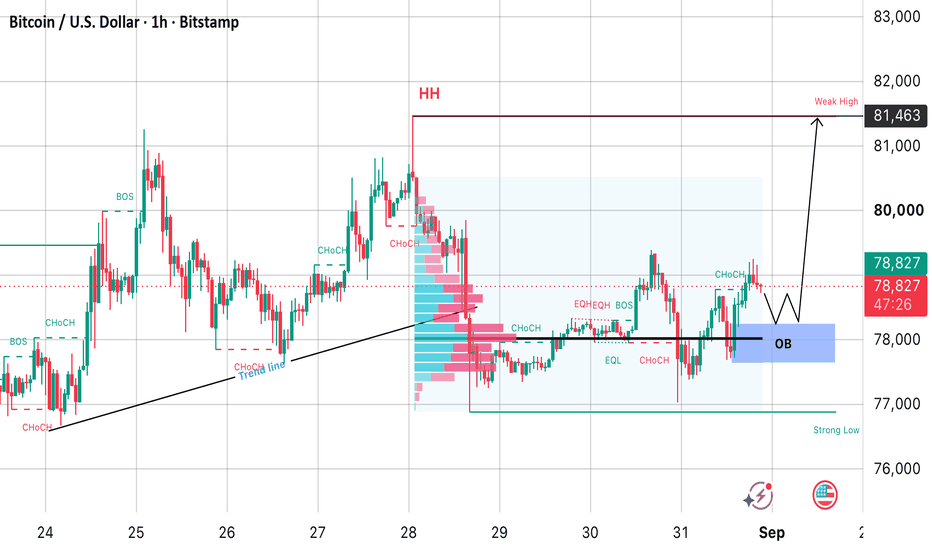
Short 
Uniswap (UNI) Bullish Forecast: Weekly Breakout Confirmed Quick overview
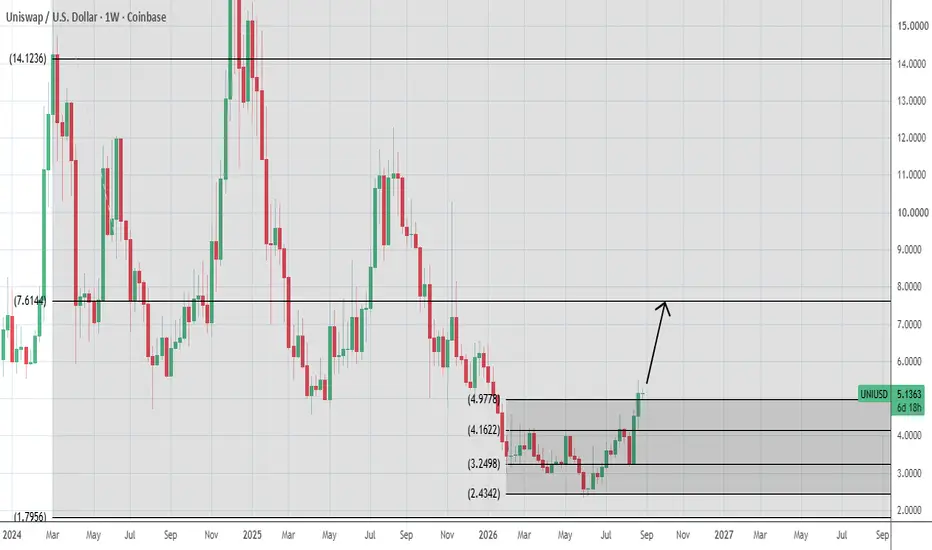
Uniswap has successfully broken above the $4.90 top boundary of its medium-term system, with the move now confirmed on the Weekly timeframe.
That Weekly confirmation materially changes the technical structure and strengthens the case for continued upside expansion.
UNI is currently trading around $5.10, meaning price action is already beginning to establish itself above the former resistance barrier.
Our official bullish profit target is now $7.56, representing the mid-low key level of the long-term (Grand) system.
The former $4.90 ceiling now becomes the pivotal structural level supporting the current bullish campaign.
Recent Uniswap v4 and ecosystem developments provide a constructive fundamental backdrop to the technical breakout.
Uniswap (UNI) has delivered the technical confirmation bulls have been waiting for.
After spending much of 2026 trapped inside its medium-term structure, price action has now successfully conquered the $4.90 top boundary, with the breakout subsequently confirmed on the Weekly timeframe.
That confirmation is significant.
Until now, the recovery from the lows could still reasonably have been interpreted as another bullish rotation inside the existing medium-term structure. UNI had repeatedly moved through the internal levels of that system without proving that buyers possessed enough strength to escape its upper boundary altogether.
That has now changed.
With a Weekly confirmation above approximately $4.90, Uniswap has effectively completed its breakout from the medium-term structure. The technical conversation therefore shifts from whether UNI can escape the range to where the newly established bullish cycle can take price next.
Our analysis points toward $7.56 as the next meaningful destination.
Current Technical Setup: $4.90 Breakout Changes the Structure
The technical chart illustrates the transition particularly well.
After spending several months consolidating inside the medium-term system, UNI constructed a recovery from the lower part of the range and gradually worked its way through the internal key levels.
The system itself contained several important structural boundaries, but the decisive obstacle was always the upper level around $4.90.
Price action has now crossed that boundary and, crucially, secured Weekly confirmation above it.
In our framework, penetration and establishment are not the same thing. A temporary move beyond an important level can easily be reversed before the relevant period closes. Weekly confirmation provides considerably stronger evidence that the market has accepted prices beyond the former boundary.
UNI is currently trading around $5.10, placing the market on the bullish side of that former ceiling.
The implication is straightforward: the medium-term structure has completed its immediate upside objective, while the next relevant authority comes from the larger long-term system.
And that brings $7.56 directly into focus.
Projected Move: Long-Term Mid-Low at $7.56 Becomes the Target
The next meaningful technical destination is situated considerably higher at approximately $7.56.
This level represents the mid-low key level of Uniswap's long-term — or Grand — system, making it considerably more important than another minor resistance encountered along the way.
It now becomes the official bullish profit target for the present forecast.
From current prices around $5.10, an advance toward $7.56 would represent roughly another 48% of upside potential. That is a substantial move, but the distance itself does not weaken the technical argument. What matters is that the medium-term ceiling restricting UNI has now been removed.
The transition can essentially be understood as a change in structural jurisdiction:
The medium-term system has released price action, and the next major reference now belongs to the long-term system.
This does not mean UNI has to travel toward $7.56 in a straight line.
Corrections, retests of former resistance, sideways consolidation and temporary volatility would all be perfectly compatible with the broader bullish scenario. After a significant Weekly breakout, a market will often revisit or operate near the former boundary before producing its next expansion.
What matters is whether the newly established structure remains intact.
As things stand, the breakout is confirmed and $7.56 is now technically exposed.
Why the Weekly Confirmation Matters
There is another reason we attach particular importance to this development.
The Monthly chart shows just how compressed Uniswap has become relative to the much larger price structures that governed the asset during previous cycles.
UNI has spent most of 2026 operating near the lower part of its broader historical range. The medium-term consolidation therefore developed against a backdrop in which considerable territory remains available above current prices.
Breaking the top of that smaller structure does not automatically guarantee a return to previous cycle highs. Nor is there any reason to project that far ahead.
The relevant question is much narrower:
Has UNI generated enough technical evidence to transition from its medium-term structure toward the next long-term key level?
Following the Weekly establishment above $4.90, our answer is now yes.
That is why we are deliberately focusing on $7.56 and nothing beyond it at this stage. Once price reaches that long-term mid-low, a new assessment will be required to determine whether the move has further room to develop or whether the level produces meaningful resistance.
For the current forecast, $7.56 is the destination.
Uniswap Technology & Ecosystem Update
The bullish technical development also arrives during an active period for the Uniswap ecosystem.
One of the most interesting recent developments has been the introduction of Permissioned Pools for Uniswap v4. Using v4's hook architecture, these pools can enforce issuer-specific eligibility requirements while retaining Uniswap's underlying automated-market-maker infrastructure. The design is particularly relevant to tokenized funds and securities, where issuers may need to restrict participation to approved wallets. Uniswap Labs published a detailed explanation of the system on August 24.
That development expands the potential application of Uniswap v4 beyond conventional permissionless token trading and toward the growing market for tokenized real-world financial assets.
The ecosystem has also continued expanding its reach. Uniswap v2, v3, v4 and UniswapX went live on Robinhood Chain in July, with Uniswap operating as its primary public AMM, while August brought the launch of Pools.trade, a token-launch platform built around Robinhood Chain.
Meanwhile, Uniswap's v4 hook architecture continues to make liquidity pools substantially more programmable, allowing developers to attach customized functionality at different stages of pool execution rather than requiring changes to the core protocol itself.
These ecosystem developments do not create the bullish forecast — the chart does that — but they provide a constructive technological backdrop while UNI itself begins showing renewed technical strength.
Conclusion: UNI Breakout Opens the Road Toward $7.56
Uniswap has crossed a meaningful technical threshold.
The Weekly confirmation above the $4.90 top boundary of the medium-term system signals that price action has successfully escaped the structure that governed UNI throughout much of 2026.
That breakout shifts our attention toward the next meaningful reference on the larger timeframe: the $7.56 mid-low of the long-term Grand system.
Key levels to watch
Confirmed breakout level: $4.90
Current market area: approximately $5.10
Official bullish profit target: $7.56
Structural condition: continued establishment above the former $4.90 medium-term ceiling
The bottom line is straightforward: Uniswap has conquered its medium-term top with Weekly confirmation, and the technical road toward $7.56 is now open.
The next battle is no longer inside the medium-term structure.
It sits at the long-term system's $7.56 key-resistance.  Long
Long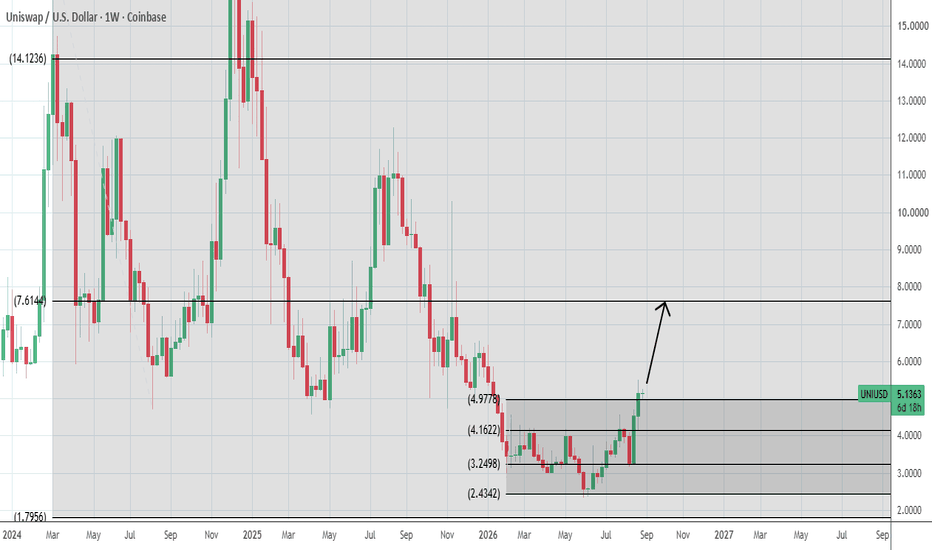
 Long
Long
 Long
Long
Long 
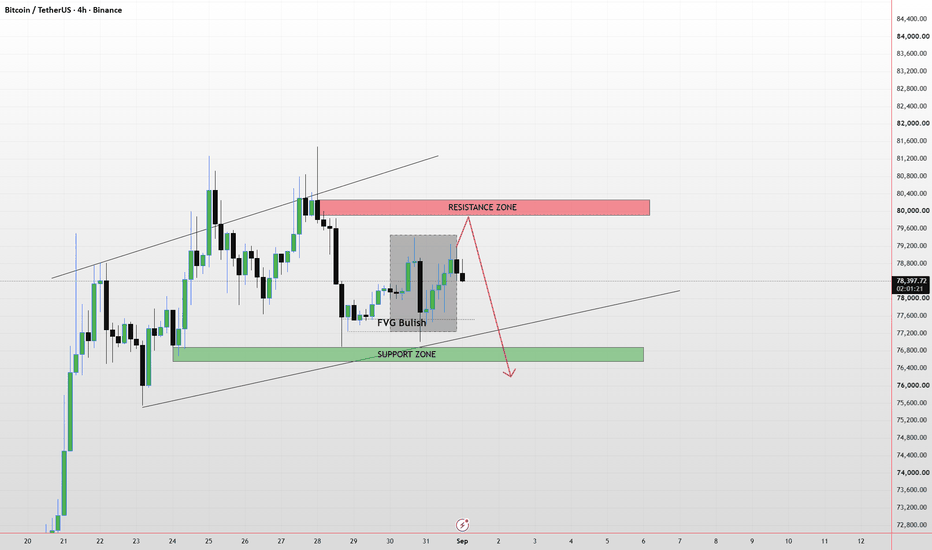
BITCOIN - BULLISH PENNANT, Ready for the Next Leg Higher?📊 Technical Analysis — BTC/USDT
Time Frame: ⏱️ 4H
Pattern: 🟢 Bullish Pennant
Current Price: ± $78,408
Key Resistance: 🔴 $79,450 – $80,500
Key Support: 🟢 $77,000 – $76,000
🔎 Pattern Structure
Bitcoin previously experienced a strong impulsive bullish move, rallying from around $69K to $81.4K. Following this sharp upward movement, BTC entered a consolidation phase within an increasingly narrowing structure.
📐 The chart shows two converging trendlines:
🔻 Descending Resistance → sellers continue to pressure price from above.
🔺 Ascending Support → buyers continue defending higher lows.
⚡ Narrowing Price Range → indicating increasing compression and the potential for a significant breakout.
📊 This structure is characteristic of a Bullish Pennant, which typically develops after a strong impulsive move as the market pauses before potentially continuing in the same direction.
In other words, BTC is currently experiencing price compression before a potential major move.
---
🟢 BULLISH SCENARIO — Upside Breakout 🚀
The bullish scenario becomes increasingly favorable if BTC breaks above the descending resistance trendline and confirms the breakout with a 4H candle close.
🎯 Key Breakout Zone:
$79,450 – $80,500
If BTC breaks above this zone with strong volume:
🚀 Target 1: $81,400
🚀 Target 2: $82,000 – $83,000
🚀 Extended Target: Around $90,000
💡 The $80,500 level is particularly important because a confirmed breakout above this resistance would strengthen the case that the consolidation phase has ended and a new bullish continuation leg is underway.
📈 A successful retest of the broken resistance as support would provide additional confirmation before the next potential move higher.
---
🔴 BEARISH SCENARIO — Pattern Failure ⚠️
Although the structure favors a Bullish Pennant, the pattern is not guaranteed to break upward.
If BTC fails to maintain the ascending support trendline and breaks down from the pennant:
🔻 $77,000 → Initial support
🔻 $76,000 → Critical support
🔻 $74,800 → Potential deeper correction zone
If the breakdown occurs with a strong 4H candle close and increasing volume, the Bullish Pennant would be considered invalidated.
⚠️ A decisive loss of the $76K area would significantly weaken the short-term bullish structure and increase the probability of a deeper correction.
---
🎯 KEY LEVELS TO WATCH
🟢 $80,500+ → Strong bullish breakout confirmation
🟡 $79,450 → First major resistance
⚪ $78,400 → Current consolidation area
🟢 $77,000 → Short-term support
🔻 $76,000 → Critical pennant support
🔻 $74,800 → Deeper downside support
---
🧠 BULLISH PENNANT OUTLOOK
🔥 A Bullish Pennant generally forms following a strong impulsive upward movement and represents a period of consolidation and market compression.
On this chart, BTC has established a clear bullish flagpole, followed by a tightening consolidation structure with higher lows and lower highs.
📌 Therefore, the upper trendline breakout is the key event to watch.
As long as BTC maintains its higher-low structure and eventually breaks above the $79.45K–$80.5K resistance zone, the probability of a bullish continuation increases.
⚠️ However, traders should wait for confirmation through a candle close and breakout volume rather than treating a simple resistance test as a confirmed breakout.
---
🚀 BOTTOM LINE
BTC is currently compressing inside a Bullish Pennant following a strong impulsive rally.
🟢 Break above $79.45K–$80.5K → Potential bullish continuation toward $82K–$83K, with an extended measured target around $90K.
🔴 Break below the lower trendline → Bullish structure weakens, with potential downside toward $77K–$76K or lower.
🔥 The eventual breakout direction from this compression could determine Bitcoin’s next major move.
#Bitcoin #BTC #BTCUSDT #Crypto #Cryptocurrency #BitcoinAnalysis #TechnicalAnalysis #BullishPennant #PennantPattern #CryptoTrading #BTCAnalysis #BitcoinPrice #BullishBreakout #PriceAction #CryptoMarket #BitcoinTrading #BTCUpdate Long 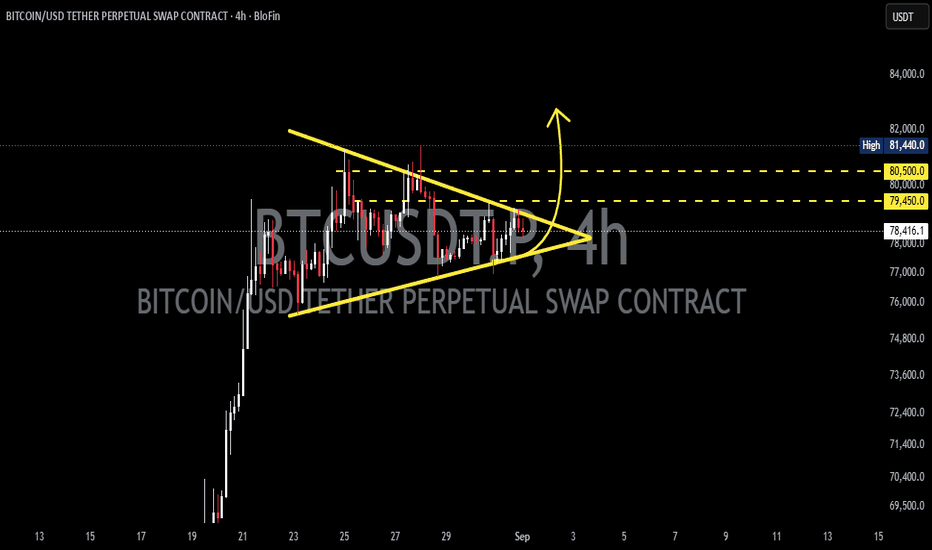
 Short
Short
 Short
Short
 Short
Short
 Long
Long
 Long
Long
ZCASH HTF PULLBACK INCOMING?Yello, Paradisers! are ZCASH bulls about to get trapped at the exact resistance area where another aggressive sell-off could begin?
💎ZEC is currently trading around $845 after once again failing to establish acceptance above the major $850-$865 resistance zone. This area has repeatedly attracted sellers, making the current price action extremely important for anyone trading ZCASH in the short term.
💎The broader structure remains mixed. On the daily timeframe, ZEC is still bullish, but the weekly chart suggests that a larger pullback could be developing. At the same time, both the 4H and 1H structures are showing bearish pressure. This means the higher-timeframe bullish trend can remain intact while ZEC still experiences a substantial correction first.
💎What makes the current setup particularly interesting is the rising wedge structure. Price recently pushed toward approximately $890, reaching the upper boundary of the formation before being aggressively rejected. That rejection also created the possibility of a double-top formation around the same highs.
💎We can additionally see weakening momentum and bearish divergence developing underneath the price action. In simple terms, ZEC managed to push higher while momentum failed to confirm that strength. When this happens directly underneath significant resistance, it increases the probability that buyers are becoming exhausted.
💎The $850-$865 area is therefore the critical battleground. As long as ZEC continues trading below this resistance and fails to reclaim it convincingly, the bearish scenario remains active.
💎A breakdown below the lower boundary of the rising structure would strengthen the bearish confirmation and could open the way toward the first major 4H support around $735-$740. If sellers maintain control beyond that point, the much stronger daily support between approximately $660 and $680 becomes the next major area to watch.
💎However, we are not interested in blindly predicting a crash. Every professional setup needs a clear invalidation point. A decisive candle close above approximately $910 would invalidate the bearish structure shown on the chart and force us to reassess the scenario.
💎Until then, chasing ZEC underneath major resistance carries an unfavorable risk-to-reward profile. The market is sitting at a location where patience matters far more than excitement.
As always, only a few traders who understand market cycles, timing, and proper risk management will be positioned to benefit from these moves consistently. Do not trade what you hope will happen; trade what the structure actually confirms. Strive for consistency, not quick profits, and treat the market as a businessman, not as a gambler.
MyCryptoParadise
iFeel the success🌴  Short
Short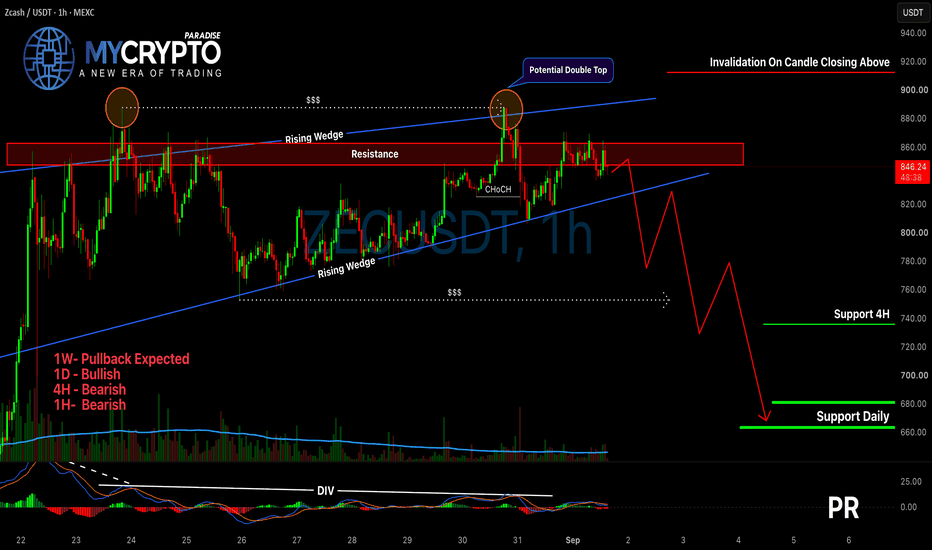
 Long
Long
 Long
Long
 Short
Short
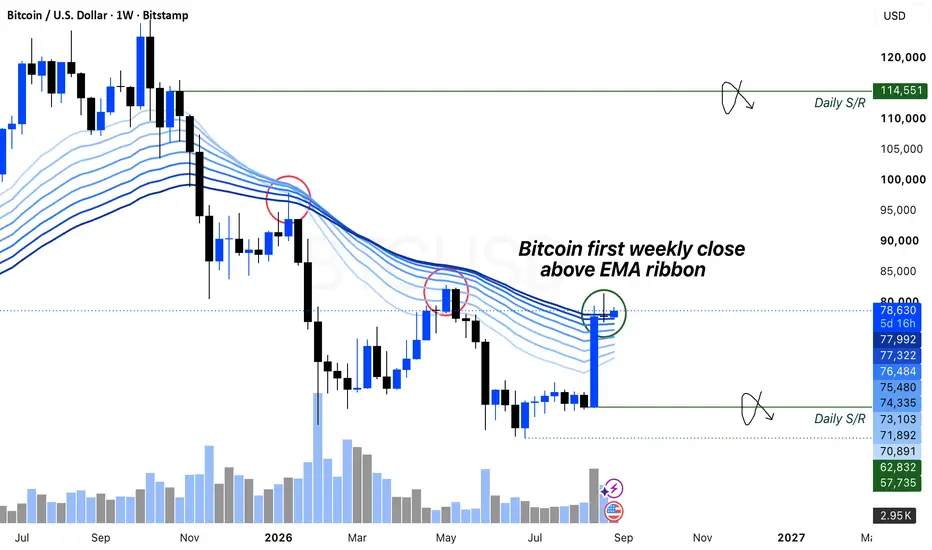
Bitcoin Weekly EMA Ribbon Reclaim ? Bitcoin (BTC/USDT) is showing notable technical developments on the weekly timeframe as price interacts with the EMA ribbon. Since the bear market was established, the EMA ribbon has generally acted as a region of resistance, with previous retests followed by renewed bearish price expansion.
The current structure appears different, with Bitcoin recently recording a weekly close above the EMA ribbon. From a technical perspective, this may indicate the possibility of a developing market structure shift. However, further price action will be needed to determine whether the move can be sustained.
If Bitcoin continues to hold above the EMA ribbon on a weekly closing basis, it may support the potential for further bullish continuation towards higher resistance levels. Maintaining acceptance above this technical region would also provide additional support for the developing bullish market structure.
Conversely, if price fails to remain above the weekly EMA ribbon and closes back below it, the possibility of a false breakout may increase. This could weaken the current bullish interpretation and potentially lead to renewed downside pressure towards lower price levels.
Overall, the weekly EMA ribbon remains an important technical region to monitor. Bitcoin's ability to hold above or fall back below this area may provide further insight into its broader market structure and potential near-term direction.
-----------------------------------------------------------------------------------------------
Don't invest unless you're prepared to lose all the money you invest. This is a high-risk investment and you should not expect to be protected if something goes wrong. Take 2 mins to learn more: coinjar.com/uk/risk-summary
The article is an opinion expressed by the author at a point in time and does not represent the views of CoinJar UK Limited or CoinJar Australia Pty Ltd. Take care to consider the date of this article and be aware that this opinion is based on circumstances at the time of publishing. No responsibility or liability is accepted for any errors of fact or omission expressed therein. Past performance is not a reliable indicator of future results.
This above article is not to be read as investment, legal or tax advice and it takes no account of particular personal or market circumstances; all readers should seek independent investment advice before investing in cryptocurrencies.
We recommend you obtain financial advice before making a decision to use your credit card to purchase cryptoassets or to invest in cryptoassets.In the UK, it's legal to buy, hold, and trade crypto, however cryptocurrency is not regulated in the UK. It's vital to understand that once your money is in the crypto ecosystem, there are no rules to protect it, unlike with regular investments.
You should not expect to be protected if something goes wrong. So, if you make any crypto-related investments, you're unlikely to have recourse to the Financial Services Compensation Scheme (FSCS) or the Financial Ombudsman Service (FOS) if something goes wrong.
---------------------------------------------------------------------------------------------- Long