Bitcoin(BTC/USD) Daily Chart Analysis For Week of Aug 28, 2026Technical Analysis and Outlook:
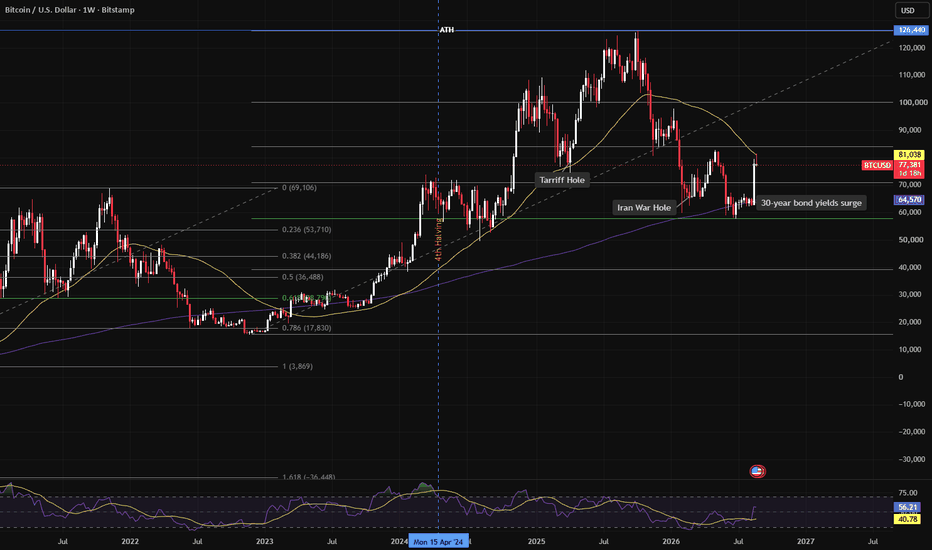
Bitcoin has shown a powerful surge to complete the Inner Coin Rally at $81,300 and, on this price action, has retreated sharply to the Mean Support at $77,000, where it currently is toying with this strong support.
Current price action indicates an intermediate rebound retest towards the completed Inner Coin Rally at $81,300 via the Mean Resistance at $80,300, with potential extensions to the next resistance level marked as Key Resistance at $82,200 and the next Inner Coin Rally at $83,500.
On the downside, Bitcoin is pointing to an extension of its retreat to Mean Support at $74,600, $72,200, and, ultimately, to the intermediate showstopper, Mean Support at $69,000.  Short
Short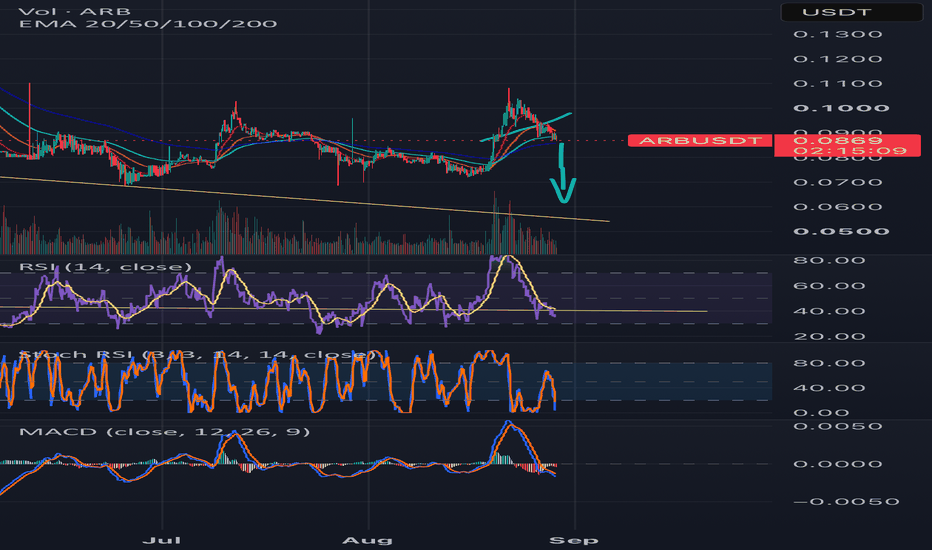
 Long
Long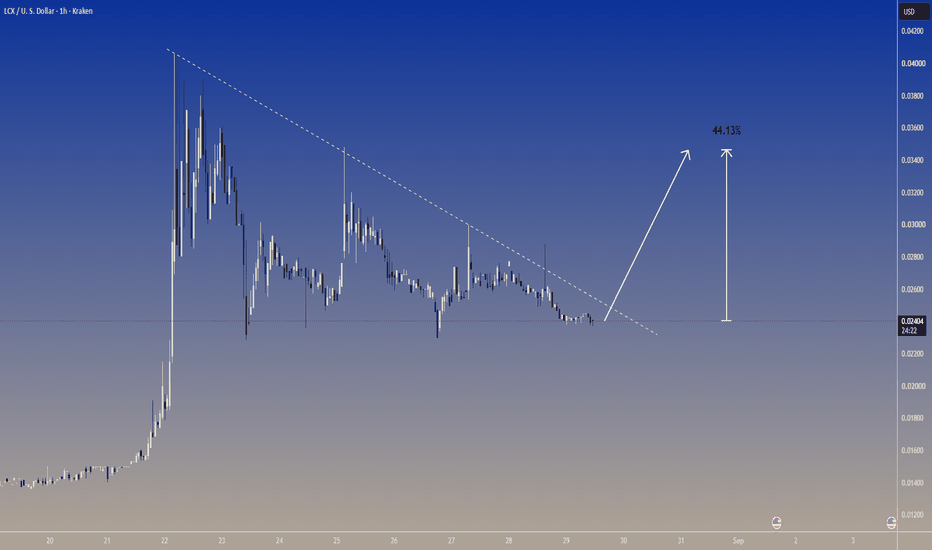
 Long
Long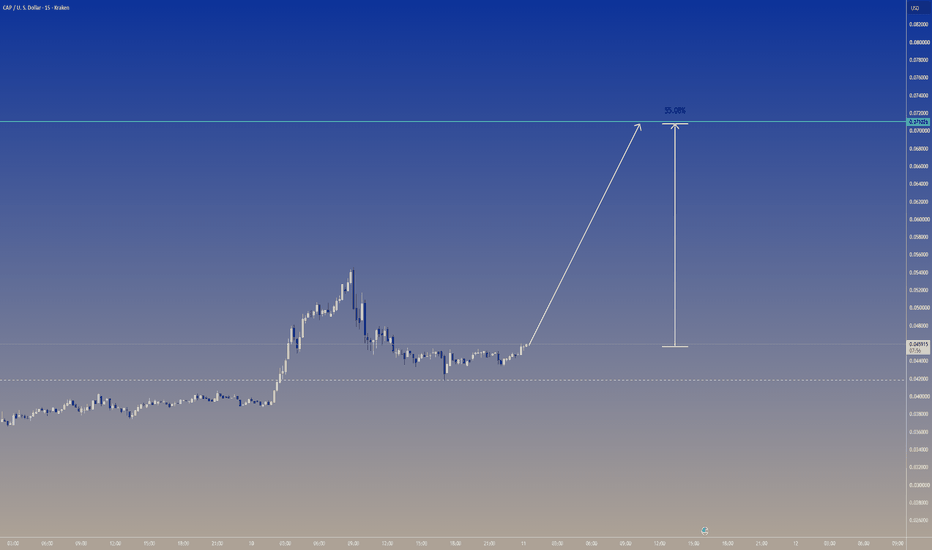
 Short
Short
TRB — Macro Ascending Channel Meets a Major Reversal Zone
Since 2019, TRB has traded within a broad ascending parallel channel, with several major price reversals occurring around its upper and lower boundaries. This long-term structure remains the primary framework for my bullish thesis.
On the lower timeframe, TRB has been trading inside a descending channel since early 2024. After almost three years of persistent weakness, price is now approaching the lower boundary of the long-term ascending channel — an area that has historically acted as an important macro support and reversal zone.
From a structural perspective, TRB may therefore be approaching the final stage of its current bearish cycle.
The key confirmation signal for a new bullish phase would be a decisive breakout above the upper boundary of the 2024–2026 descending channel, marked by the thick yellow trendline on the chart. A confirmed breakout and sustained move outside this descending structure would materially strengthen the case that the long-term uptrend has resumed.
Historically, TRB has shown the ability to expand very aggressively once major compression and corrective structures are resolved. If the descending channel is successfully broken, I would expect volatility and upside momentum to increase rapidly.
As long as the macro ascending parallel channel remains valid, my long-term upside thesis continues to target its major upper-channel resistance zones.
Bullish targets:
$381 area — first major long-term channel objective
$975 area — higher macro channel objective
The central idea is straightforward: TRB is approaching long-term ascending-channel support while simultaneously nearing the end of a multi-year descending structure. The breakout above the descending channel would be the primary confirmation that the next major bullish cycle has begun.
Invalidation: a sustained breakdown below the lower boundary of the long-term ascending parallel channel would materially weaken this thesis. $7.6 is the key level.
Buy spot instead of using leverage, TRB is highly volatile; if it enters a bullish phase, using leverage will make it difficult to maintain ur composure—don't put your human nature to the test.
best,  Long
Long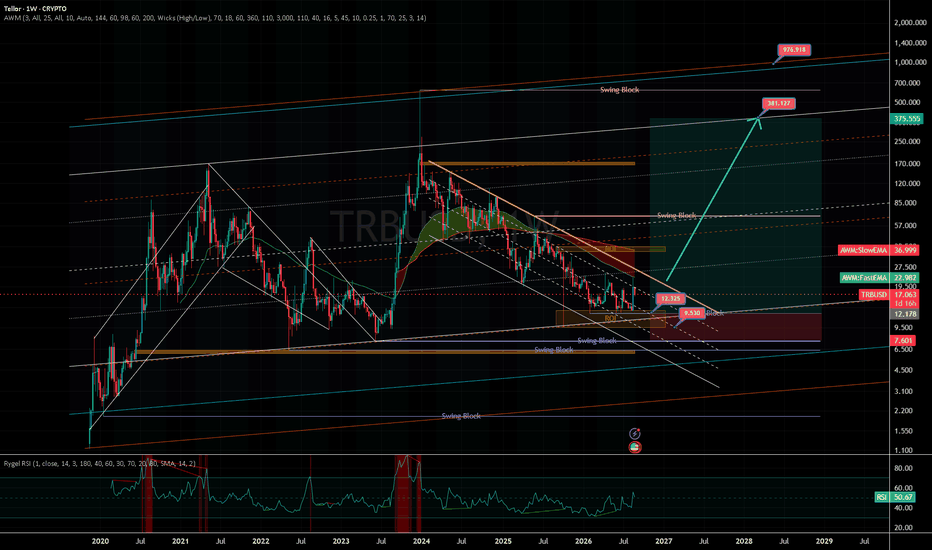
Short 
 Short
Short
Ethereum at the breakout edge — the big move is loading!ETHUSD is maintaining a bullish higher-timeframe structure after the strong rally from the 1,900 area. The latest price action is forming a symmetrical triangle / compression pattern, with a descending upper trendline and ascending lower trendline. This suggests that price is approaching a potential volatility expansion and breakout.
📊 Key Levels
🔴 Resistance Zone: 2,550
Major resistance and the upper boundary of the consolidation.
A strong 1H close above 2,550 would confirm the bullish breakout.
🟢 Supporting Area: 2,380–2,400
Key short-term support and lower boundary of the triangle.
Holding this area keeps the bullish setup valid.
🟢 Demand Zone: ~2,300
Stronger downside demand if the current support fails.
🎯 Target: 2,650
Main bullish objective after a confirmed breakout above 2,550.
📈 Market Structure
CHOCH: The earlier bearish structure around 1,900 shifted into a bullish phase.
BOS: Strong bullish BOS occurred around 2,110 and again around 2,440, confirming the upward structure.
Current Pattern: Symmetrical triangle / compression
Higher Highs & Higher Lows: Overall structure remains bullish.
Supertrend: Around 2,470, currently slightly above price, so a reclaim of this level would add bullish confirmation.
🚀 Bullish Scenario
The key setup is a triangle breakout.
If ETH reclaims 2,470–2,500 and then breaks decisively above 2,550, bullish momentum could accelerate toward:
2,550 → 2,600 → 2,650
The cleaner approach is to wait for breakout confirmation or a successful retest of 2,550 rather than entering directly underneath resistance.
⚠️ Bearish Risk
If the ascending trendline breaks and ETH loses 2,380, the bullish triangle setup weakens.
A deeper move below 2,300 would invalidate the immediate bullish continuation idea and could signal a larger correction.
🔥 Overall Bias
🟢 BULLISH — WAITING FOR TRIANGLE BREAKOUT
Key Battle: 2,550 resistance vs. 2,380–2,400 support
Breakout Target: 2,650
Best Setup: Bullish breakout + retest / buy confirmed pullback  Long
Long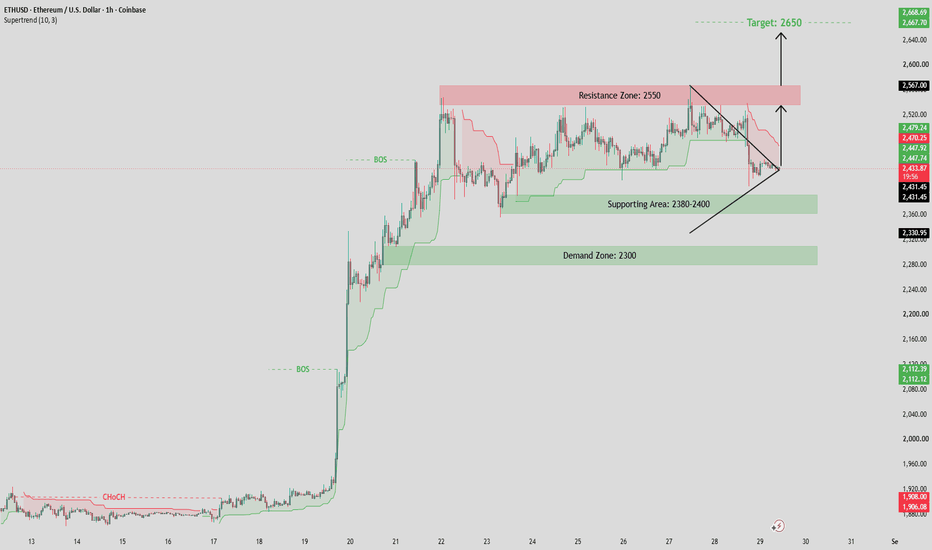
 Short
Short
Long 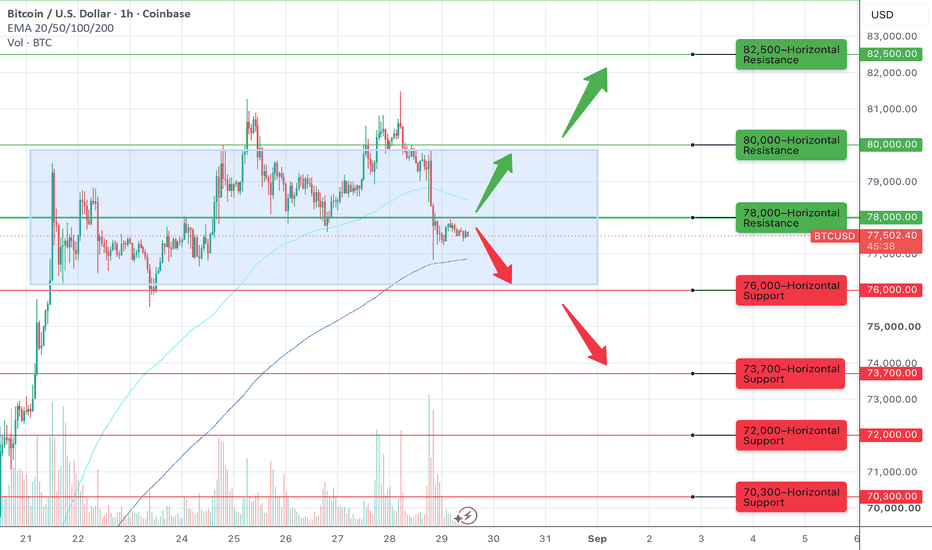
 Short
Short
BTCUSD — 30M Market AnalysisBitcoin is currently trading around the 77,600 area after a strong bearish displacement from the upper range. The broader structure shows that price previously respected a rising parallel channel, but the recent rejection from the upper supply area shifted short-term momentum to the downside.
🔍 Market Structure
The chart highlights a clear liquidity sweep into the 81,000 area, followed by a strong rejection. After that move, price broke lower and is now consolidating inside a small symmetrical triangle near the current price.
📉 Bearish Scenario
If price breaks and closes below the current consolidation structure, the next area of interest could be the 76,000–75,600 zone, where a 30M FVG + Order Block is marked. This area may attract price if bearish momentum continues.
📈 Bullish Scenario
For buyers to regain short-term control, price would need to reclaim the nearby consolidation highs and show acceptance above the triangle. A stronger recovery could then bring the 79,200–79,800 supply zone into focus. The higher 80,500–81,500 supply zone remains an important resistance area.
🎯 Key Levels
Current consolidation: around 77,200–78,000
Lower demand / imbalance zone: 75,600–76,400
First supply zone: 79,200–79,800
Major supply zone: 80,500–81,500
Overall bias: Short-term momentum remains bearish while price stays below the nearby supply zones. However, the current triangle makes confirmation important, so it may be worth waiting for a clear breakout and price acceptance before forming a directional bias.
This analysis is for educational purposes and reflects a technical perspective only. Always manage risk and wait for your own confirmation before making any trading decision. Short 
 Short
Short
$ZEC | 1H | SELL SETUP |Hey traders 👋
What are your thoughts on BINANCE:ZECUSDT right now?
Looking at the 1H chart, ZEC is showing a rejection off a defined supply zone, a pattern that typically signals sellers stepping in at resistance after a strong run-up, often leading to a pullback if the zone continues to hold.
The key level here is the $806.35 to $817.22 selling order block. This zone matters because price has already been rejected from it once, and as long as it caps upside, the bearish structure stays intact.
In the short term, price is likely to keep testing this zone before either confirming the rejection or pushing through it. A failure to reclaim above $806.57 would keep the short setup on track.
If the rejection holds and price stays below $806.57, the path opens up toward $788.44 first and then $741.57 as the move plays out. That would confirm sellers are in control and the supply zone is doing its job.
On the flip side, the setup gets invalidated if price breaks and holds above the $806.35 to $817.22 zone, with $819.57 acting as the stop level. A break above that would flip the near-term bias and suggest buyers have taken the zone back.
If this breakdown was helpful, drop a like and share your thoughts on ZEC in the comments.
Good luck with your trades ❤️  Short
Short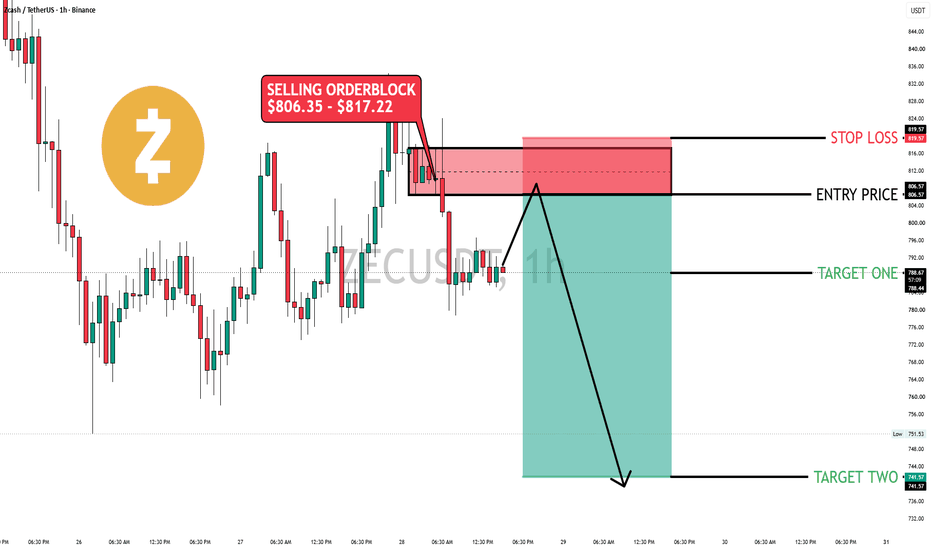
$TRUMP | 1H | BUY SETUP |Hey traders 👋
What are your thoughts on BINANCE:TRUMPUSDT right now?
Looking at the 1H chart, TRUMP is showing a range breakout followed by a retest and a V-shaped recovery, a pattern that typically signals buyers reclaiming control after a shakeout and stepping back in to defend the level. It's the kind of structure that often precedes a fresh leg higher if the retest holds.
The key level here is the $2.527 to $2.559 support zone. This area matters because price already used it once to launch its recent move, and as long as it holds, the demand zone stays valid and the bullish structure remains intact.
In the short term, price is likely to continue hovering around this zone before attempting another push higher. A clean hold above $2.557 would keep the setup on track for a breakout attempt toward the upside targets.
On the bullish side, if buyers keep defending the $2.559 to $2.527 zone, the path opens up toward $2.637 first and then $2.807 on a reclaim. That would mark the next leg higher and confirm the recovery structure is playing out as expected.
On the flip side, the setup gets invalidated if price breaks and closes below the $2.527 to $2.559 zone, with $2.507 acting as the stop loss level. A break below that would flip the near-term bias and suggest the retest failed.
If this breakdown was helpful, drop a like and share your thoughts on TRUMP in the comments.
Good luck with your trades ❤️  Long
Long
 Long
Long
 Short
Short
BTC/USD: EMA55 Reclaim Zone Opens Path Back to 81,272BTC's sitting at 77,466 on the 4H, right on the lower half of the volatility band and just above EMA55 at 76,460. Trend bias is still up per STC, but price has drifted from the upper band back toward the trend backbone after the bullish BoS at 79,500 printed 25 bars ago. The swing high at 81,272 is still open — that line's been sitting there for over four days and hasn't been tested cleanly. The swing low at 77,632 (16 bars back) is the near-term pivot, and price is hovering right around it now.
Why it matters: an uptrend that pulls back to EMA55 without losing it is the textbook continuation setup this indicator flags. Band position went from upper_half during the BoS impulse to lower_half now — that's a healthy reset, not distribution, provided EMA55 holds. ATR's compressed to 995, so volatility is coiling.
The setup activates on a 4H close back above 78,556 (EMA21) with the swing low at 77,632 defended on any wick. That's the trigger to watch for a re-test of the range highs. Invalidation is a clean 4H close below 76,460 — losing EMA55 breaks the trend backbone and the whole idea's done. First target is 79,500 (the prior BoS level, now flip-zone), then 80,049 at the upper band, and finally 81,272 where the still-open swing high sits.
Setup: 4H close back above EMA21 at 78,556 with the 77,632 swing low holding on wicks.
Invalidation: 4H close below EMA55 at 76,460 voids the continuation read.
Targets: 79,500 — prior bullish BoS level, now flip-zone · 80,049 — upper volatility band · 81,272 — still-open swing high, range test Long 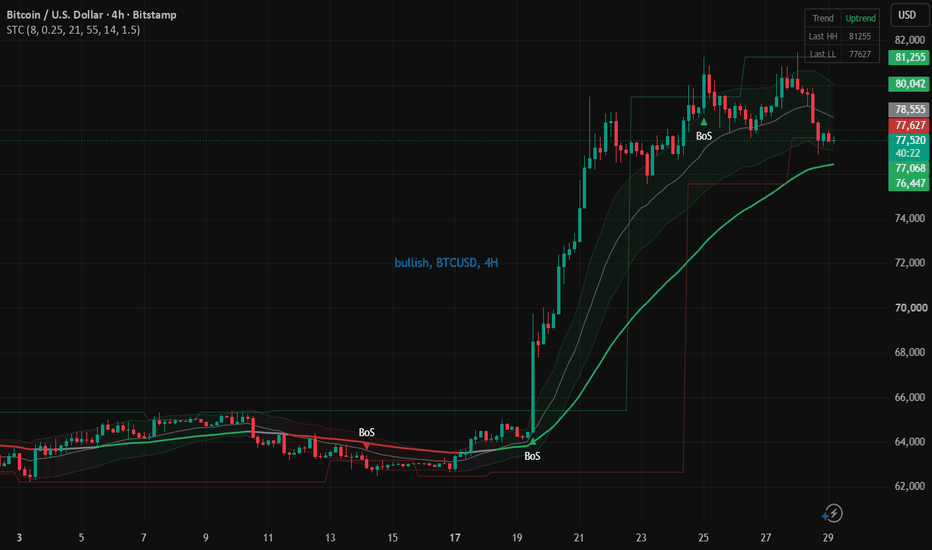
Long 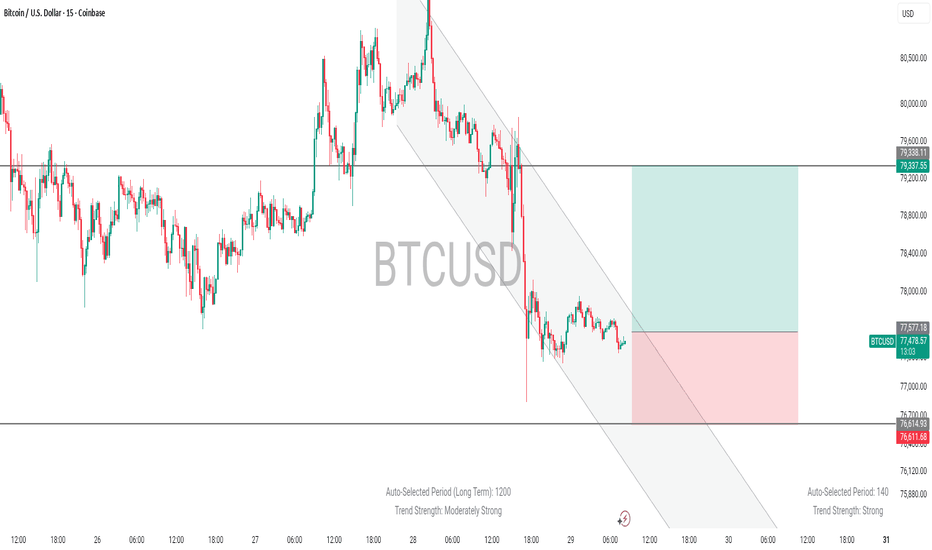
Long
Long 


