Advanced Market Structure & Smart Money Trading ModelInstitutional Liquidity Framework (ILF)
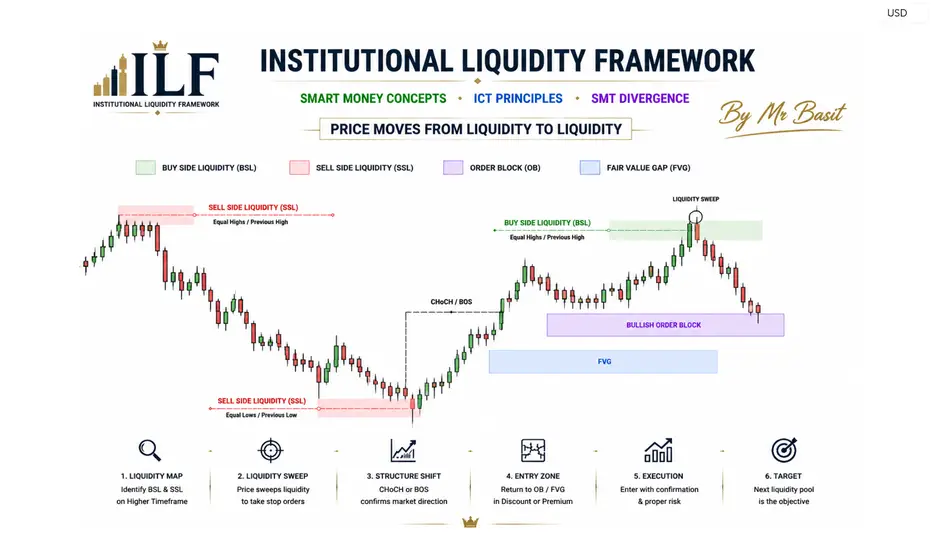
Institutional Liquidity Framework (ILF) is an advanced trading methodology designed to understand how large institutions move the market. This framework combines liquidity analysis, market structure, order flow, price action, and institutional behavior to identify high-probability trading opportunities.
The main idea behind ILF is simple:
"Price moves from liquidity to liquidity."
Instead of chasing candles or relying only on indicators, traders study where liquidity exists, how the market collects it, and when institutional momentum enters the market.
1. Market Structure Analysis
Market structure is the foundation of ILF.
It helps traders understand the current market direction.
Bullish Structure:
Higher High (HH)
Higher Low (HL)
Strong upward momentum
Meaning: Buyers are controlling the market.
Bearish Structure:
Lower High (LH)
Lower Low (LL)
Strong downward momentum
Meaning: Sellers are controlling the market.
Structure Confirmation:
Break of Structure (BOS)
Shows continuation of the existing trend.
Change of Character (CHoCH)
Shows a possible trend reversal.
2. Liquidity Mapping
Liquidity is where traders' stop losses and pending orders are placed.
Institutions use these areas to enter large positions.
Buy Side Liquidity (BSL)
Found above:
Previous highs
Equal highs
Resistance zones
Sell Side Liquidity (SSL)
Found below:
Previous lows
Equal lows
Support zones
Professional traders do not enter randomly.
They wait for:
Liquidity → Reaction → Confirmation → Entry
3. Institutional Order Flow
Order flow shows where strong buying and selling pressure is entering.
Important areas:
Order Block (OB)
The last opposite candle before a strong market move.
A valid Order Block usually creates:
Strong displacement
Market structure break
Liquidity movement
Fair Value Gap (FVG)
A price imbalance created by aggressive buying or selling.
Institutions often return to these zones before continuing the move.
4. Liquidity Sweep Concept
A liquidity sweep happens when price takes previous highs or lows and quickly reverses.
Example:
Price breaks resistance.
Many traders buy the breakout.
Institutions collect their liquidity.
Price reverses downward.
This creates a high-probability setup.
5. Smart Money Divergence Analysis
ILF uses market correlation to identify hidden strength or weakness.
Example:
BTC creates a new low.
Another correlated asset does not create a new low.
This shows weakness in selling pressure.
It can indicate a possible reversal.
6. Premium & Discount Zones
ILF uses Fibonacci equilibrium to find better entries.
Discount Area:
Below 50% of the range.
Preferred for buying.
Premium Area:
Above 50% of the range.
Preferred for selling.
The best setups occur when:
Liquidity + Order Block + Fibonacci Zone
come together.
7. Entry Model
Buy Setup:
1. Higher timeframe bullish bias
2. Price reaches discount area
3. Sell-side liquidity is taken
4. Market structure shifts bullish
5. Price returns to Order Block/FVG
6. Entry confirmation appears
Sell Setup:
1. Higher timeframe bearish bias
2. Price reaches premium area
3. Buy-side liquidity is taken
4. Market structure shifts bearish
5. Price returns to Supply Zone/FVG
6. Entry confirmation appears
8. Multi Time Frame Approach
Professional execution:
Higher Time Frame:
Find direction
Monthly / Weekly / Daily
Mid Time Frame:
Find zones
4H / 1H
Lower Time Frame:
Find entry
15M / 5M
9. Risk Management Rules
A professional system requires professional discipline.
Rules:
Risk only 1% per trade
Always use stop loss
Minimum Risk Reward 1:2
Avoid emotional trading
Do not chase missed entries
Wait for confirmation
A good trader does not win every trade.
A good trader controls losses and protects capital.
10. ILF Trading Philosophy
Do not predict the market. Read the market.
The market leaves footprints through:
Liquidity
Structure
Order Flow
Price Reaction
When all confirmations align, probability increases
Institutional Liquidity Framework (ILF)
Liquidity + Market Structure + Order Flow + Smart Money Behavior + Risk Management
A Complete Professional Trading Framework
Suitable For: BTCUSD, XAUUSD, Forex, Indices, and Crypto Markets.  Education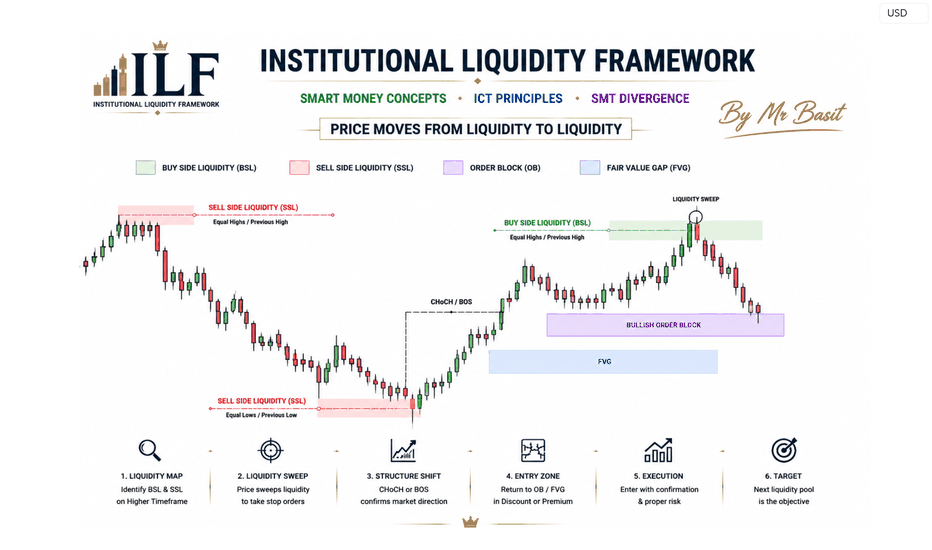
BTCUSD | Institutional Market Structure & Liquidity AnalysisBTCUSD | Institutional Market Structure & Liquidity Analysis
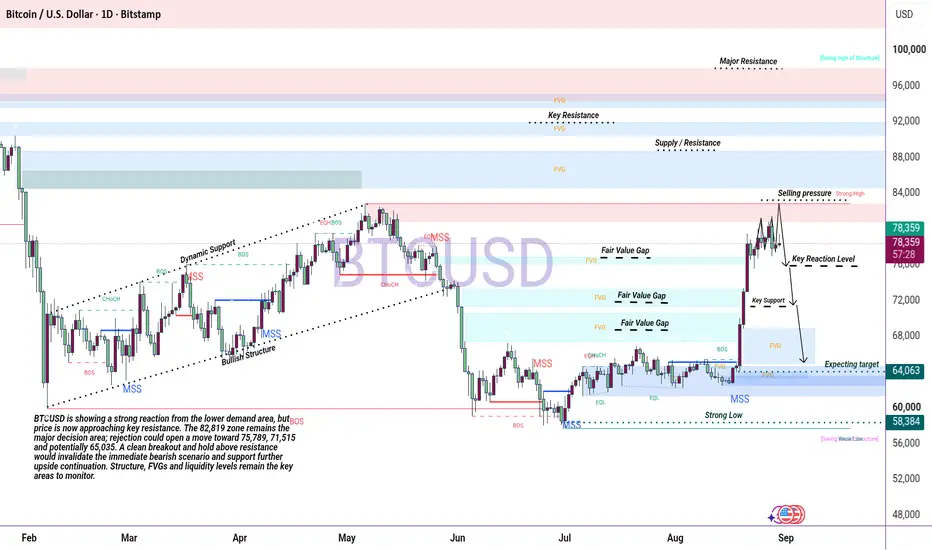
This Bitcoin 1D analysis provides a detailed candle-by-candle study of market structure, liquidity, Fair Value Gaps (FVG), Market Structure Shifts (MSS), Break of Structure (BOS), and key supply and demand areas.
The chart begins with strong bearish pressure, where consecutive candles pushed price lower and established an important swing low. After this decline, price entered a consolidation phase, allowing buyers to build a base and gradually regain control.
The following candles started forming higher highs and higher lows. Multiple BOS confirmations showed that bullish momentum was developing, while the rising structure indicated increasing buying pressure. Price continued to respect the dynamic support trendline during this phase.
As Bitcoin approached the 82,819 area, price reached a significant resistance and liquidity zone. The candles around this region showed hesitation and increased selling pressure. The subsequent bearish structure produced MSS and CHoCH signals, confirming a temporary shift in momentum.
During the June decline, strong bearish candles broke important support levels and drove price toward the 58,384 swing-low area. This region acted as a major demand zone, where selling pressure weakened and buyers began accumulating.
From July into August, price formed a prolonged consolidation structure. Repeated liquidity sweeps, equal lows, FVG reactions, and MSS signals eventually supported a strong bullish expansion. The latest candles show a sharp recovery from the 65,035 area toward the 78,412 region.
The current price is approaching the 82,819 resistance. A confirmed breakout and daily close above this level could strengthen the bullish structure, while rejection may lead to a retracement toward 75,789, 71,515, and 65,035.
Every candle is analyzed in relation to the previous candle, liquidity, structure, momentum, and reaction zones. The purpose is to understand the complete price-action story rather than predict every individual candle.
This analysis is for educational and technical-analysis purposes only and is not financial advice. Short 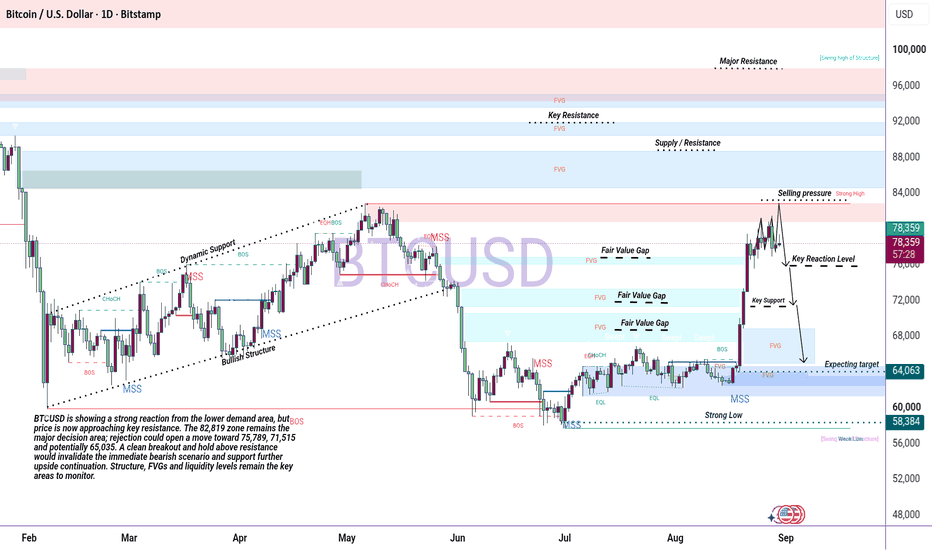
Short 
ETHUSD – H1 – Bullish Continuation & Resistance SetupETHUSD – H1 – Bullish Continuation & Resistance Setup
ETHUSD is currently trading around 2,475 after holding above the recent support structure. The price action suggests a potential bullish continuation if ETH maintains strength above the 2,422 area and breaks the nearby descending trendline.
If buyers regain control and price sustains above the current structure, ETH could move toward the marked resistance levels.
If Bullish Structure Holds
🟢 1st Resistance: 2,600
🟢 2nd Resistance: 2,700
🔵 Support Zone: 2,300–2,422
Market Structure Insight
The current H1 structure shows price consolidating after the recent decline, with a potential breakout forming near the descending trendline. A confirmed breakout followed by sustained strength above the current structure could initiate an upside move toward 2,600.
If buying pressure continues and 2,600 breaks decisively, the next major resistance comes into focus around 2,700.
On the downside, a sustained break below 2,422 would weaken the bullish setup. If 2,300 is also broken decisively, the current bullish structure would be significantly weakened and a deeper correction could develop.
⚠️ Disclaimer: This analysis is for educational purposes only. Always wait for confirmation before entering a trade and apply proper risk management.  Long
Long
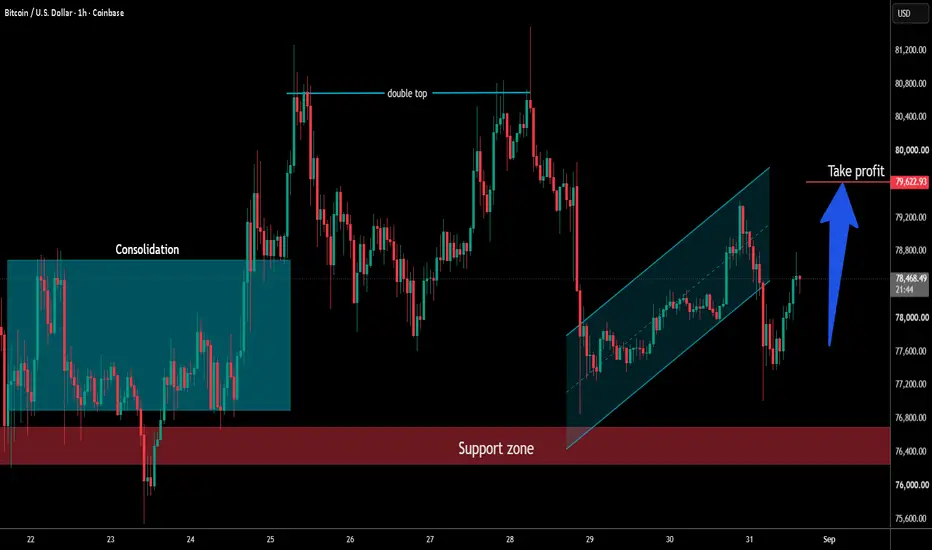
BTCUSDT: Triangle Support and Zone Point to Further UpsideHello everyone, here is my breakdown of the current BTCUSDT setup.
Market Analysis
BTCUSDT previously traded inside a range before breaking out strongly and shifting bullish. Price then advanced higher, tested the 81,000 Resistance Zone twice (TEST and RETEST), where sellers rejected the upside.
Currently, BTC is trading below the 81,000 Resistance Zone while holding above the Support Zone and the ascending Triangle Support Line. The recent pullback suggests a possible retest of support before another move higher.
My Scenario & Strategy
As long as BTCUSDT remains above the Support Zone and respects the Triangle Support Line, the bullish scenario remains valid. A successful rebound from support could push price toward the 81,000 Resistance Zone (TP1).
However, a breakdown and close below the Support Zone or Triangle Support Line would weaken the bullish outlook and increase the risk of further downside.
That’s the setup I’m tracking. Thank you for your attention, and always manage your risk. Long 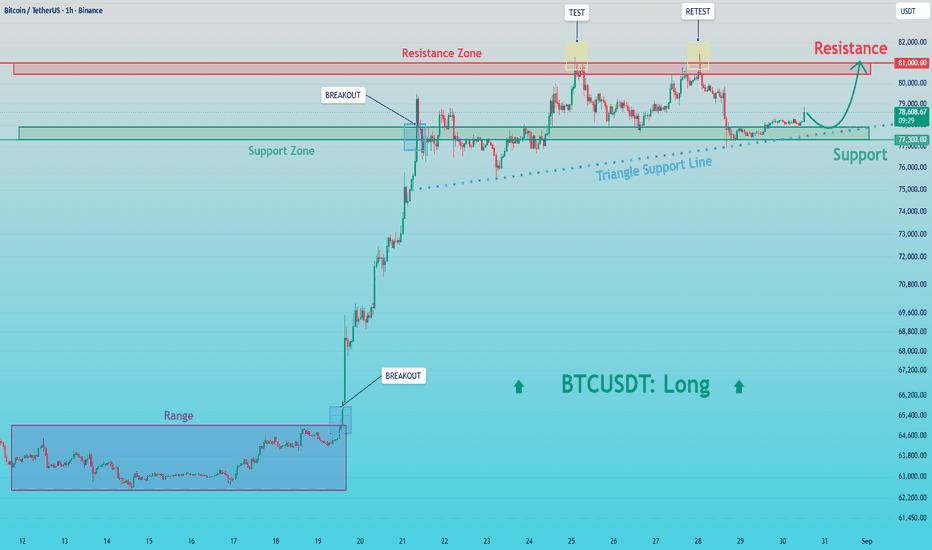
Long 
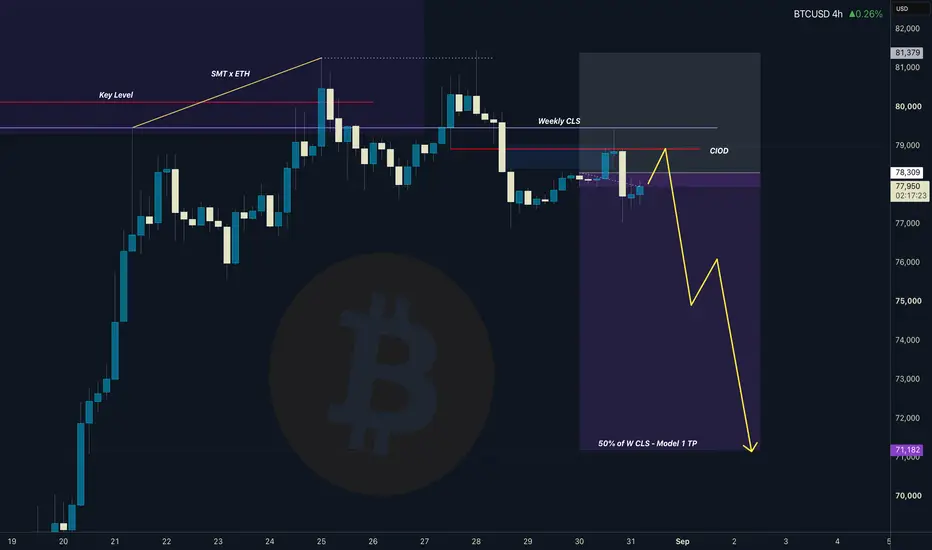
BTCUSD — Rising Trendline Breakdown | Bearish Structure🔹 BTCUSD is showing a clear shift in short-term market structure after price broke below the rising trendline that had supported the previous advance. The rejection near the 80,000–81,000 resistance zone was followed by a sharp move lower, and price is now consolidating around the 77,500–78,200 area. This suggests that sellers have gained some short-term control, while the former trendline could now act as overhead resistance if price attempts a recovery.
🔸 From a price action perspective, continued weakness below the broken structure may open a path toward the 74,000 area, where previous price action could attract liquidity and demand. However, a reclaim of the broken trendline and stronger acceptance above nearby resistance could weaken the bearish structure and support a recovery toward the upper range. Traders may wait for clear price confirmation before considering any trade, particularly around the key support and resistance zones.
This analysis is for educational purposes only and does not constitute financial or investment advice. Always conduct your own research before making trading decisions. Short 
TOTAL Crypto Cap: Bull-Flag-Formation, Setup for Higher Zones!Hello Community,
welcome to my new analysis of the TOTAL cryptocurrency market cap price developments. The very recent uptrend, which brought the price of TOTAL above the $2.65T mark, was a great opportunity to secure solid profits on the long side, trading the various altcoins which moved to the upside simultaneously with TOTAL. Now, I detected the underlying formational structures which will determine the next steps for TOTAL.
When looking at my chart, we can see how TOTAL is forming this major bull-flag formation. Within the formation, TOTAL is already completing the wave count with a main support within the lower boundary of the bull-flag formation. There is strong evidence that TOTAL will bounce within this area and set up the next bullish wave from there on. If the bullish momentum increases after TOTAL has done so, there will be a good potential for the bull-flag to complete.
Once TOTAL bounces above the upper boundary as seen in my chart, this will activate the upper target zones. In this case, it is highly important that the 50-EMA is confirmed as support and that the bullish momentum increases for the upper target zones to be reached sufficiently. A final target zone of $2.9T will be a reasonable target for the bullish wave towards the upside once the bull-flag formation has been completed.
In this manner, thank you a lot for watching!
The support is highly appreciated.
VP Long 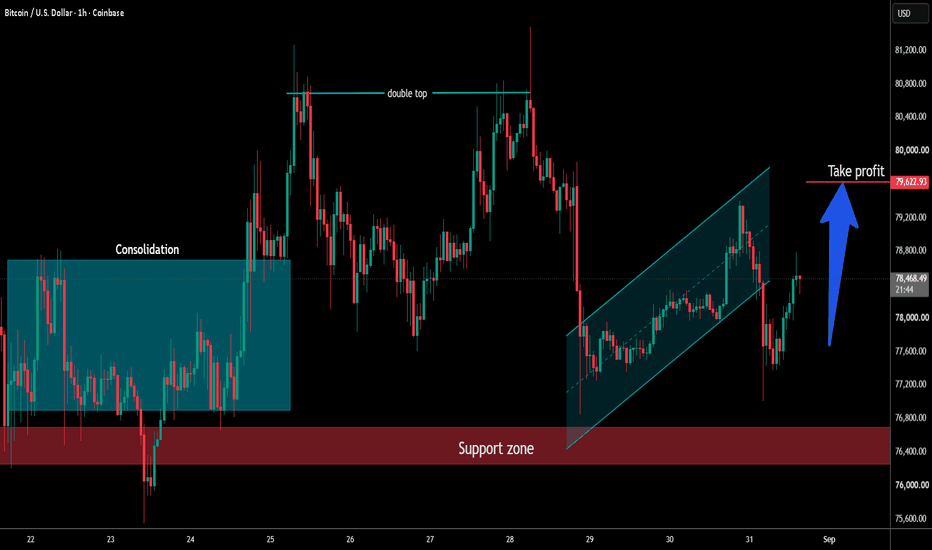
 Long
Long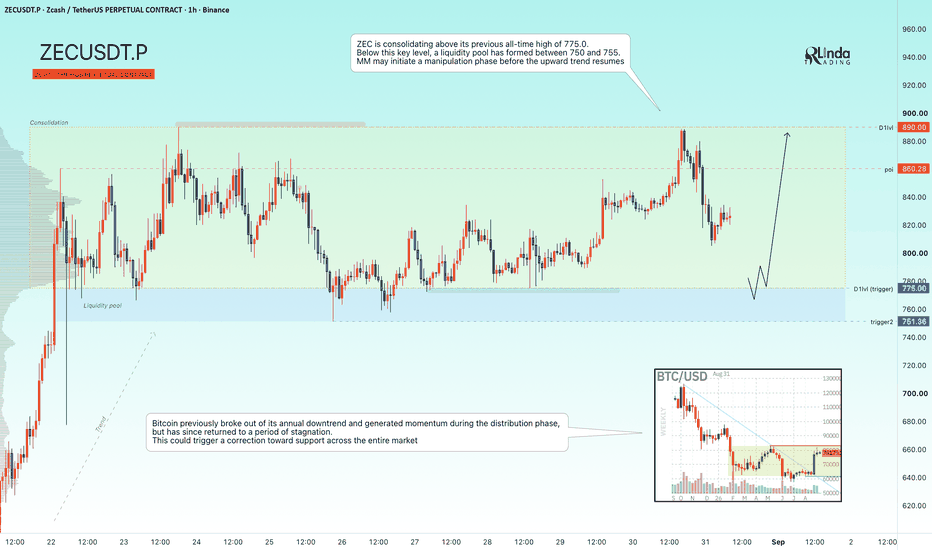
Long 
PROFIT-DRIVEN MINDSET — THE FOUNDATION OF CONSISTENT TRADINGSuccessful trading is not about taking more trades or chasing quick profits. It is about developing the right mindset, following a structured plan, managing risk, and staying disciplined when the market becomes unpredictable.
1. THINK LIKE A TRADER, NOT A GAMBLER
Every trade should have a clear reason behind it. Never enter the market simply because price is moving fast or because you are afraid of missing an opportunity. A professional trader waits for the right conditions.
2. FOCUS ON QUALITY, NOT QUANTITY
You don't need dozens of trades every day. One high-quality setup with proper confirmation can be more valuable than multiple emotional entries. Patience is part of the strategy.
3. PROTECT YOUR CAPITAL FIRST
Profit comes second. Risk management comes first. Always understand where your trade idea becomes invalid and manage your position accordingly. Never risk money you cannot afford to lose.
4. FOLLOW YOUR TRADING PLAN
Before entering a trade, know your entry, stop loss, targets, market structure, and reason for the setup. Once the plan is created, avoid changing it because of fear or greed.
5. MASTER PATIENCE
The market does not owe you a trade every day. Sometimes the best decision is to stay out and wait. No setup = no trade.
6. CONTROL EMOTIONS
Fear can make you exit too early. Greed can make you overstay. Revenge trading can turn one loss into several losses. A strong trader learns to remain calm after both wins and losses.
7. THINK IN TERMS OF PROBABILITIES
No strategy wins every trade. Even a good setup can fail. The goal is not to predict every market move — it is to execute a tested strategy consistently while keeping losses controlled.
8. LEARN FROM EVERY TRADE
Winning trades teach you what works. Losing trades teach you what needs improvement. Keep a trading journal, review your decisions, and continuously improve your execution.
9. BUILD CONSISTENCY OVER TIME
Real progress comes from repeating good habits. Don't judge your entire trading ability from one trade, one day, or one week. Focus on making better decisions over a large number of trades.
Remember: The objective isn't to win every trade. The objective is to protect your capital, follow your system, control your emotions, and give your strategy the opportunity to work over time.
Education 
Ethereum: Developing Range and Potential Re-Accumulation ?Ethereum price action is beginning to display characteristics that resemble its previous consolidation phase. During the prior structure, ETH traded within a relatively tight range for an extended period, with range-high resistance repeatedly respected before a bullish engulfing candle eventually broke the structure and was followed by a sustained rally.
The current price action is showing some similarities, with ETH again developing within a comparatively narrow consolidation range. The extended sideways movement may indicate a period of market equilibrium, while also potentially providing conditions for re-accumulation. However, the current structure remains incomplete, and there has been no confirmed bullish breakout at this stage.
As long as price continues to trade within the established range, further consolidation remains a possible outcome. From a technical perspective, attention can be placed on how price behaves around both the range high and range low, as these areas may provide greater insight into the next directional move.
A bullish engulfing candle accompanied by follow-through above the range high could strengthen the comparison with the previous structure. Conversely, continued rejection from resistance or a breakdown below the range could invalidate the developing similarity and shift the focus toward further consolidation or downside movement.
For now, the structure remains in development, making confirmation more important than anticipation.
-----------------------------------------------------------------------------------------------
Don't invest unless you're prepared to lose all the money you invest. This is a high-risk investment and you should not expect to be protected if something goes wrong. Take 2 mins to learn more: coinjar.com
The article is an opinion expressed by the author at a point in time and does not represent the views of CoinJar UK Limited or CoinJar Australia Pty Ltd. Take care to consider the date of this article and be aware that this opinion is based on circumstances at the time of publishing. No responsibility or liability is accepted for any errors of fact or omission expressed therein. Past performance is not a reliable indicator of future results.
This above article is not to be read as investment, legal or tax advice and it takes no account of particular personal or market circumstances; all readers should seek independent investment advice before investing in cryptocurrencies.
We recommend you obtain financial advice before making a decision to use your credit card to purchase cryptoassets or to invest in cryptoassets.In the UK, it's legal to buy, hold, and trade crypto, however cryptocurrency is not regulated in the UK. It's vital to understand that once your money is in the crypto ecosystem, there are no rules to protect it, unlike with regular investments.
You should not expect to be protected if something goes wrong. So, if you make any crypto-related investments, you're unlikely to have recourse to the Financial Services Compensation Scheme (FSCS) or the Financial Ombudsman Service (FOS) if something goes wrong.
---------------------------------------------------------------------------------------------- Price Often Moves the Least Where the Most Business Is DoneOne of the stranger realities of financial markets is that the areas producing the biggest future moves often appear remarkably quiet while they are developing.
This feels backwards because traders naturally associate movement with importance. Large candles attract attention, while slow consolidation is usually dismissed as a lack of opportunity. Yet from the perspective of market mechanics, quiet conditions often represent periods of intense activity.
The reason is simple.
When buyers and sellers largely agree on value, enormous amounts of volume can change hands without producing significant movement. Institutions gradually build or reduce positions, long-term investors adjust exposure, and liquidity remains sufficient to absorb those transactions without allowing price to escape the area.
To an outside observer, almost nothing seems to be happening.
In reality, the ownership of the market may be changing dramatically.
Once that transfer is largely complete, the balance shifts. There are fewer participants left willing to trade at the previous price, and the market suddenly begins moving quickly toward a new area of value. The explosive move receives all the attention, even though the most important process actually occurred beforehand.
This perspective changes the way consolidations should be interpreted.
Instead of seeing them merely as periods where nothing happens, they can be viewed as places where the market quietly reorganizes itself before the next phase begins. Some consolidations fail completely, while others become the foundation for major trends. The challenge is not predicting which outcome will occur, but appreciating that quiet price action can represent significant underlying activity.
The loudest part of a move is rarely where the most important decisions were made.
Those decisions were often made earlier, while the chart looked almost completely unremarkable. Bitcoin Consolidation Breakdown Pressure & Possible bullish Bitcoin is currently trading under selling pressure after failing to hold the higher resistance zone near 80,000 / 81,000. The price action shows a repeated rejection from the upper range, creating lower highs and pushing BTC back toward the important support area around 77,000 / 76,500.
Tecnically current downside pressure is mainly driven by a combination of technical weakness and macro uncertainty. Recent hawkish comments from the Federal Reserve increased expectations of tighter monetary policy, strengthening the US Dollar and putting pressure on risk assets like Bitcoin. Rising geopolitical tensions have also reduced risk appetite across global markets.
Resistance ; 80k / 81k
Support level ; 77k 76k
From a technical perspective, BTC is still moving inside a large consolidation structure. The rejection from the breakout area suggests buyers are struggling to maintain momentum a clean break below the 77,000 support zone could open the way toward deeper liquidity areas, while holding this level may allow another attempt toward 80,000 / 81,000 resistance.
Hope you found this analysis helpful. 👍
Like, Comment & Follow for more updates. Trade safe. Long 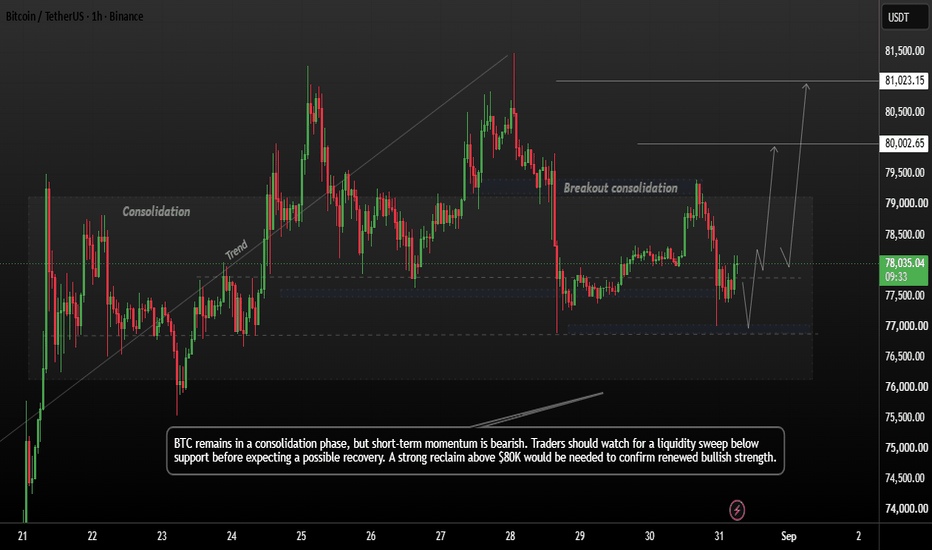
Bitcoin At $100K Or $50K? Chart Has One Answer... $100K or $50K? Bitcoin is now sitting at a level that could change everything.
What happens if $82K breaks?
And what if $76K fails?
Bitcoin is around $78K right now, and the next move could be very important. The $80K to $82K area is the main resistence, while $76K is the key support to watch. If Bitcoin breaks $82K and closes above it with strong volum, $100K could become a real target. But if price gets rejected and falls below $76K, the whole picture could change quickly. This is where FOMO can hurt traders, because a big pump does not always mean the trend is safe. So the big question is simple: are we seeing a real breakout or another trap?
TradingView has some simple tools that can help us answer that question. First, mark the main support and resistance levels on the daily chart and watch how price react there. Then use Volume to see if buyers are really behind a breakout. RSI can show how strong the move is, but an overbought RSI does not always mean Bitcoin must fall. Moving averages can help you see the bigger trend, while Fibonacci can show possible pullback areas. I would also set price alerts around $82K, $77K and the main support levels. This way, you wait for the market to confirm the move instead of chasing every green or red candle.
For me, $100K becomes much more interesting if Bitcoin breaks $82K, holds it as support and keeps strong momentum. On the other hand, $50K become a serious risk only if important supports break and selling pressure keeps growing. Until that happens, nobody really knows which target comes first. Trying to predict the exact top or bottom can also be a very expensive mistake. Watch the levels, check the volume and protect your capital. Bitcoin does not have to choose $100K or $50K today. We only need to watch the next important level and see who wins the fight. Education 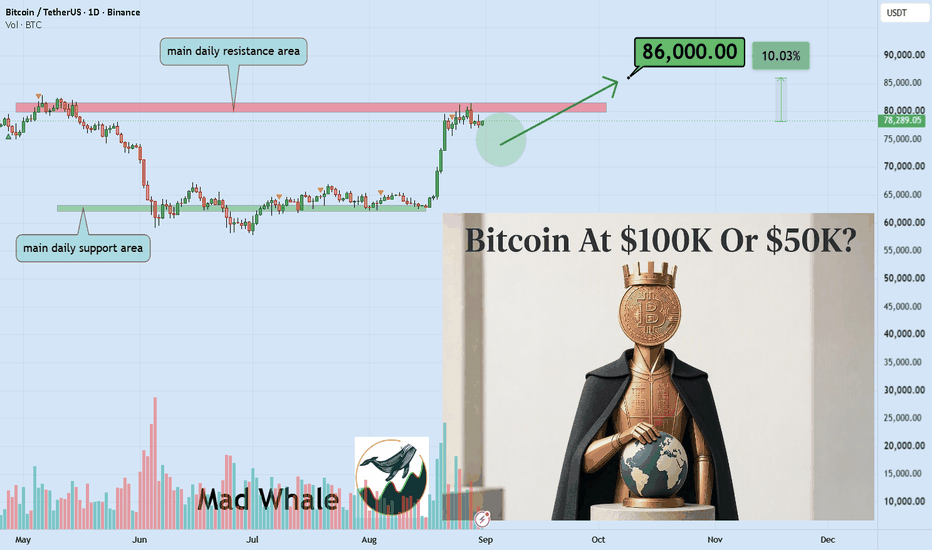
PEPE Multiple Technical Levels ConvergePEPE price action is currently trading around a technical confluence zone, making this an important region to monitor in the immediate short term. This area includes key daily support, the 200 simple moving average, a previous resistance level that is now be acting as support around the 0.618 Fibonacci retracement level.
If price holds this region and develops a sustained recovery, it could support the broader bullish market structure. From an Elliott Wave perspective, this may also suggest that a potential Wave 2 correction has been completed within a larger five-wave structure. However, any continuation would depend on sustained bullish momentum and broader market participation.
On the other hand, a decisive break below this key support region could weaken the current bullish structure. Such a move may invalidate the existing impulsive wave interpretation and increase the possibility of a deeper corrective move towards lower support areas, potentially including the base of the previous advance.
Overall, this technical region remains critical from a price action and market structure perspective. The market's reaction around this zone may provide insight into PEPE's near-term direction, although no particular outcome is guaranteed.
----------------------------------------------------------------------------------------------
Don't invest unless you're prepared to lose all the money you invest. This is a high-risk investment and you should not expect to be protected if something goes wrong. Take 2 mins to learn more: coinjar.com/uk/risk-summary
The article is an opinion expressed by the author at a point in time and does not represent the views of CoinJar UK Limited or CoinJar Australia Pty Ltd. Take care to consider the date of this article and be aware that this opinion is based on circumstances at the time of publishing. No responsibility or liability is accepted for any errors of fact or omission expressed therein. Past performance is not a reliable indicator of future results.
This above article is not to be read as investment, legal or tax advice and it takes no account of particular personal or market circumstances; all readers should seek independent investment advice before investing in cryptocurrencies.
We recommend you obtain financial advice before making a decision to use your credit card to purchase cryptoassets or to invest in cryptoassets.In the UK, it's legal to buy, hold, and trade crypto, however cryptocurrency is not regulated in the UK. It's vital to understand that once your money is in the crypto ecosystem, there are no rules to protect it, unlike with regular investments.
You should not expect to be protected if something goes wrong. So, if you make any crypto-related investments, you're unlikely to have recourse to the Financial Services Compensation Scheme (FSCS) or the Financial Ombudsman Service (FOS) if something goes wrong.
---------------------------------------------------------------------------------------------- Solana Holds $96, is $122 Next ? Solana price action continues to consolidate above the $96 level, creating an important technical base for the next potential directional move. The ability to maintain price above this region is a constructive sign, as it suggests buyers are continuing to defend the current market structure despite the ongoing consolidation.
As long as SOL remains above $96, the bullish scenario remains favored, with the probability of a continuation toward the $122 level increasing. This area represents the next major upside objective and could become a significant test of whether the current consolidation develops into a sustained bullish expansion.
However, price holding support alone may not be enough to confirm a strong continuation. Traders should pay close attention to inflow momentum and whether positive volume clusters begin appearing as price moves higher. An increase in buying activity would provide additional confirmation that capital is flowing into SOL and could help sustain the move toward higher price levels.
A decisive break above the current consolidation structure, supported by stronger volume and positive inflows, would strengthen the bullish thesis. Conversely, a sustained breakdown below $96 would weaken the setup and suggest that the market may need to establish a lower support region before attempting another recovery.
For now, the technical picture remains constructive. SOL is consolidating above a critical level, giving buyers an opportunity to build momentum. If $96 continues to hold and inflows strengthen, the path toward $122 remains open and could mark the next significant leg higher for Solana.  Long
Long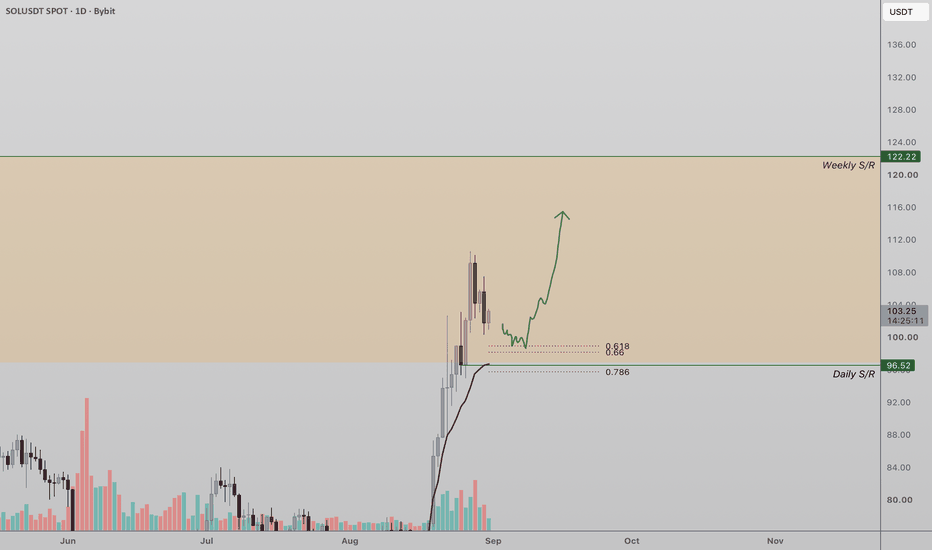
ETH – Follow the BoxesSometimes, the clearest way to understand the current cycle is simply to look at how Ethereum behaved in the previous one.
The boxes on the chart highlight an interesting similarity.
During the previous cycle, ETH first entered the blue correction box, followed by a deeper move into the green accumulation box.
Price spent months inside that green area before finally breaking above it and starting a major bullish expansion.
Now look at the current cycle.
We have already seen a similar correction through the blue box, followed by another consolidation inside the green box.
And ETH is now testing the upper boundary around the psychological $2,500 level.
📌 This is the level I am watching closely.
A strong weekly momentum candle close above the green box and $2,500 would be our confirmation that this accumulation phase may be ending.
If confirmed, I will expect the next major bull run to activate, with ETH potentially transitioning from consolidation into a new expansion phase.
Until then, there is no need to anticipate the breakout.
Follow the boxes. Wait for the confirmation. Then follow the momentum. 📈
⚠️ Disclaimer: This analysis is for educational purposes only and does not constitute financial advice. Past market behavior does not guarantee the same outcome in the current cycle.
📚 Stick to your trading plan regarding entries, risk, and management.
Good luck! 🍀
All Strategies Are Good; If Managed Properly!
~Richard Nasr Short 
BITCOIN Is this Head and Shoulders like May or will it fail?Bitcoin (BTCUSD) is forming a Head and Shoulders (H&S) pattern following its incredible rally 2 weeks ago, and already broke below the 4H MA50 (blue trend-line), which is technically its first short-term Support.
H&S patterns are often formed on market Tops and signal a technical correction towards at least the 2.0 Fibonacci extension. However, since May, we've had three such patterns with 2 failing to produce a significantly technical Low, while only 1 succeeded at this.
That was the H&S following the May 06 Top, which was a Lower High on the Bear Cycle scale and not only did it hit its 2.0 Fibonacci extension, but even made a new Cycle Low as it collapsed by -30%.
With the 4H RSI currently on a Bearish Divergence, it is not unlikely to see another such technical drop but on the short-term, the 2.0 Fib ext looks like a more feasible technical Target as at $70250, it will also make a contact with the 1D MA50 (red trend-line). Note also that the recent August 28 High hit (and so far got rejected on) the 1W MA50 (red trend-line), which has historically been the Bear Cycle's Resistance.
So do you think the current H&S will break downwards or make a new High?
Feel free to let us know in the comments section below!
---
** Please LIKE 👍, FOLLOW ✅, SHARE 🙌 and COMMENT ✍ if you enjoy this idea! Also share your ideas and charts in the comments section below! This is best way to keep it relevant, support us, keep the content here free and allow the idea to reach as many people as possible. **
---
💸💸💸💸💸💸
👇 👇 👇 👇 👇 👇