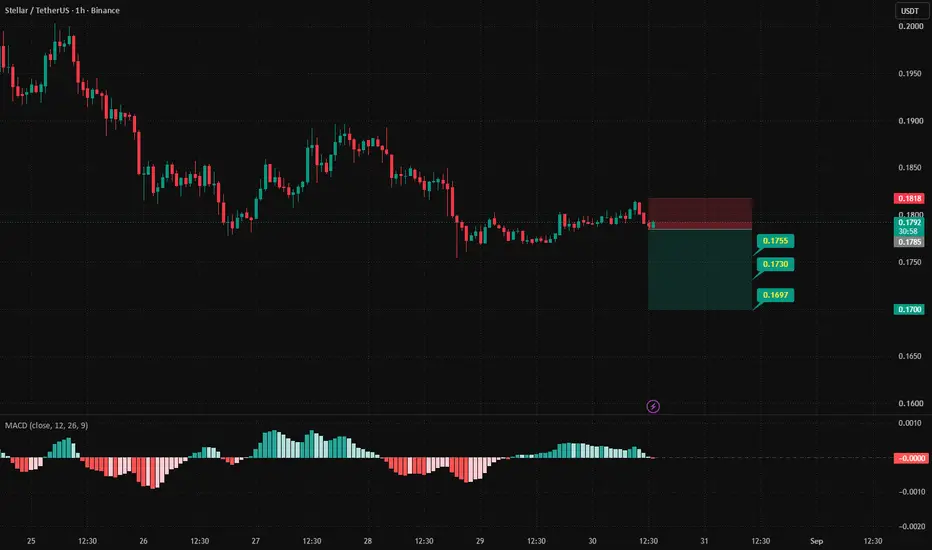
XLM ForecastBINANCE:XLMUSDT On the higher timeframe, we are seeing an overall downtrend followed by a corrective move. However, the smaller bearish waves are strong and impulsive, while the smaller bullish waves are relatively weak and corrective.
If our trigger breaks strongly to the downside, we expect further downside and a continuation of the bearish move.
I would greatly appreciate hearing your technical opinions and insights on this potential scenario.
⚠️ Risk Disclaimer
All analyses, market views, and scenarios presented on this page are provided for informational and educational purposes only and should not be considered financial advice or a recommendation to buy or sell any financial instrument.
Financial markets involve substantial risk, and none of the scenarios presented here are guaranteed to occur. Each trader is solely responsible for their own trading decisions, risk management, and any profits or losses resulting from their trades.
Please consider your own financial situation, risk tolerance, and trading strategy before making any trading decision. Do not rely solely on the information provided on this page when making investment or trading decisions.  Short
Short
 Long
Long
 Long
Long
 Long
Long
 Long
Long
Long 
 Long
Long
LIGHTER/USDC – Bullish Setup with Strong Order Book ImbalanceHello, Traders! 👋
Today we are taking a technical look at LIGHTER/USDC on Coinbase Advanced Spot.
Current Market Context (Snapshot at 11:57 GMT+2):
Price: 3.470 USDC
24h Change: -6.49% (daily data shows -6.49%, though recent momentum is +0.1%)
Technical Setup & Key Levels:
Based on recent price action, order flow, and published case studies, we are monitoring a potential continuation pattern.
Entry Consideration: Monitoring reactions around the 3.474 USDC level.
Primary Target (Take-Profit): 3.613 USDC (+4.00%).
What the Indicators Suggest:
The overall technical structure remains constructive:
Buy-Side Imbalance: Currently at +62.8%, indicating strong buying pressure relative to selling liquidity.
Patterns Observed: Bull flag breakout measured move and cup & handle formation both project to the 4.85–4.92 zone, creating strong confluence.
Moving Averages: Price trading above the 21-day and 50-day EMAs, with both trending upward.
Key Levels to Monitor:
Level
3.613 USDC Immediate upside target (+4%)
3.42 USDC Breakout confirmation level
3.28 USDC Key structural support
2.90 USDC Potential pullback / re-entry zone
What to Watch:
Breakout above 3.42 USDC with volume expansion
Persistence of the +62.8% buy imbalance
Confirmation of the bull flag measured move
Macro tailwinds (SEC regulation news, Fed policy) supporting risk-on sentiment
Conclusion:
LIGHTER/USDC presents a constructive setup with strong order-book confirmation, but breakout confirmation above 3.42 USDC is still required. The confluence of multiple technical patterns (bull flag, cup & handle, Fibonacci extensions) suggests significant upside potential if the broader market remains supportive.
What are your thoughts on LIGHTER? Do you see a pullback to $2.90 or a direct push to $4.85? Let me know in the comments below!  Long
Long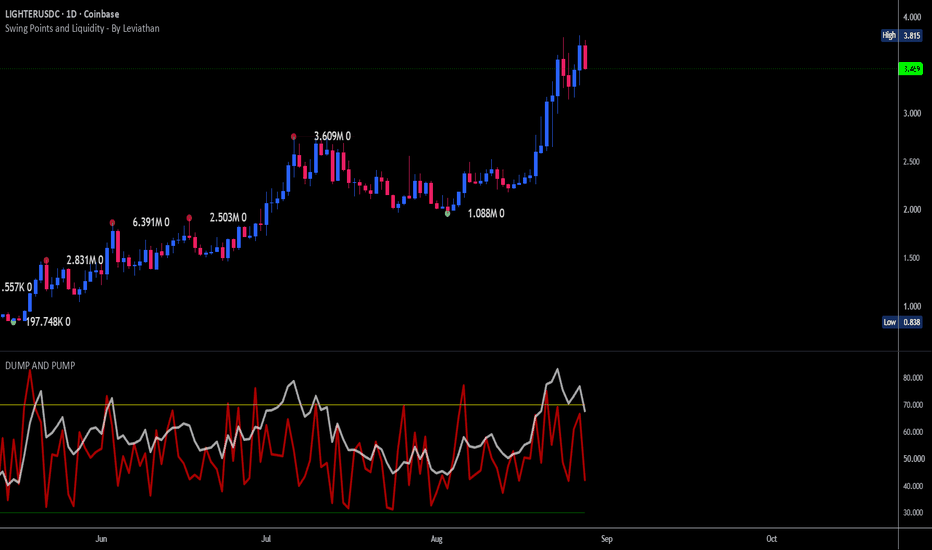
 Long
Long
Solana (SOL): Is the Next Leg Toward $120.52 About to Began?Solana has staged one of the stronger recoveries across large-cap crypto, moving from the low-$70s in early August to around $106.69 on the current 4-hour chart.
The rally has not been purely technical. Institutional demand, tighter tokenomics and expanding access through traditional financial platforms have all strengthened the SOL narrative.
But the chart is now approaching a key decision point:
$110.65.
A sustained break above that level would confirm the higher-move scenario shown in the current Elliott Wave structure, with $120.52 as the chart's next major target.
--
What's Driving Solana?
Several Solana-specific catalysts have reinforced the recent rally.
The most important is the combination of institutional demand and tighter future supply.
U.S. spot Solana ETFs have continued attracting capital. By August 25, cumulative net inflows had reached a record $1.22 billion, following five consecutive sessions of inflows.
That institutional bid has remained notable even as the broader crypto market has become more volatile. On August 28, Solana ETFs reportedly attracted another $17.3 million, while U.S. spot Bitcoin ETFs recorded $201.9 million in outflows.
The second major catalyst is Solana's first binding governance vote. Validators approved a proposal to accelerate SOL's disinflation rate, reducing the pace of new issuance and bringing the network toward its 1.5% terminal inflation rate sooner.
Solana has also been expanding access through traditional finance. Charles Schwab added SOL to its crypto trading platform, giving its clients another regulated route to trade the asset.
Meanwhile, network development continues. Solana has been progressively reducing slot times, with feature gates reaching 350ms on mainnet in August, alongside continued Agave and Firedancer development.
Fundamentals are strengthening the narrative, while the technical structure is now testing whether that narrative can produce another impulsive leg higher.
--
Technical Analysis
The 4-hour chart shows Solana emerging from a prolonged corrective structure that developed through June and July.
After completing the larger corrective sequence around the high-$60s/low-$70s, SOL began forming a new upward structure.
The advance accelerated sharply in the second half of August, taking price from the mid-$70s through the $80–82 resistance zone and into the current five-wave structure.
The chart does not mark a specific hard invalidation level for the current setup, so the analysis should not assign one artificially.
Bullish Scenario
A sustained break above $110.65 would confirm the higher-move scenario shown on the chart.
If that occurs, the next major objective is:
$120.52
This level sits inside the upper resistance/supply zone shown on the chart and represents the next significant target for the current wave structure.
A clean breakout would also strengthen the interpretation that the current wave (4) correction has completed and that the final advancing phase is underway.
Bearish Scenario
The immediate bearish scenario is a failure to clear $110.65, followed by a deeper correction.
A rejection would not automatically invalidate the broader bullish structure. It would simply mean that the chart's confirmation condition has not been met.
The $78–82 region is important because it was the major consolidation and breakout area preceding the latest acceleration. A substantial move back into that region would weaken the current momentum structure and require reassessment.
Kap Waves Outlook
Solana currently has something Bitcoin does not to the same degree: strong asset-specific catalysts supporting the technical structure.
ETF demand remains significant, SOL's supply trajectory is becoming tighter following the governance decision, and access through traditional financial platforms is expanding.
Technically, however, the next move still needs confirmation.
$110.65 is the level to watch.
A sustained break above it would confirm the higher-move scenario and put $120.52 in focus.
Until then, SOL remains in a strong but unconfirmed continuation setup.  Long
Long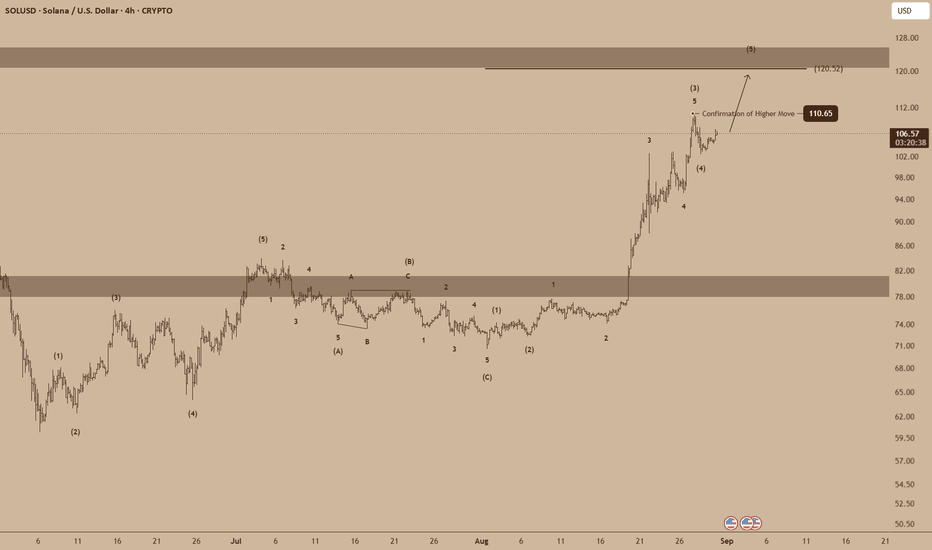
ETH/USDT — 1D: another sell signal at $2,500The VDS signals have historically captured the major reversal points on ETH since 2022.
A new SELL signal has just appeared around $2,500, following a strong move higher from the previous BUY signal near $1,600 .
The timing is interesting. When the market turns extremely bullish and social media is filled with expectations of a new bull market, it may be worth looking at the chart from a purely technical perspective rather than following the crowd.
That said, this is a daily timeframe, so the setup needs time to develop. The SELL signal can disappear and reappear around these levels as the structure continues to form . I wouldn't treat a single daily signal as an immediate call for a major drop.
ETH could also spend some time distributing around the current levels before the larger move develops, as we've seen after previous VDS signals.
For now, I'm watching the technical picture closely.
The main move is still what matters, and VDS is currently pointing to increased downside risk.  Short
Short
Long 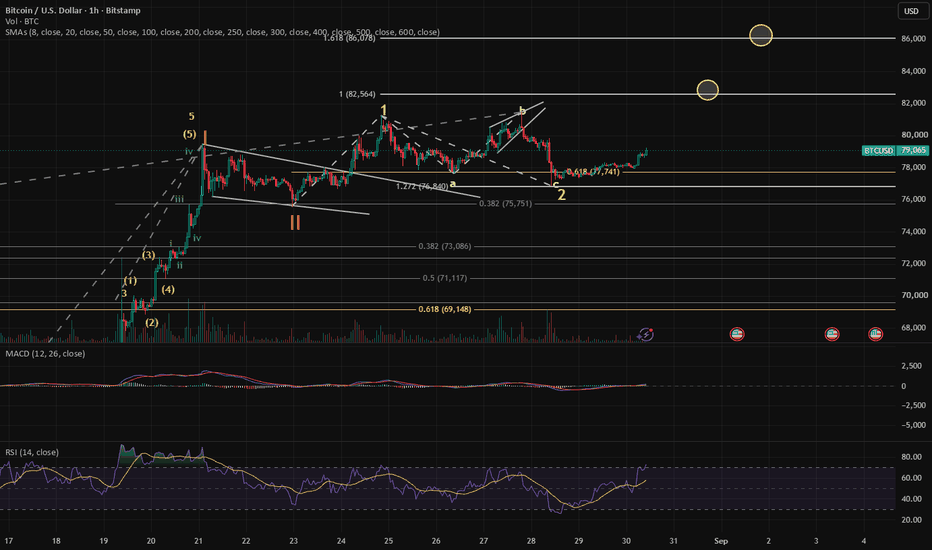
$BTCUSD has reached the target area of Wave 2CRYPTOCAP:BTC has reached 61.8% and slightly exceeded it -- reaching the AB = BC target as well.
If it drops further from here, it'll start to look bearish. If it falls below the starting point of 1 (at 75,568), then the I-II, 1-2 count is wrong. Instead, the most bullish count becomes I-II, that is, we're still in Wave II correction, which can target the 50% retracement zone at 71, 117 or even the 61.8% zone at 69,148.
Long 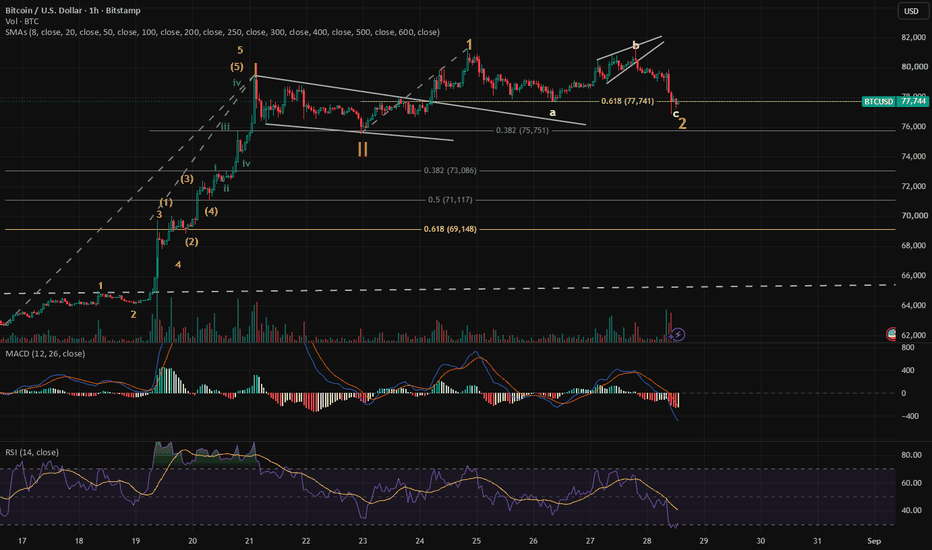
TOTAL Crypto Cap: Bull-Flag-Formation, Setup for Higher Zones!Hello Community,
welcome to my new analysis of the TOTAL cryptocurrency market cap price developments. The very recent uptrend, which brought the price of TOTAL above the $2.65T mark, was a great opportunity to secure solid profits on the long side, trading the various altcoins which moved to the upside simultaneously with TOTAL. Now, I detected the underlying formational structures which will determine the next steps for TOTAL.
When looking at my chart, we can see how TOTAL is forming this major bull-flag formation. Within the formation, TOTAL is already completing the wave count with a main support within the lower boundary of the bull-flag formation. There is strong evidence that TOTAL will bounce within this area and set up the next bullish wave from there on. If the bullish momentum increases after TOTAL has done so, there will be a good potential for the bull-flag to complete.
Once TOTAL bounces above the upper boundary as seen in my chart, this will activate the upper target zones. In this case, it is highly important that the 50-EMA is confirmed as support and that the bullish momentum increases for the upper target zones to be reached sufficiently. A final target zone of $2.9T will be a reasonable target for the bullish wave towards the upside once the bull-flag formation has been completed.
In this manner, thank you a lot for watching!
The support is highly appreciated.
VP BTCUSD — Bullish Trendline Continuation Setup
Bitcoin is showing a short-term bullish structure after breaking above the previous resistance around 78,357–78,446. Price is now pushing higher while respecting the rising trendline.
Bias: 🟢 Bullish
Trade idea:
Entry: 79,000–79,050
Stop Loss: 78,446
TP1: 80,014
TP2: 80,037+
Key support: 78,357–78,446
Major resistance: 80,014
The setup is based on trendline continuation: price broke upward, established support, and is now moving along the ascending structure.
I want to see the bullish structure remain intact. A decisive break below 78,357 would weaken/invalidate the setup.
Break → retest → continuation. 📈
#BTCUSD #BTC #Bitcoin #CryptoTrading #TradingView #PriceAction #TrendlineTrading #TechnicalAnalysis #BitcoinTrading #TradingSetup Long 
 Long
Long
 Long
Long
HNT Surge Triggers Short SqueezeFWB:HNT Celina, Texas—the fastest-growing U.S. city—announced it is powering citywide mobile coverage using the Helium Network, repurposing existing public Wi-Fi at libraries and businesses. This "carrier offload" deployment handles about 100 GB of data daily without new cell towers, showcasing a capital-efficient model for expanding decentralized wireless infrastructure. This is bullish for HNT because it validates Helium's real-world utility and provides a tangible blueprint for municipal adoption. The news directly fueled a near-doubling in price and market value, demonstrating investor appetite for proven DePIN use cases beyond speculation. HNT's price skyrocketed, creating a powerful short squeeze. Data shows HNT's weighted funding rate plunged, indicating extreme bearish positioning in futures markets before the rally forced short liquidations. This event highlights high volatility and leveraged trading risk around HNT. While the squeeze provided explosive upside, the resulting overbought conditions—with a daily RSI —now pose significant downside risk if bullish momentum fades and profit-taking ensues. The Helium community activated HIP-149, establishing a $0.05/GB minimum and $0.30/GB maximum for deployer earnings. This change creates a predictable incentive safety net for operators who provide wireless coverage, and includes a rule to recycle HNT already burned for the same data. This is a neutral-to-bullish development for HNT's long-term economics. It makes operating a hotspot more economically viable, which could encourage network growth and stability. However, it does not directly increase network usage or token demand in the short term. Helium's trajectory is currently defined by a potent mix of verified real-world adoption and volatile, speculation-driven price action. Can the network convert this burst of attention into sustained growth and usage that supports its new tokenomics?  Long
Long
 Long
Long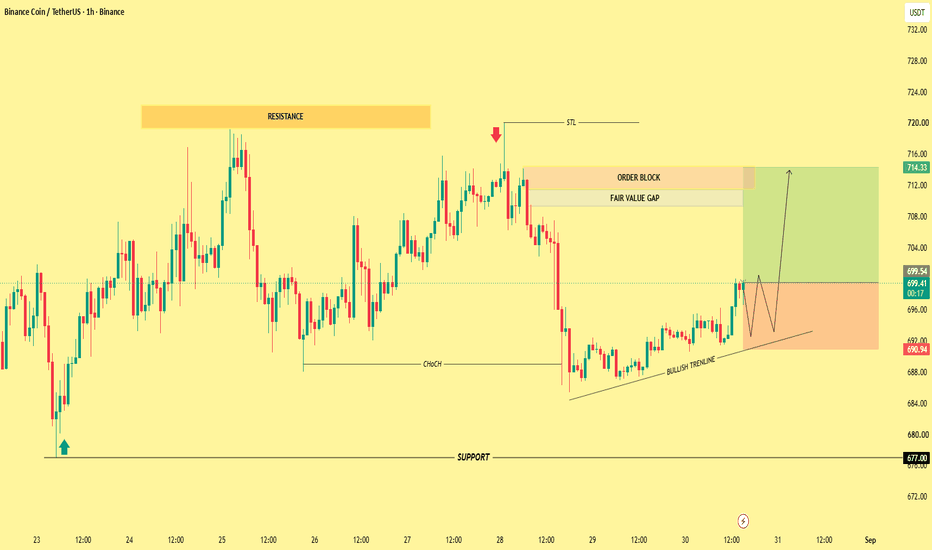
 Long
Long