Short
Short
 Short
Short
BTCUSD: 81.4K Liquidity Sweep + Fresh 4H SELL SignalBTC has swept buy-side liquidity above the previous $81,255 high, reaching approximately $81,455, but buyers were unable to hold the breakout.
The rejection was followed by strong bearish displacement and expanding volume. My Swing Signals & Structure indicator then generated a fresh 4H FAST SELL signal at $77,557 on August 28.
At the time of this update, BTC is trading around $78.2K, so this remains an OPEN setup rather than a completed move.
My primary expectation is a short-term bearish correction.
The first important area is $77.6K–$76.9K. BTC has already reacted around this liquidity zone, but a confirmed 4H break below $76.9K would increase the probability of continuation toward:
$75.6K — structural support
$73.2K — T1
$63.8K — extended T2 if the higher-timeframe structure also breaks
The important resistance area is around $79.5K–$80K.
The bearish setup remains valid while BTC stays below $81,623. A break above that level would invalidate the current 4H SELL structure.
One important point: the 6H structure is still stronger than the 4H. The previous 6H QUALITY BUY appeared around $64,280 and captured the major rally toward $81K.
Because of that, I currently see this as a 4H bearish correction rather than confirmation of a major Bitcoin top.
Bias: BEARISH / CORRECTION
Timeframe: 4H
Invalidation: $81,623
Primary Target: $73,209
#BTC #Bitcoin #BTCUSD #MarketStructure #PriceAction Short 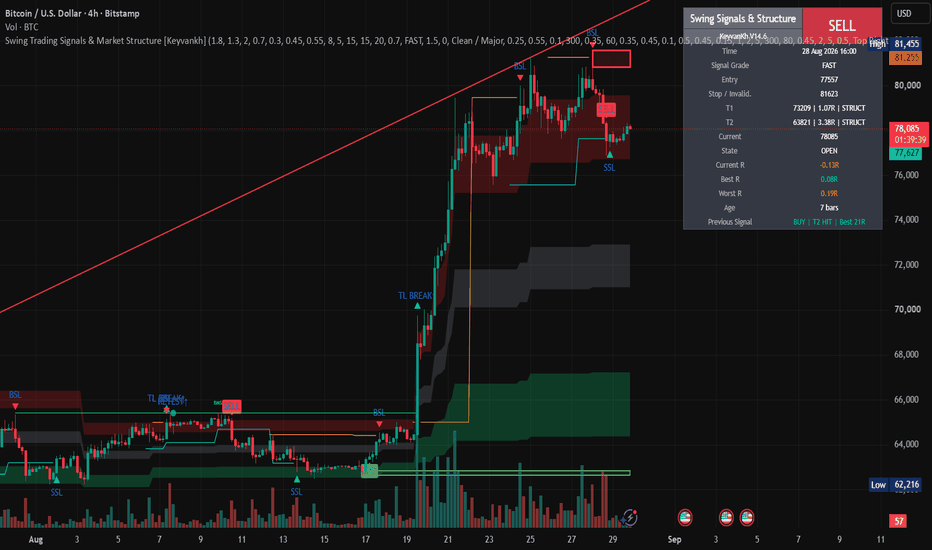
Education 
 Long
Long
PROS/USDC Breakout Analysis: Pre-Pump Signals & Key LevelsHello, Traders! 👋
Today we are taking a technical look at PROS/USDC on the Coinbase Advanced Spot exchange.
Current Market Context (Snapshot at 11:09 GMT+2):
Price: 0.4100 USDC
24h Change: -1.44%
Day's Range: 0.4083 – 0.4206 USDC
Volume (24h): ~$158,575
Technical Setup & Key Levels:
Based on recent price action and volume analysis, we are monitoring a potential volatility expansion.
Entry Consideration: Monitoring reactions around the 0.4128 USDC level.
Primary Target (Take-Profit): 0.4289 USDC (+3.90%).
What the Indicators Suggest:
As per the data, the overall technical summary is currently Neutral. However, the short-term momentum is showing signs of a potential breakout:
Volume Profile: A significant volume spike is present, alongside a bullish skew.
Imbalance: Currently at +22.1%, suggesting strong buying pressure at current levels.
Market Sentiment:
While the 24-hour change is slightly negative (-0.3% for the day, -1.44% for the session), the volume and order flow suggest a potential shift in momentum.
What are your thoughts on PROS? Do you see a continuation, or is this a trap? Let me know in the comments below.  Long
Long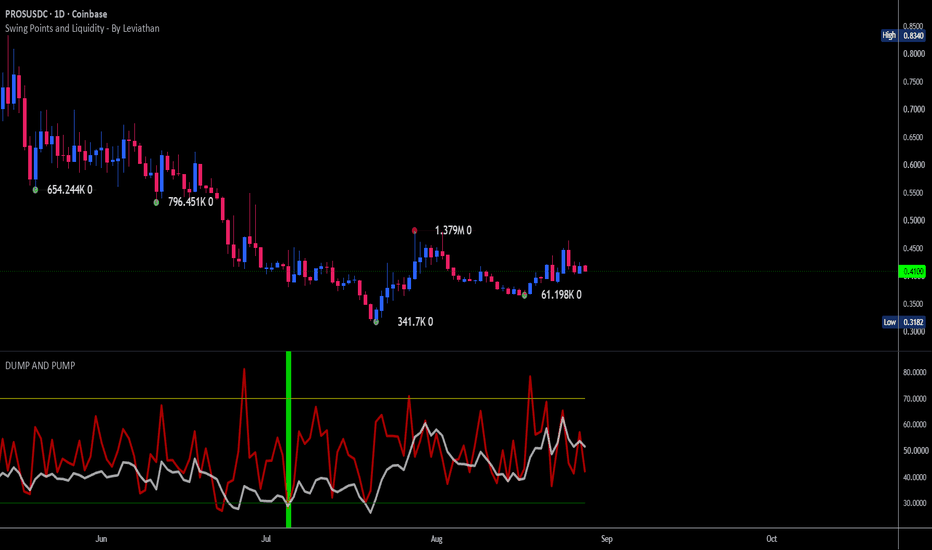
BTC — Short → Pullback → Long Scenario Multi-Timeframe AnalysisMy Daily chart remains one of the main starting points for determining my higher-timeframe bias.
After approximately 46 days of consolidation, BTC finally broke out of the range with strong bullish expansion.
The breakout clearly favored the bulls and showed a meaningful shift in momentum.
What followed was interesting.
After the initial expansion, we had approximately six days of strong interaction between buyers and sellers, and the current weekly candle is now developing into something close to a Doji / indecision candle following the previous bullish week.
However, today is only August 29, 2026, and the weekly candle has not closed yet.
There is still time left, and anything can happen before the close.
My Bearish / Pullback Scenario
If BTC fails to maintain its bullish momentum, begins consolidating and starts showing signs of weakness, I’ll become interested in a potential retracement of the recent expansion.
This would potentially give me the second opportunity I didn’t get during the initial bullish move.
I’ll admit that I felt some FOMO when BTC originally expanded without giving me the entry I wanted.
But I’m much happier that I didn’t chase the move or enter without confirmation.
If weakness develops next week especially with the monthly close approaching and price begins moving lower to rebalance some of the inefficient price action left behind,
I’ll move to the lower timeframes and look for a possible short opportunity only after confirmation.
No confirmation = no short.
Where Does the Long Become Interesting Again?
If a deeper retracement develops, my main area of interest sits around the 62%–79% Fibonacci / OTE retracement zone of the Daily bullish expansion.
That does NOT mean I will automatically buy when price reaches the zone.
The OTE is simply my higher-timeframe Point of Interest.
Once price reaches that area, I want to see evidence that buyers are regaining control on the lower timeframes before considering a long.
My ideal sequence would therefore be:
HTF weakness → LTF Short Confirmation → Retracement / Rebalancing → Daily 62–79% OTE → LTF Bullish Confirmation → Potential Long Continuation
There is also another possibility:
BTC may simply continue higher without giving me any of this.
And that’s completely fine.
I’m not trying to predict the exact path of Bitcoin.
I’m preparing scenarios and waiting for my system to tell me when I actually have a trade.
No trigger → No trade.
No confirmation → No entry.
No chasing.
These are my personal market observations and trading journal only. Not financial advice and not educational content.
I’m simply sharing my journey as I learn, improve, and work toward managing my own portfolio for a living.
Ethereum | Impulse or a Larger Correction?The daily ETH/USD structure is now at a critical decision point. Previous analyses suggested that the correction would gain greater credibility as complete only if the market subsequently revealed a clear impulsive character.
🟢 Bullish Case
From the bullish perspective, the current structure could mark the completion of a Running Flat, with the market now at the beginning of a new directional move.
However, price growth alone is not enough to confirm this idea. The upward move should develop as a five-wave impulse, or at lower degrees, begin forming nested 1–2 structures. Such behavior would suggest that the market is building the foundation for a larger third wave.
Along this path, we would expect advances to display an impulsive character, while corrections remain more limited and clearly corrective relative to the upward moves.
⚫ Bearish / Corrective Case
On the other hand, if the upward movement fails to develop an impulsive character and advances continue to unfold in three waves, the larger corrective structure may still be developing.
In that case, the market could continue forming one or more corrective structures such as a Zigzag, Flat, or Double Three. Therefore, the declines must also be evaluated structurally to determine whether the market is simply extending the correction or gradually transitioning into a larger bearish phase.
Where Are We Now?
We are now at a point where the market needs to reveal the character of its next move:
A five-wave advance or nested impulsive 1–2 structures → strengthens the Bullish Case.
Three-wave corrective advances combined with continued bearish structure → strengthens the Bearish / Corrective Case.
The weekly chart provides the roadmap for the larger structure, but the daily chart will show which path the market is actually choosing.
📌 If the full logic behind these scenarios is not yet clear, take a look at the previous analyses attached to this idea. This analysis is a continuation of that same structural path.
yesterday
Ethereum: Bullish Impulse or Larger Correction?
Price is the result. Structure is the cause.
— Mr. Nobody | Elliott Wave Principle
Ethereum
Jul 12
Is Wave C Complete, or Is the Correction Still Unfolding?
 Long
Long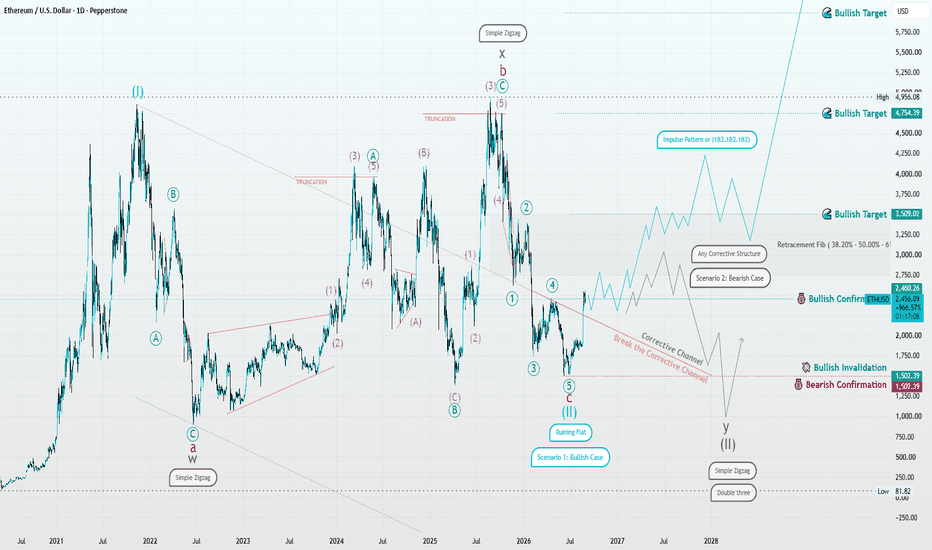
ZEC 1D – Triangle Breakout Pulling Back Into Prior ResistanceZEC on the 1D timeframe is currently trading around 833.17 after all targets from the prior symmetrical triangle breakout idea were reached, with price spiking from the upper trendline near 645–660 all the way to a new all-time high near 900 before pulling back into the 780–833 zone, which now sits as the first meaningful support following the breakout extension.
The prior idea identified the nine-month symmetrical triangle and the breakout above the descending upper trendline near 645–660 as the key structural development. Price confirmed that breakout fully, reaching the high near 900 and setting a new all-time high before sellers pushed price back into the current consolidation. The broken descending upper trendline near 645–660 remains the macro support floor on any deeper pullback, while the horizontal level near 780–800 has emerged as the first reference within the current consolidation zone. The rising lower trendline from the February low continues to climb into the 325–365 area and sits far below as the macro structural anchor. Two horizontal reference levels now define the post-breakout range, one near 780–800 as the current floor and a second near 900 as the ceiling from the all-time high wick.
Price reached all targets set in the prior idea and is now in a post-breakout consolidation phase, with the key question being whether 780–800 holds as the new support base or whether the pullback extends toward the broken trendline near 645–660.
Key Levels To Watch
→ 900–920 All-time high region, major resistance above
→ 833–850 Current price zone, minor resistance
→ 780–800 Horizontal support, post-breakout floor
→ 720–740 Secondary support, prior breakout consolidation
→ 645–660 Broken descending upper trendline, macro support
→ 535–595 Prior resistance zone, deeper support
→ 325–365 Rising lower trendline, macro structural floor (dynamic)
A hold above 780–800 and a recovery back toward 833–850 would keep the post-breakout consolidation structure intact and reopen a move toward the all-time high region near 900–920 and potentially above on continuation.
A loss of 780–800 and a pullback toward 720–740 would extend the post-breakout correction, and a confirmed daily close below the broken descending trendline near 645–660 would be the first sign the breakout is failing, reopening the risk of a full retrace toward 535–595.
All prior targets hit, price consolidating below all-time high. Hold 780–800 → consolidation healthy, eyes on 900–920. Lose 780 → correction extending, broken trendline near 645–660 the key macro level. Bias bullish above broken trendline. Shift only on confirmed close below 645–660. USDT.D - Predictive Modeling Tether dominance is the most important chart to be watching for what happens next with crypto. I am going to lay out both the bullish and bearish scenario, as USDT.D is currently forming the perfect market structure for a violent move in either direction.
In this idea I will focus on the bullish scenario for USDT dominance, which would actually be extremely bearish for the crypto market as a whole.
To begin, review my last idea on USDT.D:
This scenario I am about to lay out aligns with the one outlined above. The main thing to watch for is USDT.D starting to close daily candles back above the parallel channel. If dominance accomplishes that, it could be seen as a false reclaim, and dominance would likely start using the top of the parallel channel as support to push back to the upside toward 8.25%. This would cause a crypto crash.
However, if candles continue closing below the parallel channel, as they are doing right now, my bearish scenario applies instead, which can be found here:
Now that this is understood, let's examine the bullish scenario for USDT. Right now, there appears to be a double bottom forming on the weekly line chart right around 7%. The line chart only accounts for candle body closes, so it will be very important to see where this closes with tomorrow's weekly candle.
If this double bottom does hold, and USDT.D starts breaking back above the parallel channel with multiple daily closes, I will provide a projection on what dominance is likely to do next.
The Predictive Head and Shoulders Pattern
My prediction is that a Head and Shoulders pattern would form, which would ultimately be the structure that kicks off the next bull market for crypto. If this were to occur, here is how it would look.
The left shoulder formed in March 2026, when dominance closed at 8.18%. The head then formed in June 2026, when dominance reached over 9%.
If the double bottom does print tomorrow, it would be establishing the neckline of the parallel channel around 7%. From there, USDT.D would likely rally back toward the 8.25% level which is a key future level I have been outlining ever since this idea:
It would then likely close somewhere around the 8.18% level on the weekly timeframe, creating the right shoulder of this predictive Head and Shoulders pattern.
Once the right shoulder is formed and dominance begins to drop again, it would revisit the neckline around 7%. Once that neckline is broken, it would kick off the true start of the crypto bull market. The measured move breakdown of this pattern would put USDT.D back around 5.3%.
One last thing worth noting is the weekly RSI. Since March 2024, USDT.D's weekly RSI has been in a steady uptrend, marked by the green circles. However, with the recent breakout for the crypto markets, that trendline has now been broken to the downside, marked by the red circle. That same weekly RSI trendline is now likely to act as a ceiling for momentum going forward.
Based on this, my projection is that if this scenario plays out, USDT.D will rise toward 8.25% while the RSI simultaneously rises back toward that trendline. Then, as USDT.D gets rejected around 8.18% to form the right shoulder, the RSI should be getting rejected from that same weekly trendline at the same time. From there, momentum would begin falling back toward oversold conditions, and the crypto bull market would begin.
Short 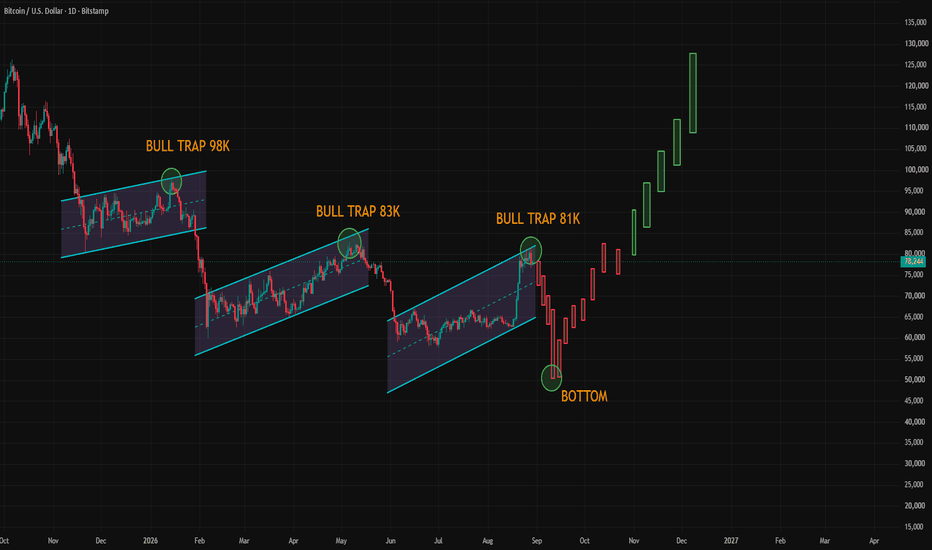
 Long
Long
USDT.D - More Cash to be Deployed?Tether dominance is the most important chart to be watching for what happens next with crypto. I am going to lay out both the bullish and bearish scenario, as USDT.D is currently forming the perfect market structure for a violent move in either direction.
In this idea I will start by focusing on the bearish scenario for USDT dominance, which would actually be extremely bullish for the crypto market as a whole.
To begin, review my last idea on USDT.D:
In that idea I was predicting profit taking would begin and the uptrend for crypto would start to stall. That is exactly what happened. However, now that more market structure has built, it may not be as simple as it first appeared. I was expecting daily candles to start closing above the parallel channel and use it as support. Instead, they have been closing below the top of the channel.
Why This Matters
This is crucial to understand, as it currently represents a reclaim of the channel rather than a retest of the breakout. This could signal that more cash (USDT) is about to be deployed back into the market, pushing cryptocurrencies across the board to the upside and pushing USDT.D back toward the heartline, or even the lower band of the parallel channel.
Depending on when this occurs, that could put USDT.D dominance around 6.45%, or even around 5.9% if dominance were to reach the bottom of the channel once again. That much cash being injected back into the market would help fulfill the scenario I outlined for BTC here:
Also be watching the daily RSI. USDT.D is currently still in oversold conditions and trying to bounce off the 30 level to the downside. If USDT.D is rejected from this 30 level if will lead Tether dominance strongly to the downside and USDT will start being deployed rapidly back into the crypto market.
A Word of Caution
It is still too early to say for certain, as there is a bullish pattern for USDT that could also play out on the weekly timeframe, which I will be outlining in a follow up idea.
For now, the current structure makes this the most likely scenario to play out. However, if you see USDT.D start closing multiple daily candles back above the parallel channel, this idea is negated, and the bullish scenario I am about to lay out next would be the one in play instead. Bitlayer Surges as Altcoins Rally On August 27, Bitlayer AMEX:BTR skyrocketed, leading a broader altcoin surge while Bitcoin traded flat. The rally was fueled by a staggering 24-hour volume, indicating intense speculative interest, particularly on Korean exchanges like Bithumb. However, the overall crypto market's trading volume fell, suggesting the recovery lacked broad-based participation. This is bullish for BTR in the short term because it demonstrates powerful momentum and high trader conviction. However, it is also a cautionary signal because such parabolic moves on thin overall market depth can reverse sharply if buying pressure subsides, especially with the token's noted high whale concentration. An analysis from NullTX examined Bitlayer's volatile 2026 trajectory. The bull case targets higher within six months, driven by the upcoming Bitcoin Rollup V2 (promising sub-second finality) and expanded cross-chain liquidity for its YBTC asset. The bear case warns of a pullback due to Phase 2 airdrop unlocks and profit-taking. This presents a neutral-to-bullish outlook for BTR, as it highlights concrete technological catalysts that could drive adoption and price appreciation. The significant bearish risk stems from inflationary token supply entering the market, which could overwhelm demand if network growth doesn't accelerate proportionally. In a news cycle dominated by US-Canada trade tensions and macroeconomic commentary from figures like Arthur Hayes, Bitlayer's price rally was called out as a notable market event. The article noted BTR's move was based on "speculative activity," distinguishing it from the muted reaction of major cryptocurrencies to the geopolitical developments. This is neutral for BTR, as it underscores that the coin's recent performance is driven more by internal crypto market dynamics and trader rotation than external macro news. It positions BTR as a high-beta play within the Bitcoin Layer 2 narrative, whose price action can decouple from broader headlines. Bitlayer's narrative is currently split between its explosive, liquidity-driven breakout and the longer-term promise of its technical roadmap. The key question is whether upcoming network upgrades and staking can absorb token supply and solidify these gains, or if this is a classic pump primed for a steep correction. Long 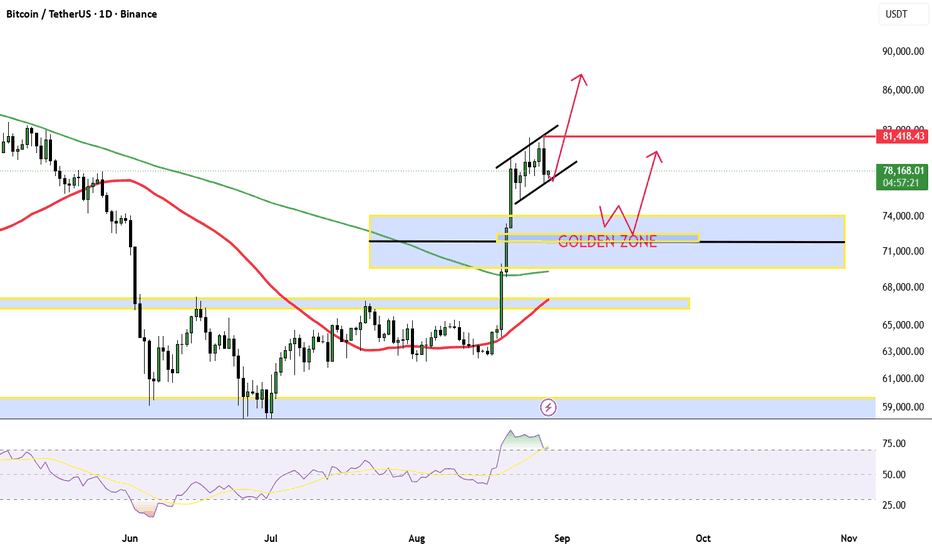
BEAT Major Token Unlock LoomsAudiera is scheduled to unlock 21.25 million NASDAQ:BEAT tokens (6.87% of circulating supply) on 1 August 2026, worth approximately $67.8 million. This event, part of a vesting schedule, will increase tradable supply by about 7% of the current market cap. Notably, the upcoming unlock is 26.7 times larger than the project's latest weekly token burn. A CoinGecko poll showed 60% bearish sentiment ahead of the event. This is bearish for BEAT in the near term because it introduces significant sell-side pressure. The market must absorb new supply, and if recipients sell immediately, it could overwhelm current demand, especially given the unlock's size relative to daily trading volume. On 28 July 2026, BEAT was the biggest loser among top 100 altcoins, plummeting 25% to $2.74. This drop occurred within a broader market downturn where Bitcoin was rejected at the $67,000 resistance level, falling to $63,000 and triggering approximately $700 million in liquidations. The total crypto market cap lost $80 billion in one day. This is bearish for BEAT as it shows high correlation to Bitcoin's momentum and extreme sensitivity to market-wide risk-off moves. The sharp decline indicates leveraged positions were unwound, and the token lacks independent bullish catalysts to decouple from the broader sell-off. As of 28 July 2026, BEAT trades at $2.80, sitting on a key rising trendline in the $2.50–$2.80 zone. Technical analysis suggests a 45% chance of consolidation between $2.20 and $3.02. However, on-chain data reveals extreme concentration, with the top 100 wallets holding 98.85% of the supply, making price action vulnerable to large-holder decisions. This presents a neutral to bearish near-term outlook. While the trendline has provided historical support, the overwhelming whale dominance means any coordinated selling could easily break this level, leading to a deeper correction irrespective of technical patterns. BEAT's trajectory is currently dominated by imminent supply inflation from its token unlock and its high-beta reaction to Bitcoin's weakness. The key question is whether the project's deflationary burn mechanism can eventually offset this supply pressure once the unlock selling is absorbed.  Long
Long
Short 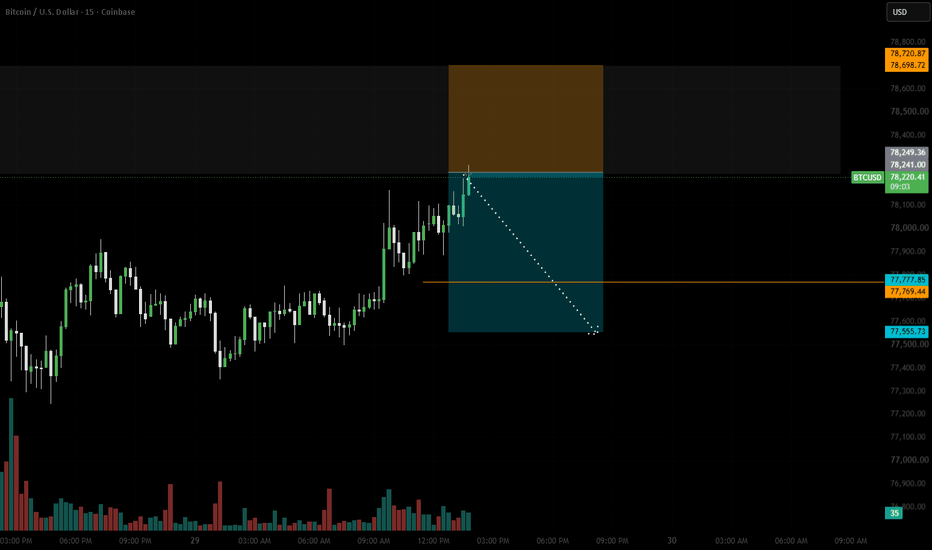
Bitcoin – Possible Bearish ScenarioBTC is currently trading around $78,000 after a strong recovery from the recent lows. However, the price structure still shows signs of weakness after the previous major high.
The red line represents my personal projected price path, not a confirmed market movement. In this scenario, Bitcoin could face resistance around the $80K–$85K area, form another lower high, and then move toward the $63K–$65K support zone.
If this support fails, the next major levels I’m watching are around $55K and potentially $41.5K.
The RSI is recovering, but momentum is not yet strong enough to confirm a full bullish reversal. For now, I’m watching how BTC reacts at the key resistance and support levels.
This is my personal technical analysis, not financial advice. Short 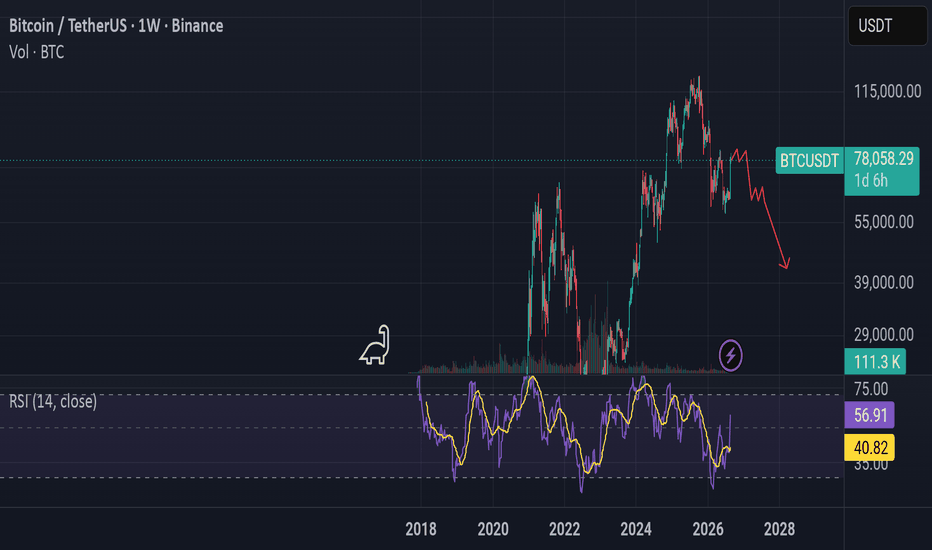
$ETHCRYPTOCAP:ETH — Global Settlement Thesis
As trade restrictions, sanctions, and global liquidity pressures increase, the demand for faster and cheaper ways to move capital may continue growing.
Ethereum could benefit from this shift because stablecoins like CRYPTOCAP:USDC allow dollar-denominated value to move across blockchain networks with relatively low settlement friction.
Instead of relying only on traditional banking rails or selling physical reserve assets such as gold to raise dollar liquidity, institutions and countries may increasingly explore regulated digital-dollar infrastructure where legally permitted.
If stablecoin usage and blockchain settlement continue expanding, CRYPTOCAP:ETH could benefit from higher network activity, demand for blockspace, staking, and collateral use.
The key risk is competition: stablecoins can move across multiple networks, so Ethereum must continue capturing meaningful settlement activity for this thesis to strengthen.
Educational macro thesis, not financial advice.
BTC: Daily Momentum Cooling While 1H Range TightensPrice
BTC is trading near 77,900 after a choppy, range-bound week following the rally from roughly 64,000 to a high near 81,000 earlier this week.
Volume Sentiment
On the 1H chart, both the raw and Heikin-Ashi layers have narrowed and are sitting close to zero, showing no clear bias either way. On the daily chart, both layers remain in FOMO territory but are curving down, with the raw layer approaching its own threshold.
MACD
On the 1H chart, MACD crossed positive around 10-11 candles ago, and the histogram remains positive but is easing. On the daily chart, the signal line and histogram have both been declining.
Bollinger Bands
On the 1H chart, the bands have narrowed, with price sitting at the upper edge for the last 3-4 candles. On the daily chart, price touched the upper band 4 candles ago and has been moving sideways since.
Across both timeframes, several signals are pointing the same direction at the same time — daily MACD and volume sentiment easing off after last week's push, while the 1H chart shows a narrowing range sitting right at its upper edge. This kind of alignment across timeframes is worth watching, without assuming where price goes from here.
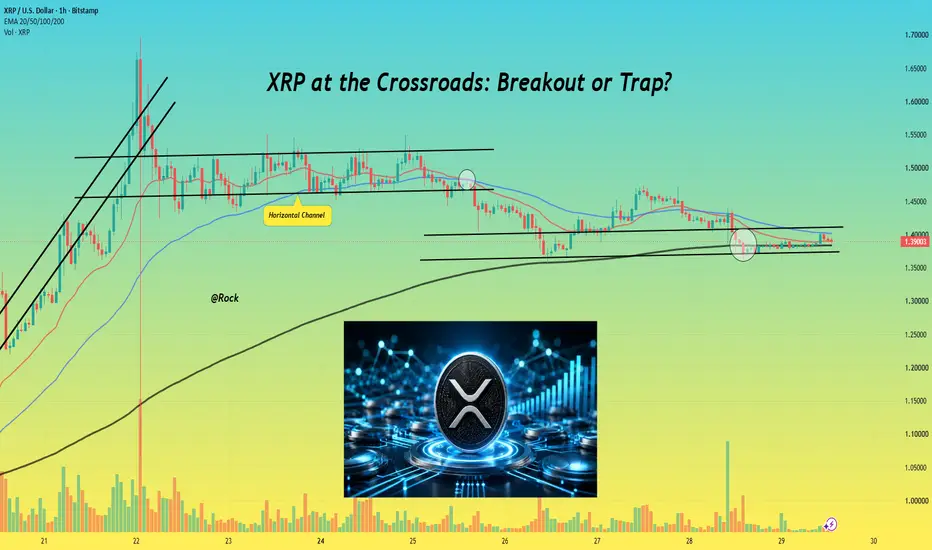
Not financial advice — just sharing what the data is showing right now. XRP at the Crossroads: Breakout or Trap?🚀 Hey! Hope everyone is doing well, here with a quick beyond, technical analysis here on price action, I'll keep this idea short and quick, make the most of today and enjoy the weekend!
🪙 Current Snapshot: XRP trades around $1.39 today, navigating volatile 24 hours with $1.76 billion trading volume.
📈 Macro Trend: Price recovered from $1.00 psych floor to recent peak near $1.70. Slight pullback feels like healthy profit-taking instead of structural breakdown.
🟢 Immediate Support: Key line in sand sits at $1.40 to $1.36 zone. Holding this level keeps bullish recovery structure intact.
🔴 Key Resistance: Heavy sell walls and whale distribution block path between $1.45 and $1.51. Daily candle close above $1.51 triggers next leg toward $1.60+.
📊 Technical Indicators: Moving averages lean toward buy sentiment, but 14-day RSI cooled into neutral territory around 41 to 46. Asset sits neither overbought nor oversold, leaving room for big move.
⚠️ Derivatives & Leverage: Watch out for leverage squeeze. Recent derivative selling pressure on major exchanges flushed out weak-hand long positions.
💡 Institutional Tailwinds: Narrative stays strong with massive spot product inflows hitting $1.66 billion recently. Rumors suggest traditional brokers expand custody options.
⚖️ Statutory Commodity Classification: Proposed CLARITY Act classifies XRP as digital commodity under CFTC oversight. Passing solidifies court victory and removes lingering regulatory ambiguity for conservative capital.
🏛️ September 15 Cloture Vote: Markets watch Washington for upcoming Senate cloture vote. Polymarket odds anchor advancement chance at 20% to 24%, meaning delay is largely priced in.
🚀 Best-Case Scenario ($2.00+): Passing bill triggers massive institutional supply squeeze. Successful vote shatters local resistance and rockets price toward $2.00 mark by late September.
📉 Stalling Risk ($1.00 Fallback): Failure or delay past midterms dents market confidence. Without legislative backing, asset relies on judicial precedents and risks breaking down to $1.00 support level.
🏦 Banking Unlock: Passing vote gives traditional banks concrete legal framework to hold and settle transactions. Financial networks can confidently scale on-chain cross-border settlements using XRP Ledger. This basically gives XRP a much firmer, secure position/ability to scale up it's utility and influence to real institutions with real support and again, framework.
Have to go but really appreciate everyone for joining me as always, may this find you well and let's keep fighting for the future we deserve.
Best regards,
~ Rock '