GDX: Long-Term Bullish - Early Entry at Fibonacci SupportOn the weekly chart, GDX appears to have found support within a major Fibonacci retracement zone following the correction from the January high.
Current setup:
The recent low reacted near the 0.50 retracement of the broader bullish impulse.
Price has broken the shorter-term bearish trendline, providing an early bullish signal.
GDX is now testing resistance around $93, roughly the 0.50 retracement of the January-to-August decline.
The larger support zone remains approximately $85.27–$65.46, with $80.17 representing the level I am using as the key secondary/add entry.
This is an early entry , not yet a fully confirmed breakout. I would like to see GDX establish a higher swing low and break the red dotted resistance line before considering the longer-term bullish structure confirmed.
If price pulls back and holds around $80.17, I view that as the better risk/reward location to add with higher conviction.
A retest of the larger descending trendline or the fibs would materially strengthen the setup and could open the path toward the major long term Fibonacci targets at approximately $113.04, $136.93, and ultimately $154.80.
Risk: A failure of the current breakout followed by a loss of $80.17 would weaken the near-term setup and increase the probability of a deeper retracement into the larger Fibonacci support zone.
A loss of the 100-week EMA and the recent July low near $70 would be substantially more concerning. A subsequent break of the major long-term Fibonacci support around $65 would represent a serious deterioration of the long-term technical structure. Below there, the next major support I am watching is around $56, where the June 2025 price structure converges with the rising 200-week EMA.
Macro risk remains important. A renewed rise in real yields, a stronger dollar, higher oil/inflation expectations, or a reversal of the recent yen/intervention dynamics could pressure gold and miners and invalidate the timing of the trade even if the longer-term thesis remains intact.
Bias: Long-term bullish. Short-term cautiously bullish. This is an early-entry setup awaiting confirmation.confirmation.  Long
Long
 Long
Long
Research 10.08.2026🌏 Markets:
AMEX:SPY +0.28 0.04%(pre/m)
NASDAQ:QQQ +0.89 0.12%(pre/m)
🆕 Economic News:
The US corporate earnings season is continuing.
📈 Gap Ups
Reaction to earnings/guidance:
NASDAQ:NESR NASDAQ:AAON NASDAQ:PLUG NYSE:SDRL NASDAQ:CECO NYSE:EMBJ NASDAQ:RDNT NASDAQ:CAMT NASDAQ:AXSM NASDAQ:BTDR NYSE:INSW NYSE:FERG SET:CRC
Other news:
NYSE:TDY Teledyne is acquiring NASDAQ:VREX Varex Imaging for $1.1 billion.
NASDAQ:ABCL Announces Positive Top-Line Phase 2 Clinical Trial Results for ABCL635, Demonstrating Significant Reduction in Frequency and Severity of Vasomotor Symptoms and a Favorable Tolerability Profile
The optical manufacturer continues its rally : NASDAQ:AAOI NASDAQ:LITE NYSE:COHR
NASDAQ:SPCX Stock Jumps Again After Lock-Up Rally, retail investors turn sellers for first time since IPO.
NASDAQ:MRNA : FDA approved its mFLUSIVA for adults 50+—Phase 3 showed 26.6% higher efficacy versus standard vaccine
NASDAQ:META CEO Mark Zuckerberg called for lower U.S. barriers for open-source AI models to compete with Chinese rivals, Meta launches new AI model.
Apple NASDAQ:AAPL says Mac users in China can connect to Alibaba's NYSE:BABA Qwen AI service
📉 Gap Downs
Reaction to earnings/guidance:
NASDAQ:MNDY $B NASDAQ:SGRY NASDAQ:LIF
Other news:
Jefferies downgraded Apple NASDAQ:AAPL to Underperform from Hold.
-- Amid a severe shortage of AI chips, Apple has started testing chips from Chinese manufacturer CXMT — WSJ.
NASDAQ:INTC Announces Proposed $15 Billion Common Stock Offering.
NYSE:NET Announces Proposed Private Offering of $2.175 Billion of Convertible Senior Notes
NASDAQ:SIMO offering of $800mln.
‼️ Additional
NYSE:GME GameStop raised its bid for eBay NASDAQ:EBAY to $56 billion. At this point, GameStop owns nearly 10% of eBay shares and is seeking to acquire the entire company.
The US Q2 2026 earnings season continues.
-- Among the companies that have already reported, 76% have beaten revenue expectations, above the 5-year average of 70% and the 10-year average of 68%.
-- 86% have beaten EPS expectations, above the 5-year average of 78% and the 10-year average of 76%. -- FactSet
JPMorgan raised its year-end 2026 target for the S&P 500 to 8,000 from 7,800.
📋 List of tickers involved:
NASDAQ:NESR NASDAQ:AAON NASDAQ:PLUG NYSE:SDRL NASDAQ:CECO NYSE:EMBJ NASDAQ:RDNT NASDAQ:CAMT NASDAQ:AXSM NASDAQ:BTDR NYSE:INSW NYSE:FERG SET:CRC NYSE:TDY NASDAQ:VREX NASDAQ:ABCL NASDAQ:AAOI NASDAQ:LITE NYSE:COHR NASDAQ:SPCX NASDAQ:MRNA NASDAQ:META NASDAQ:AAPL NYSE:BABA NASDAQ:MNDY $B NASDAQ:SGRY NASDAQ:LIF NASDAQ:INTC NYSE:NET NASDAQ:SIMO NYSE:GME NASDAQ:EBAY
Best regards – hi2morrow team.
SPY Aug 10: 775 Wall, 770 Trap Door
SPY is sitting in a spot where I think the 15m matters more than the headline direction.
The 1H trend is still constructive. We had the run from the 730s into the mid 770s, then a controlled pullback, and buyers stepped back in around 768–770. Price is now back near 773–774, so bulls haven't really lost the larger structure.
But I don't see this as a clean breakout yet.
For me, 775 is the level that needs to move.
The 15m is showing a tighter picture. SPY recovered from roughly 770.9 and is now grinding back toward the top of the recent range. RSI is around 62, which is healthy enough for continuation and not stretched.
What I like is that buyers are still holding the higher lows.
What I don't like is that price is pushing into resistance while GEX is sitting positive.
That can make the first breakout look stronger than it actually is.
The dealer map is pretty clean here.
775 has the strongest nearby upside positioning.
Above that I have 776–777.
Underneath, 770 is the big pivot, followed by 769, 768 and then 765.
With positive GEX, my expectation is more controlled movement unless SPY can force its way through the upper strikes. Dealers can dampen volatility around these levels, so I wouldn't be surprised to see SPY spend time rotating between 770 and 775.
That's the range I'm starting with.
If SPY pushes into 775 and immediately rejects, I'm not chasing calls. That could easily rotate back toward 773, then 772.
But if the 15m starts closing above 775 and the pullback holds it, that's different.
Then I'm looking at:
776 - 777
and potentially a larger continuation if 777 starts accepting.
The downside is also pretty straightforward.
As long as 770 holds, I still give bulls the benefit of the doubt.
Lose 770 and fail to reclaim it, and the intraday character changes for me.
Then I'm watching:
769
768
and eventually 765 if selling starts expanding.
I think one of the easier traps tomorrow could be buying a fast move through 774–775 without waiting for confirmation.
That area has everything needed for a fake breakout: nearby resistance, positive gamma and traders already expecting continuation.
So my setup is less about predicting green or red at the open and more about seeing which side of 770–775 dealers are forced to defend.
My map:
Above 775 and holding: 776–777
773–775: decision / possible pin area
770–773: still constructive, but range behavior
Below 770: 769–768
Below 768: 765 starts becoming realistic
The 1H still favors the bulls.
The 15m says momentum is rebuilding.
The GEX map says don't underestimate 775.
For the daily trade, I want the 15m to confirm the move. A wick through 775 doesn't mean much to me. Acceptance above it does.
Right now, 775 is the wall. 770 is the line bulls don't want to lose.
Long 
Weekly Bias — 10 AugustThe setup into this week is still bullish, but CPI/PPI now create the first meaningful test of whether last week’s rally was a durable rates-driven reversal or simply a relief move after the weak jobs/inflation sequence
CPI is Wednesday, 12 August at 8:30 EST; PPI is Thursday, 13 August at 8:30 EST
Last month’s CPI was exceptionally soft → headline CPI fell -0.4% MoM versus -0.1% expected, while core CPI was 0.0% MoM versus roughly +0.2% expected
Headline YoY dropped to 3.5% & core to 2.6%
The softness was heavily energy-driven, but shelter was also only +0.1% & core services excluding energy were flat
This matters because the hurdle for another bullish inflation surprise has moved lower
The published consensus currently clusters around Headline MoM 0% to +0.1%, Core MoM +0.2%, Headline YoY 3.3%–3.4% & Core YoY 2.4%–2.5%
The Cleveland Fed is even softer on headline inflation
The prediction-market distribution is particularly interesting
Kalshi currently makes +0.1% headline the modal outcome at roughly 36%, with 0% close behind around 33%; for core YoY, 2.5% has the highest probability, followed by 2.4%
I'd define the actual market “whisper” as approximately Headline +0.1/Core +0.2%/3.3%–3.45 YoY/Core 2.5%
A print merely matching +0.1%/+0.2% is probably not enough for another explosive upside move by itself
The market has already moved toward that outcome
June PPI was similarly weak → headline fell -0.3%, while the narrower BLS measure excluding food, energy & trade rose just +0.1%
Energy goods fell sharply, including gasoline
Current published consensus is approximately +0.1% headline PPI & +0.2% core PPI, with headline YoY expected to fall toward roughly 5% from 5.5%
My working whisper is PPI headline 0% to +0.1%, Core PPI +0.1% to +0.2% & PPI YoY ~5%–5.2%
I'd put less weight on PPI than CPI unless PPI produces a large upside surprise
Wednesday can establish direction & Thursday either confirm or invalidate it
The most likely outcome, roughly 45%, is CPI around +0.1% headline/+0.2% core, followed by similarly contained PPI, which is benign enough to preserve the post-NFP narrative without giving the market a huge new dovish catalyst
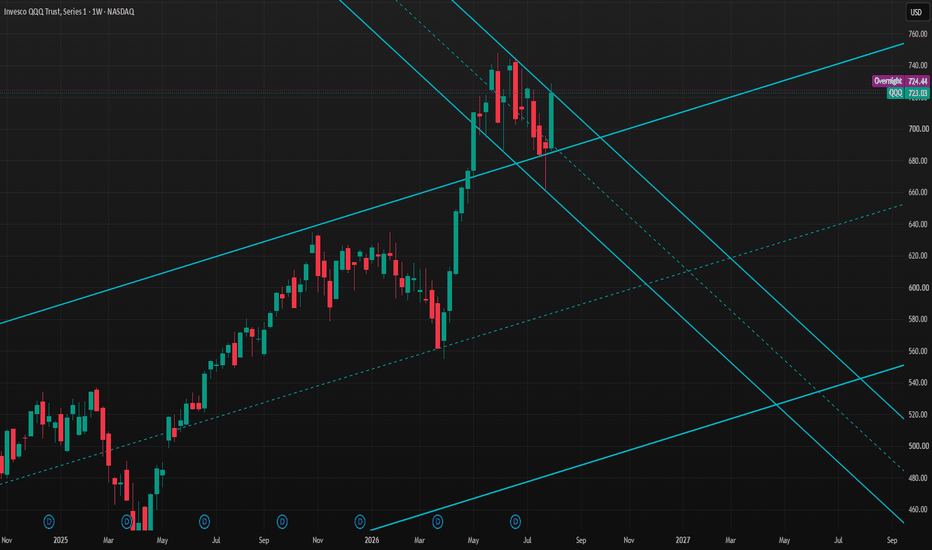
10Y initially lower/contained → QQQ tests ~$728 → SPY retests ~$777 → IWM tests $303
If CPI comes in 0%/+0.1% or softer, particularly if core is only +0.1%, I'd expect a much stronger duration rally, since it's the scenario capable of producing QQQ $730 → $735 → $738, SPY cleanly through $777 toward $780–$785 & IWM through $303 toward $305–$307
The dangerous outcome is headline ≥+0.3% or core ≥+0.3%
After the weak NFP report, the market is effectively positioned for the combination of weaker growth & benign inflation
A hot core CPI would break that combination
The first reaction should be yields higher, growth multiples lower, with QQQ likely suffering the most
A +0.3/+0.3 type CPI would make $718 → $715 → $710/$707 my immediate QQQ downside sequence
A genuinely hot +0.4 core print would put the $704–$700 region back into play
The market is pricing a lot more event risk into QQQ than SPY, exactly what we would expect around this macro setup — 14 August expiration, using the ATM straddles
QQQ ±14 or ±2% → $709–$738
SPY ±9 or ±.2% → $764–$783
IWM ±5 or ±1.6% → $297–$306
That QQQ upper expected-move boundary at roughly $738 is striking because the 1H chart has an existing major swing reference at $737.62
A very clean options/technical confluence
QQQ doesn't need an extraordinary move to reach $738 this week
It's almost exactly the option market's +1σ boundary
Across the complete August chain there are approximately 1.3M call OI vs 1.4M put OI, for a raw put/call OI ratio of about 1.1
Looks mildly defensive until you examine where the options actually sit
The major August call concentrations
$700 — 109K calls
$730 — 80K
$740 — 64K
$705 — 55K
$750 — 54K
$735 — 52K
$760 — 52K
The important upside architecture is therefore extremely obvious $730 → $735 → $740 → $750
Matches the technical chart almost perfectly
Meanwhile much of the put OI is substantially farther OTM
$680 — 100K puts
$700 — 93K
$650 — 66K
$660 — 56K
$690 — 50K
$670 — 50K
So I don't interpret the modestly >1 put/call ratio as bearish directional positioning, since lot of that is tail protection
More importantly, when I delta-weight the entire August chain, the net option exposure remains substantially positive rather than negative; in other words, despite all of that downside protection, the economically meaningful directional positioning is still tilted upward
For 14 August specifically, the largest upside gamma/OI concentrations are $725 → $730 → $735 → $740
The strongest are approximately $730 & $735, with $735 the largest individual call-OI strike at 13.6K contracts & $730 around 10K
Makes $730–$735 the key acceleration/pinning area
If QQQ clears $728.54, there is very little mystery about where the options market wants to test next, $730 → $735
If CPI is sufficiently benign to push through $735, then $740 becomes the next natural dealer/positioning magnet
On the downside, the strongest near-price put concentrations are approximately $715, $710, $705 & $700
Almost identical to the technical support ladder
This is unusually clean alignment
For Friday expiration I calculate approximately
QQQ 25Δ put IV → 19.3%
QQQ 25Δ call IV → 17%
So downside puts carry about a 2.3 volatility-point premium
IWM shows almost the same thing, around a 2.1 vol-point downside skew, while SPY's downside skew is smaller at roughly 1.2 vol points
Means protection is being paid for, especially in QQQ/IWM, but it is not an extreme “crash is imminent” signal
It's exactly what I would expect ahead of CPI/PPI after a sharp recovery
SPY is the technically strongest of the 3
The 14 August chain has an enormous $775 call concentration — roughly 89K contracts just in Friday expiration
Across August, $775 remains the dominant call strike with about 158K calls
Makes $775–$777 a genuine pin/breakout level
If CPI is benign & SPY establishes above $777 rather than merely sweeping it, I believe the positive gamma structure can suppress volatility & pull price toward approximately $780, then potentially $785
SPY's Friday expected range is only $764–$783, meaning the market is not pricing a major collapse despite Wednesday/Thursday event risk
IWM's Friday expected range is roughly $297–$306
The main upside call clusters are $300, $303 & $305, with larger August positioning extending into $310–$315
The downside book is much heavier than QQQ's — August put/call OI is above 3, but again much of the put inventory sits well below spot around $285–$295
I'd interpret that as substantial hedging beneath an otherwise improving small-cap structure
The key IWM signal this week is therefore simple — $303 acceptance → $305–$306 expected-move test
If IWM breaks $303 at the same time SPY breaks $777 & QQQ takes $728, that is much stronger evidence of genuine broad risk-on continuation than a QQQ breakout by itself
There are several reasons I remain bullish, but not aggressively so
The 10Y is still elevated around 4.7%, above its rising 50d average around 4.5%
However, VIX is only around 15 & has fallen beneath its short-term average
Breadth is back above 50%, while SPY & IWM are sitting directly beneath their highs
There is one yellow flag → SMH/QQQ remains materially below its recent MA trend, meaning semis aren't providing the kind of relative leadership normally associated with a full NDX melt-up
Meanwhile IGV/QQQ has started turning upward, suggesting leadership has shifted somewhat toward software
Supports continuation, but probably a more selective continuation
Monday–Tuesday
Consolidation/grind around QQQ $718–$728, with positioning building ahead of CPI
Wednesday benign CPI
Initial push through $728.54, then $730–$735
Thursday benign PPI
Confirmation allows QQQ to probe approximately $737–$740
Friday
Retail sales & sentiment determine whether the breakout holds or gets faded
Retail sales are also due Friday, so the week's event risk doesn't end with PPI
The market's +1σ QQQ target is basically ~$738, so my highest-probability weekly endpoint isn't $750, it's approximately $730–$738, assuming inflation behaves
55% bullish continuation — QQQ $728 → $735 → $738/$740
25% range/chop — $715–$730
20% bearish inflation shock — $715 → $707 → $700
I still wouldn't start this week with a naked bearish QQQ thesis
The higher-edge directional setup is long on acceptance above $728.54, targeting $735 → $738/$740, invalidated by a failed breakout back below roughly $723–$724
The higher-edge put setup remains the opposite
QQQ sweeps $728–$735 around CPI, yields spike & price then loses $718 followed by $715
Would be a genuine macro-driven failed breakout rather than simply fading an extended chart
For CPI itself, I'd pay particular attention to core MoM
Headline +0.1$ is already well anticipated
The difference between core +0.2% and +0.3% is likely far more important for QQQ than whether headline prints 0% versus +0.1%
The market is priced for benign inflation & continued upside, but not a huge dovish surprise
QQQ has room to $735–$738 within its normal weekly implied move
The bullish thesis becomes materially stronger over $728.54 & materially weaker below $715; $707–$700 is the true bearish structural break
Notably, the August chains reinforce those exact levels rather than contradicting them
This is a meaningful earnings week for QQQ/AI infrastructure, even though the mega-cap reporting cycle is largely finished
The market sensitivity is concentrated in AI compute, networking, optics & semi equipment
Mon 8/10 RKLB, ASTS — high-beta/speculative growth; useful risk-appetite
Tue 8/11 SMCI — major AI-server / NVDA ecosystem
Tue 8/11 CRWV — major AI compute demand + hyperscaler CapEx
Tue LITE — AI/datacenter optical networking demand
Wed 8/12 NBIS — AI cloud/GPU infrastructure demand
Wed 8/12 CSCO — networking, enterprise AI and datacenter spending
Wed 8/12 COHR — optical/datacenter networking
Thu 8/13 AMAT — critical semi CapEx/memory/foundry demand
The highest-impact cluster is SMCI + CRWV Tuesday night → NBIS Wednesday morning → CSCO Wednesday night → AMAT Thursday night
CRWV is expected to show extremely rapid revenue growth, while CSCO & AMAT estimates also imply strong YoY growth
Makes this unusually important because earnings overlap directly with Wednesday CPI & Thursday PPI
The market gets both sides of the valuation equation simultaneously → AI earnings determine the earnings-growth narrative, while CPI/PPI determine the discount-rate/yield narrative
Cool CPI + strong SMCI/CRWV/NBIS → strongest bullish combination
Falling 10Y plus confirmation of AI infrastructure demand would support continuation of the recent growth/tech rally
Cool CPI + weak AI earnings → mixed
Lower yields provide valuation support, but disappointing AI demand could prevent QQQ from fully exploiting the macro tailwind
Hot CPI + strong AI earnings → tug-of-war
Earnings support semis/AI, but rising yields compress multiples
This could produce large intraday rotations rather than a clean index trend
Hot CPI + weak AI earnings → highest downside-risk combination
You'd simultaneously lose the lower-yield narrative & get an AI-growth disappointment
The market enters this week after a very strong prior week, with the NDX reportedly up about 5.2% & the S&P 500 about 3.6%, so that raises the hurdle for merely "good" earnings; especially, in the high-beta AI names — treat Tuesday after the close through Thursday as the real event window, rather than viewing CPI/PPI in isolation  Short
Short
Short 
 Short
Short
 Short
Short
 Long
Long