Research 27.07.2026🌏 Markets:
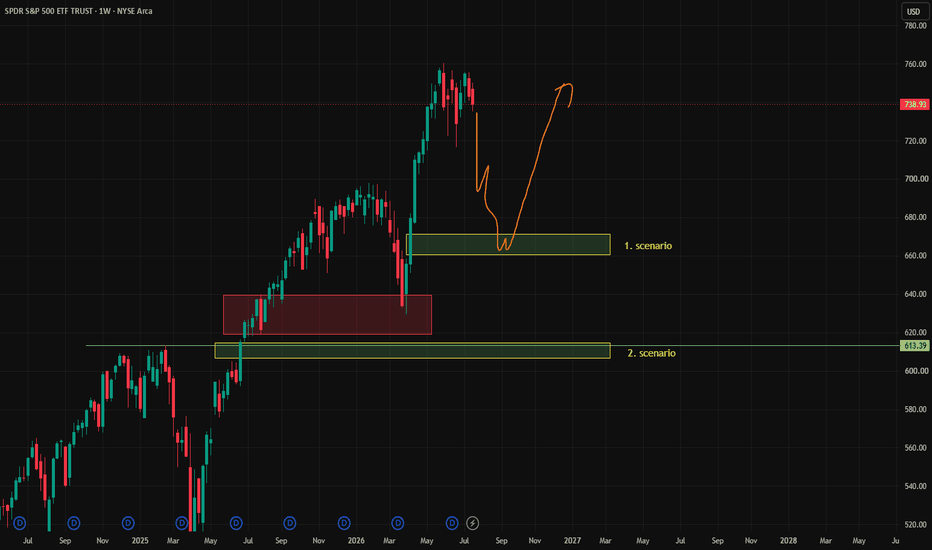
AMEX:SPY +6.49 +0.88%(pre/m)
NASDAQ:QQQ +9.52 +1.39%(pre/m)
🆕 Economic News:
The “conditional” pause in strikes between the US and Iran has continued since last Friday.
08:30 USA – Durable Goods Orders
10:30 USA – Dallas Fed Manufacturing Index
📈 Gap Ups
Reaction to earnings/guidance:
LSE:AZN NASDAQ:BKR
Other news:
$T Signs Agreement to Expand Use of D-Wave's NASDAQ:QBTS Quantum Computing Technology Across Network Operations
XETR:SAP extending a rally from last week after the earnings.
NASDAQ:RKLB Awarded Record $266M Missile Defense Contract with U.S. Space Force for Suborbital Launches
Analysts are linking the rally in the US AI industry to the historically record-breaking IPO of Chinese memory chipmaker CXMT : NASDAQ:SKHY NASDAQ:MU NASDAQ:SNDK NASDAQ:WDC NASDAQ:STX
NASDAQ:ARGX announced a definitive agreement to acquire NASDAQ:FBRX in an all-cash transaction valued at approximately $2.2 billion or $77 per share. / NASDAQ:TRAX rose in symphaty to FBRX
NASDAQ:NVDA anounced launch of AI Alliance
-- Tech heavyweights NASDAQ:NVDA , NASDAQ:MSFT , NASDAQ:META , and NYSE:IBM have joined forces to create the Open Secure AI Alliance.
-- The initiative aims to protect open-source AI from strict government regulations and provide cybersecurity experts with uncensored, open models to combat cyber threats effectively
-- Key infrastructure and cybersecurity players joining the 30+ member alliance include NYSE:DELL , NYSE:HPE , NYSE:CRM , XETR:SAP , NASDAQ:ADBE , NASDAQ:CRWD , NASDAQ:CSCO , NASDAQ:PANW , and $NET.
📉 Gap Downs
Reaction to earnings/guidance:
MYX:NE
Other news:
NASDAQ:MPLT Announces Positive Results from Phase 2 ZEPHYR Trial of ML-007C-MA in Schizophrenia but the once-daily version of the drug completely failed the trial, missing statistical significance on the primary endpoint.
Gas/Oil stocks falls on “conditional” pause in strikes between the US and Iran : NYSE:EQNR NYSE:BP NYSE:SHEL AMEX:USO
NASDAQ:LEGN Announces CEO Transition
‼️ Additional
The “conditional” pause in strikes between the US and Iran has continued since last Friday.
-- The US has halted its strikes, and Iran is reciprocating.
-- Iran and the US continue to hold talks through mediator countries — IRNA, citing an official representative of Iran’s Foreign Ministry.
-- The head of CENTCOM recommended that Trump halt strikes against Iran in the Strait of Hormuz area, as they had reached the limit of their effectiveness — Axios.
-- #Oil = -10% over two trading sessions.
The US Q2 2026 earnings season continues.
-- Among the companies that have already reported, 80% have beaten revenue expectations, above the 5-year average of 70% and the 10-year average of 68%.
-- 86% have beaten EPS expectations, above the 5-year average of 78% and the 10-year average of 76%. — FactSet
After its Shanghai IPO, chipmaker CXMT became China’s largest company by market capitalization at $543.5 billion, with shares rising 500% in their trading debut.
Nvidia NASDAQ:NVDA is in talks to provide OpenAI with around $250 billion in financing to build a large-scale data center — WSJ.
NASDAQ:AAPL shares have outperformed the Nasdaq by 22% this month, marking a 20-year record.
📋 List of tickers involved:
LSE:AZN NASDAQ:BKR $T NASDAQ:QBTS XETR:SAP NASDAQ:RKLB NASDAQ:SKHY NASDAQ:MU NASDAQ:SNDK NASDAQ:WDC NASDAQ:STX NASDAQ:ARGX NASDAQ:FBRX NASDAQ:TRAX NASDAQ:NVDA NASDAQ:MSFT NASDAQ:META NYSE:IBM NYSE:DELL NYSE:HPE NYSE:CRM NASDAQ:ADBE NASDAQ:CRWD NASDAQ:CSCO NASDAQ:PANW NYSE:NET MYX:NE NASDAQ:MPLT NYSE:EQNR NYSE:BP NYSE:SHEL AMEX:USO NASDAQ:LEGN NASDAQ:AAPL
Best regards – hi2morrow team.
 Long
Long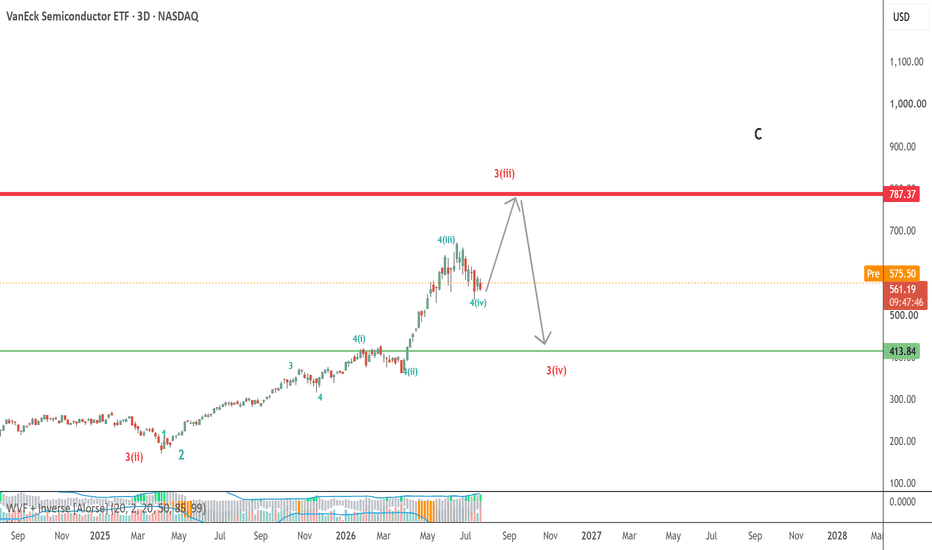
SPY Trapped at $738: Who Breaks First?
WAIT. SPY is sitting on support, but buyers still have not repaired the damage.
1 Hour
The 1 hour chart still favors sellers. SPY failed near $750, broke below the $744 area, and the rebound from $735 could not hold above $742 to $743.
Now price is back near $738 and moving sideways. That tells me selling pressure has slowed, but it does not yet show a real reversal.
For the bigger picture to improve, SPY needs to reclaim $744. Until that happens, rallies can still be treated as lower highs.
15 Minute
The 15 minute chart is trying to form accumulation near $735 to $738. Buyers defended the low twice, but every bounce has stalled beneath the descending resistance.
The immediate battle is between $738 and $740. If SPY can push through $740, it could test $741 to $742. That is where I expect sellers to become active again.
A loss of $738 would weaken the accumulation idea and put $736 to $735 back in play.
GEX
The GEX map places the high volume level directly at $738, which explains why price keeps returning to this area. It may act like a magnet until one side takes control.
Above price, resistance is stacked at $739, $740, $741, $742 and $745.
Below price, support sits at $736 and $735. If those levels fail, the next downside areas are $732, $731 and $730.
Put positioning is very heavy, so a break under support could move faster than traders expect.
My Setup
For calls, I would wait for SPY to reclaim $740 and hold it. The first targets would be $741 to $742, then $744.
For puts, I would watch for rejection near $740 to $742 or a clean break below $738. The downside targets would be $736 and $735.
My read is that SPY is trying to build a floor, but it is doing so underneath resistance. Would you trust the accumulation near $738, or wait for $744 to be reclaimed first?
 Long
Long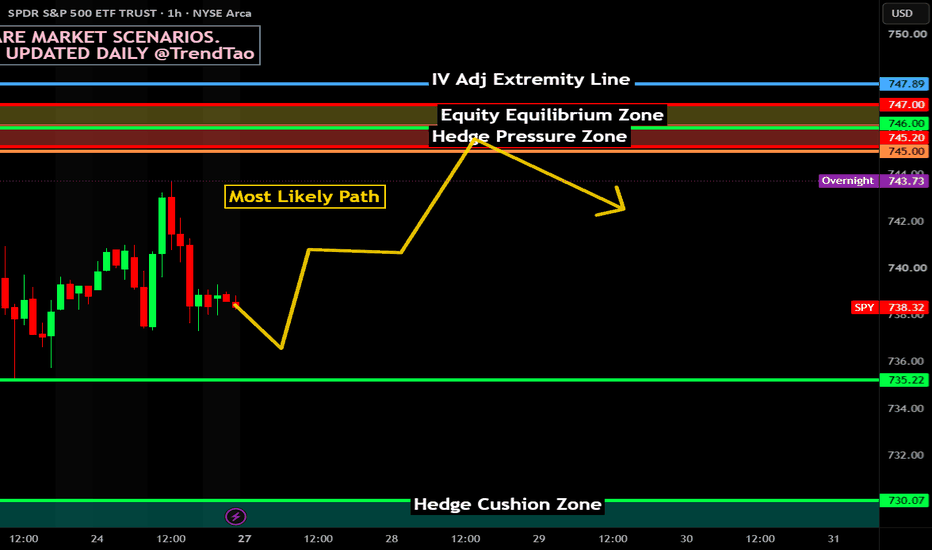
Weekly Bias — 27 JulyWhat would change the outlook back to bullish?
NASDAQ:QQQ would need to reclaim $686 quickly
Reclaim the 20d & 50d EMAs
Recover $707–$708 (the 78.6% retracement)
Eventually break & hold above $724
Until these levels are reclaimed, rallies are more likely to be viewed as countertrend bounces within a corrective phase
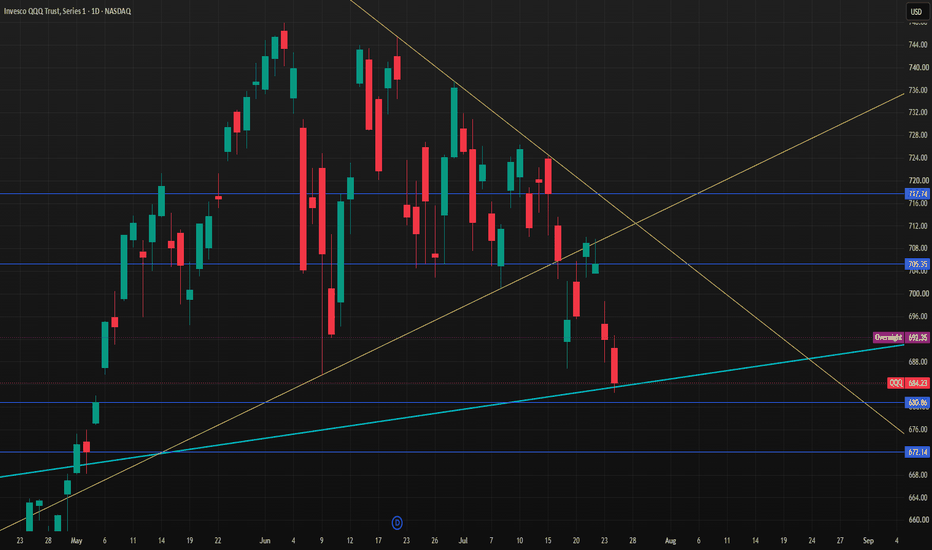
Heading into a week dominated by NASDAQ:MSFT , NASDAQ:META , NASDAQ:AAPL & NASDAQ:AMZN earnings, NASDAQ:QQQ is sitting on a critical support area around $682–$686
Strong AI-driven earnings & favorable guidance could produce a false breakdown & reclaim of the flag, but if those reports disappoint, the measured downside opens toward the $655 area (50% retracement) & potentially the $648 region (200d EMA)
Makes this week's earnings a likely inflection point for determining whether the recent breakdown becomes a bear trap or the beginning of a deeper correction
Rather than expecting a straight trend, I'd expect multiple large rotations around Wednesday afternoon & Thursday evening
NASDAQ:QQQ
Daily trend has deteriorated from bullish expansion into a corrective phase
Friday closed below the 20d EMA, below the 50d EMA & below the 78.6% retracement (~$708)
Price is now sitting just above the June swing support near $682-$686
MACD continues to expand negatively
RSI has broken below 40 with no bullish divergence
Stoch RSI is pinned near zero, showing momentum is stretched
Volume increased on the decline, suggesting distribution rather than simple profit-taking
AMEX:SPY
Considerably stronger than NASDAQ:QQQ
Still holding above its 50d EMA
Relative strength continues to favor the broader market over technology
If AMEX:SPY loses $739, sellers likely accelerate
AMEX:IWM
Also stronger than NASDAQ:QQQ
Still above the 50d EMA
Small caps continue outperforming large-cap tech
Tells me this remains primarily a large-cap technology correction
Intermediate trend is still bullish as long as NASDAQ:QQQ ultimately holds roughly $675-$680, so lose that area & the correction likely extends toward the 200d EMA
Major liquidity remains around $680, $675 & $670
These are where larger buyers are most likely to defend
This is now a correction inside a larger bull trend rather than a bear market
Oil/Mid-East is probably the largest bullish macro development entering Monday
Oil collapsing → inflation expectations soften → yields should stabilize or fall → large-cap growth gets support
Offsets much of Friday's risk-off selling
There is a reasonable probability of a relief bounce Monday
The key question is whether buyers can hold the gains into Wednesday's FOMC
Monday — positioning
Tuesday — compression
Wednesday morning — range
Wednesday 2 PM — volatility explosion
Wednesday 2:30 PM — direction decided
I'd avoid chasing any move before Warsh
This week represents nearly one-quarter of NASDAQ:QQQ 's market cap
NASDAQ:MSFT is the most important report
Cloud
AI
CapEx
Guidance
NASDAQ:META
AI spending
Advertising
Margins
NASDAQ:AMZN
AWS
Consumer
CapEx
NASDAQ:AAPL
Services
China
iPhone demand
Collectively these 4 names can easily move NASDAQ:QQQ several percent
Based on the current volatility regime & the weekly options pricing as of Friday's close
NASDAQ:QQQ approximately ±18-22 points or $663–$707
A move outside that range likely requires a major earnings surprise or an unexpectedly dovish/hawkish FOMC
Current fair value approximately $695-$700
Above $700, momentum improves substantially
Below $680, correction deepens
Bullish (45%)
Oil stays weak
Yields fall
NASDAQ:MSFT & NASDAQ:META impress
Warsh neutral/dovish
$684 → $692 → $700 → $708 → $720
I'd scale profits into $708-$715, where supply from the recent breakdown becomes meaningful
Neutral (30%)
NASDAQ:QQQ trades $682-$700 through FOMC then waits for earnings
This is probably the most frustrating outcome for short-dated options because theta becomes a headwind
Bearish (25%)
Hawkish Warsh
Weak AI guidance
Higher yields
Break below $680
$675 → $668 → $660
Would likely invalidate any near-term bullish thesis
Despite Friday's technical damage, I don't think the intermediate-term bull trend is broken
This week has enough macro & earnings catalysts to produce a sharp relief rally, particularly if lower oil feeds into lower yields & AI earnings remain strong
The level I'd watch most closely is $700
A recovery & close back above that area would suggest Friday was primarily a liquidity flush
Failure to reclaim it; especially, after a positive Monday would increase the odds that the correction extends toward $675 before a more durable low forms  Short
Short
Long 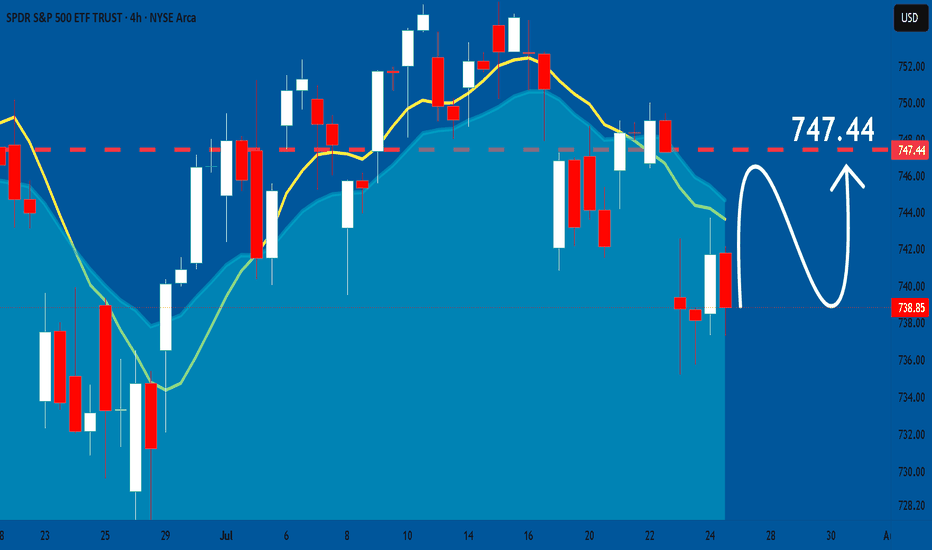
Long 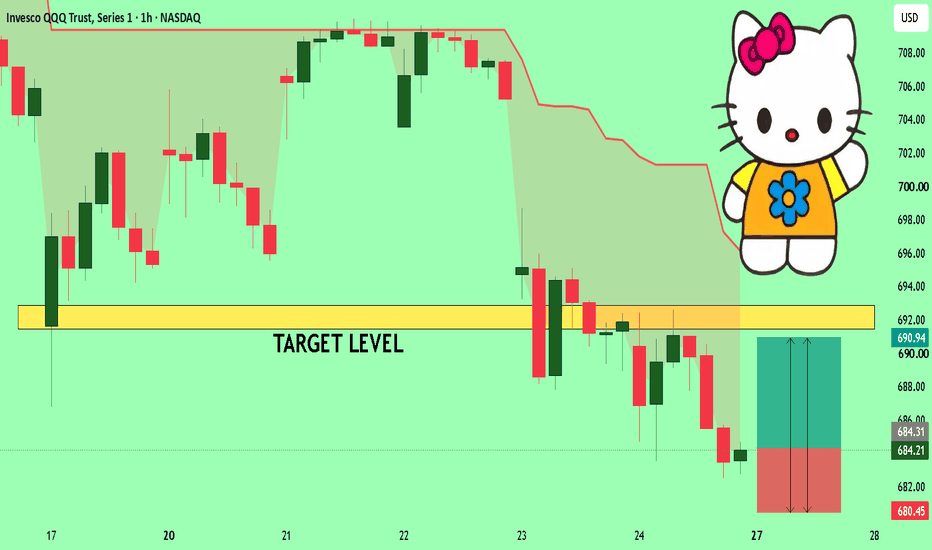
Premium Selling for the Week of 7/27: EWY, SMH, MU, INTCETF's with >50% IVR/>35% IV:
SMH (94.8/62.1), Sept 4th 560 short straddle paying 85.50, 15.3% as a function of strike price.
EEM (83.7/38.4), Sept 4th 63 short straddle paying 5.68, 9.0% as a function of strike price.
XLK (82.2/37.0), Sept 4th 176 short straddle paying 16.77, 9.5% as a function of strike price.
EWT (79.8/41.8), Sept 18th 100 short straddle (no weeklies in this underlying), 11.95, 12.0% as a function of strike price.
TAN (78.0/46.8), Sept 18th 51 short straddle (no weeklies), 7.15, 14.0% as a function of strike price.
EWY (72.7/74.9), Sept 4th 163 short straddle, 30.35, 18.6% as a function of strike price.
Single Name with >70% IVR/>50% IV Without An Earnings Announcement in the Next 45 Days:
MU (82.2/102.8) (Probs announces in late Sept; last announcement was 6/24), Sept 4th 920 short straddle, 233.57, 25.4% as a function of strike price.
INTC (72.4/87.4) (Announced Last Week), Sept 4th 92 short straddle, 20.98, 22.8% as a function of strike price.
I'm generally not going to do short straddles in these, but if the short straddle isn't paying at least 10% of the strike price in credit, then a standard setup (i.e., 45 DTE, 25 delta short strangle both sides) isn't probably going to pay either; the price-out of the short straddle is basically a "starting point" to see which underlyings offer the best bang for my buying power buck ... .
It looks like EWY, followed by SMH offer the best bang for buck, with TAN and EWT being kind of illiquid and XLK (which is kind of just QQQ "lite") and EEM, not making the 10% cut-off. Both INTC and MU are "bang for my buck" worthy.
Preliminary Setups:
EWY Sept 4th 140/195 short strangle, 11.85 credit, -1.94/28.68 delta/theta.
EWY Sept 4th 125/140/195/210 iron condor, 5.78 credit, .46/7.58 delta/theta.
SMH Sept 4th 500/645 short strangle, 33.17 credit, .76/82.18 delta/theta.
SMH Sept 4th 445/600/645/700 iron condor, 19.69 credit, .08/29.01 delta/theta.
MU Sept 4th 770/1180 short strangle, 90.02 at the mid, delta/theta -.08/224.06.
MU Sept 4th 670/770/1180/1280 iron condor, 39.35 at the mid, delta/theta 3.36/50.13.
INTC Sept 4th 80/115 short strangle, 8.51 credit, .43/20.12 delta/theta.
INTC Sept 4th 70/80/115/125 iron condor, 4.09 credit, delta/theta 4.82/5.17.
QqqIf we gap down Monday then it's 680 gap close and below 680, then 674 comes..
If we don't gap down Monday I expect a grind from Monday- we'd back up to 702-706 and from there we head down in to 674 which is
.618 fib and weekly 20sma..
Most of this sell should come from chips late in the week but let's look at some tech sectors..
Starting with AMEX:XLC , The home of googl and meta
Almost near supply area of 103.. has been trading 103 -120 for over a year now and imo it is distribution. I'm looking at this chart and from what I see is, if we break below 103, we are headed back to tariffs lows.
Unless we close below 103 this week I'd be cautious shorting down here .
AMEX:XLY home of TSLA and Amzn
Too far outside it's daily Bbands.. but the short isn't done. I think we pop higher early in the week then we head to 104 either this week or early next week. As you can see this sector has traded sideways similar to XLC for an entire year.. similar to XLC if XLY holds 104 then a rally can come , but if it loses 104 then we take tariff lows
CBOE:IGV software sector NYSE:ORCL and NASDAQ:MSFT
I actually had I hopes for this sector
Bounced Friday off it's weekly 200ema, but the selling isn't done, I expect a drop to 84 this week to complete this double top. From there we'll see what happens
Lastly
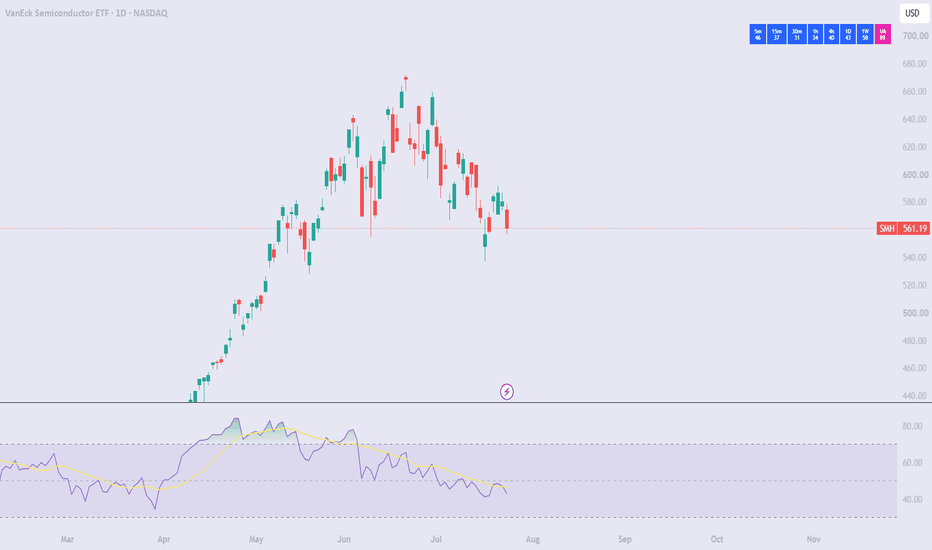
NASDAQ:SMH chips..
My target this week is the weekly 20sma or 522 gap close
Simple down trend here , with stiff resistance at 572..
So to put it all together, most of the mag 7 and software sectors I see them dropping another 2-4%.. From those crucial supports we either have a big rally going into early August or crash back to COVID lows. the major problem is the monthly candle, if we end up closing below 690 for the month then the bearish dragon fly doji for June is a confirmed reversal which means even if we rally early August we most likely start selling back down around mid August to keep in line with the monthly trend. Short 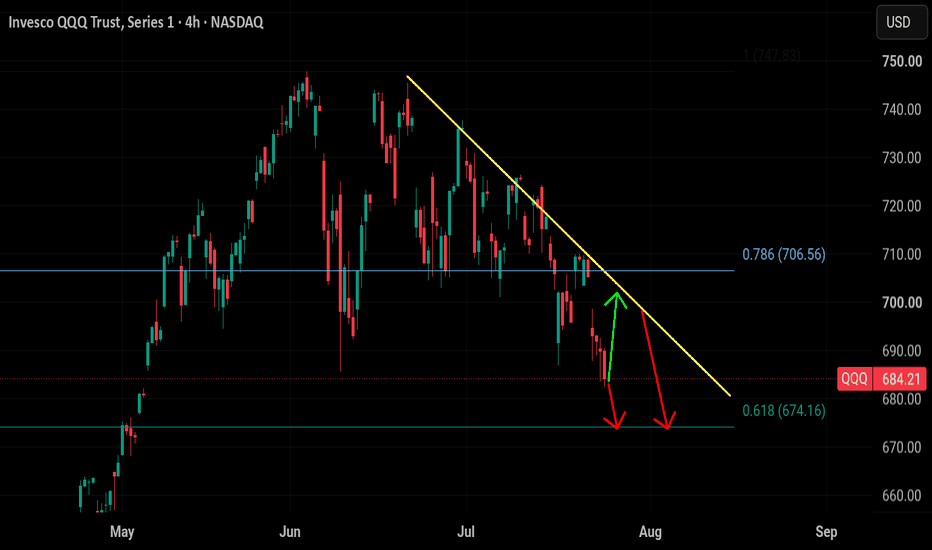
Short 
Stock Market Forecast | BTC TSLA NVDA AAPL AMZN META MSFT0:00 - Intro & Video Overview
0:17 - Macro Data & Sector Rotation
1:05 - AI Sentiment Data & Fear Index
1:51 - Earnings Preview: CapEx Fear vs. Semi Impact
3:16 - Semiconductor ( NASDAQ:SMH ) Dark Pool Analysis
5:01 - Upcoming Economic Data (FOMC, PCE, PMI)
5:25 - S&P 500 ( AMEX:SPY ) Technical Breakdown
6:53 - Nasdaq 100 ( NASDAQ:QQQ ) Weakness & Sector Weighting
8:29 - Bitcoin ( CRYPTOCAP:BTC ) Technical Analysis & Key Levels
10:11 - Tesla ( NASDAQ:TSLA ) Earnings Reaction & Support Zones
13:04 - Meta ( NASDAQ:META ) Outlook Ahead of Earnings
13:56 - Amazon ( NASDAQ:AMZN ) Support & CapEx Concerns
14:37 - Microsoft ( NASDAQ:MSFT ) Chart Setup
16:21 - Google ( NASDAQ:GOOGL ) Post-Earnings Pullback
17:38 - Apple ( NASDAQ:AAPL ) Price Discovery & Strength
18:27 - Nvidia ( NASDAQ:NVDA ) Key Support & Structure
19:42 - Outro & Upcoming Commodities Update
YouTube Video DescriptionIn this weekly stock market update, we break down the macro implications of rising AI CapEx fears following Google’s earnings, NASDAQ:SMH dark pool prints, and key technical levels across the S&P 500, QQQ, Bitcoin, and the Mag 7.Key Technical Levels & Macro Drivers:CapEx Anxieties & Earnings Week: Google's earnings spooked markets over escalating AI CapEx spend.
All eyes are on Apple, Amazon, Microsoft, and Meta earnings to see if CapEx continues to rise (bullish for semis, bearish for mega-cap tech) or plateaus.Semiconductors ( NASDAQ:SMH ): Dark pool prints came in at Friday's low near $560 (the 3rd largest print), defending the last structural floor. Bulls need to reclaim $605–$620 to target a backtest of the $633 breakdown zone.
Indices Divergence ( AMEX:SPY vs NASDAQ:QQQ ): SPY remains resilient just 3% off all-time highs thanks to healthcare, energy, and financial sector rotation. QQQ broken down due to heavy semi weightings.
Bitcoin ( CRYPTOCAP:BTC ): Flashing relative strength against tech, forming a potential inverse head-and-shoulders. Reclaiming $67K negates a bear flag and unlocks a run toward $70K.Mag 7 Highlights:
NASDAQ:TSLA : Gapped down post-earnings into lower structural support; waiting for weekly oversold conditions near $334/teen RSI readings for high-probability bounce setups.
NASDAQ:AAPL : The standout leader insulation from AI CapEx spending fears, trading in pure, uninterrupted price discovery mode at all-time highs.
NASDAQ:NVDA : Fiercely defending its $200 historical resistance-turned-support floor. Zero macro structural damage while holding above this level.
NASDAQ:MSFT & NASDAQ:GOOGL : Microsoft holding $380 support after taking its CapEx hit last earnings; Google testing key support near $311 with a psychological floor at $300.
Long 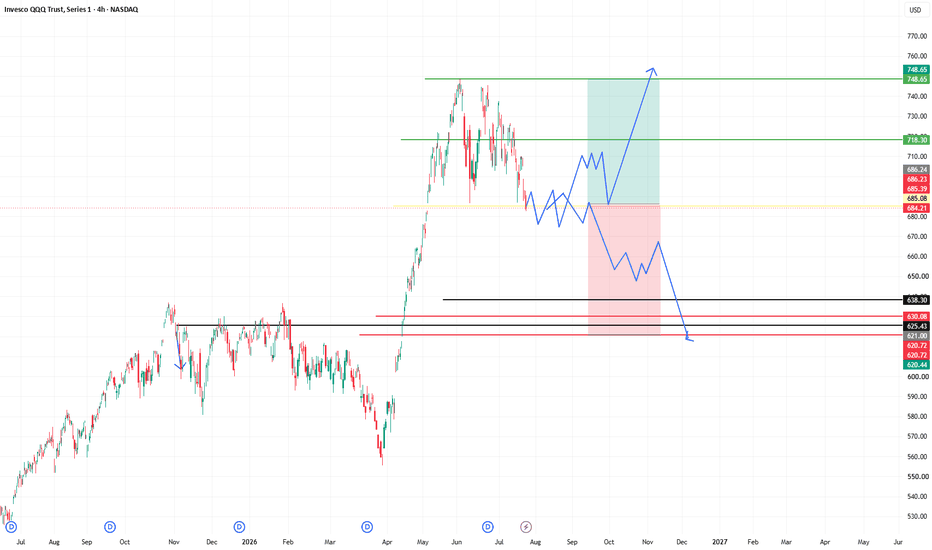
Short 
Short