Long
Long
 Long
Long
 Long
Long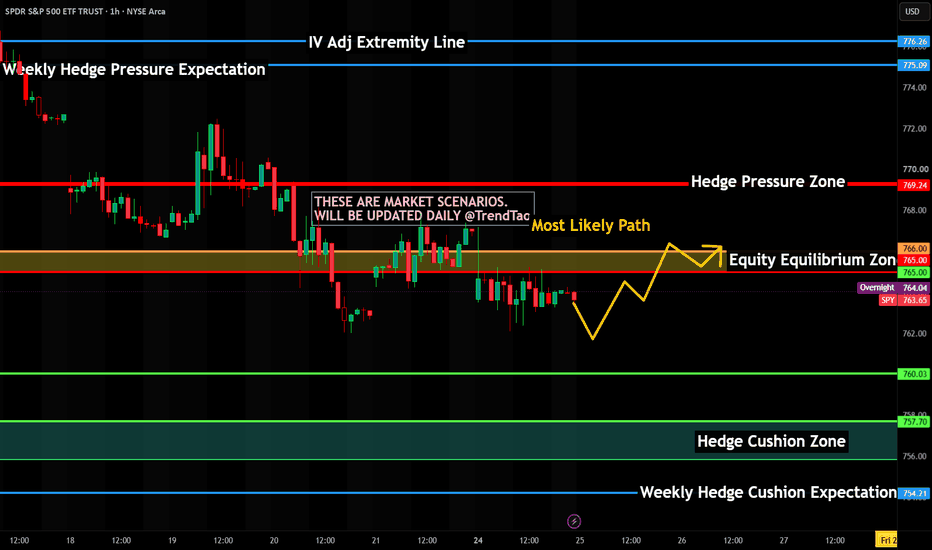
Long 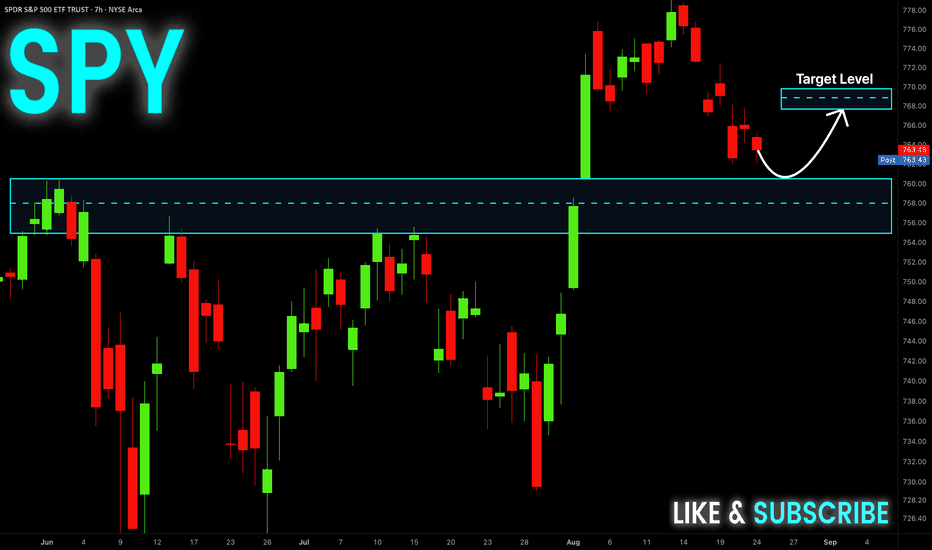
Long 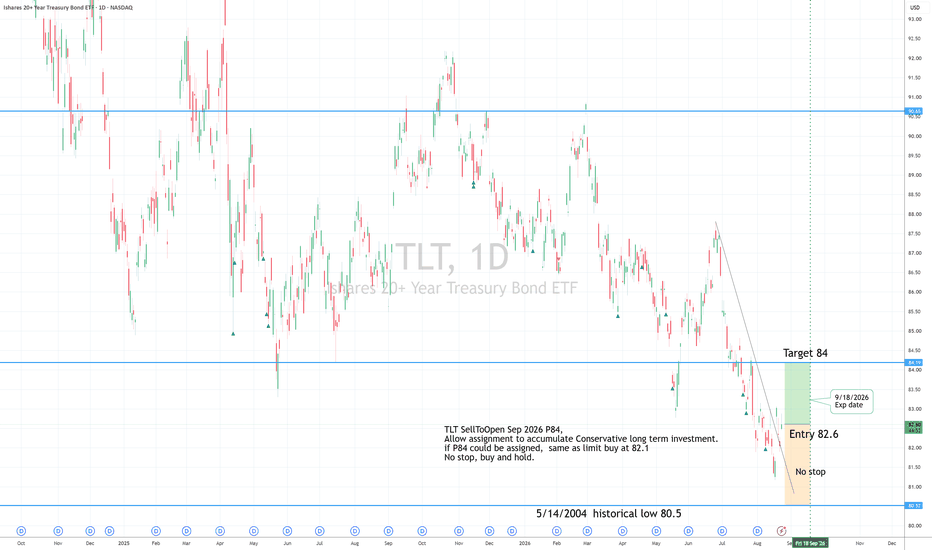
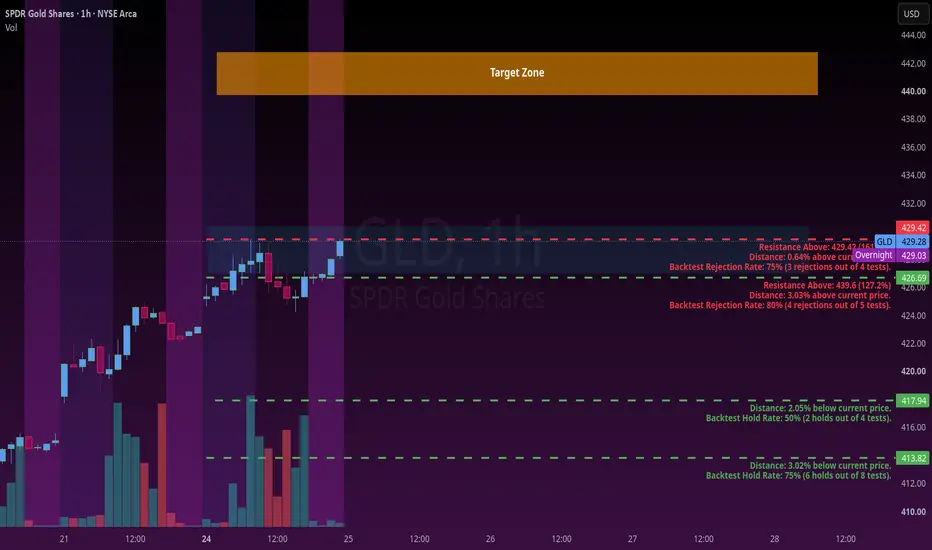
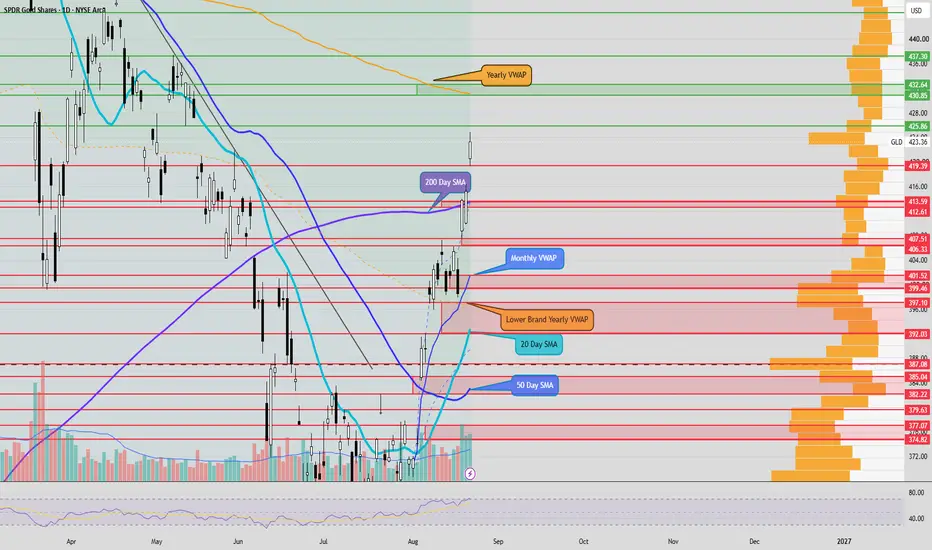
Canadian Gold Miners UndervaluedThe Invesco S&P/TSX Global Gold Index ETF (CGMU) offers investors diversified exposure to many of Canada's leading gold mining companies, providing a way to benefit from rising gold prices without relying on the success of a single miner. As one of the world's largest gold-producing regions, Canada is home to high-quality operators with long-life assets, strong balance sheets, and increasing free cash flow.
Despite gold trading near record highs, Canadian gold miners remain relatively undervalued. Years of investor preference for technology and AI stocks have left the sector overlooked, even as mining companies generate record earnings and strengthen their financial positions. Many producers continue to trade at attractive valuation multiples compared to the broader market and previous gold bull cycles. With central banks continuing to accumulate gold, persistent geopolitical uncertainty, and expectations for lower interest rates supporting bullion prices, the outlook for gold remains constructive. If investor sentiment shifts back toward defensive assets, Canadian gold miners could benefit from both rising earnings and expanding valuation multiples, making CGMU an attractive way to gain broad exposure to the sector.
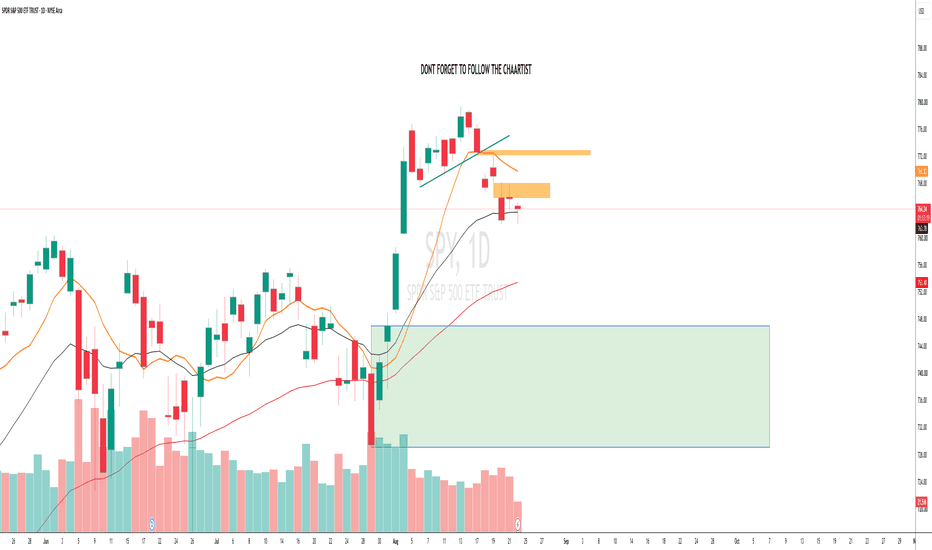
The technical setup here is becoming increasingly interesting and appears to be forming the foundation for a potentially significant reversal. Price has been compressing within a falling wedge pattern for several months, a formation that is often associated with bullish reversals once a breakout occurs. That breakout has now taken place, and the recent pullback is finding support at the broader range's Value Area Low, adding an important layer of technical confluence. This area also aligns closely with key Fibonacci retracement levels, further strengthening the case that buyers may begin stepping in.
While no setup is guaranteed, the current risk-to-reward profile looks quite attractive if these support levels continue to hold. A sustained move higher could trigger renewed momentum as confidence returns to the sector, particularly if gold prices remain strong. Although it's an ambitious target, I believe there is a realistic path for the ETF to advance toward the **$15** level over the medium term, representing a substantial recovery from current prices if the broader bullish thesis plays out.
 Long
Long
Research 24.08.2026🌏 Markets:
AMEX:SPY -1.15 -0.15%(pre/m)
NASDAQ:QQQ -3.55 -0.50%(pre/m)
🆕 Economic News:
08:30 USA – Chicago Fed National Activity Index
14:00 USA – Treasury Secretary Bessent Speech
📈 Gap Ups
Reaction to earnings/guidance:
NASDAQ:PDD
Other news:
NASDAQ:STLD after U.S.-Canada trade talks collapsed, removing expectations that the existing 50% U.S. tariffs on Canadian steel and aluminum could be reduced. NYSE:NUE on the same catalyst.
NYSE:CLF announced $1B modernization project for Middletown Works, supported by a $500M U.S. Department of Energy award.
NASDAQ:SDOT Shares Surge on Debt Restructuring and AI Trading Strategy
📉 Gap Downs
Reaction to earnings/guidance:
NYSE:XPEV
Other news:
NASDAQ:AAOI plan to raise $600 million through an at-the-market equity offering.
-- Other stocks in the optical manufacturing sector are dropping too: NASDAQ:LITE NYSE:COHR NYSE:GLW
NYSE:BABA launched a $10.2B share placement at an 8.4% discount to fund AI chips, infrastructure and models. (offering)
U.S. memory stocks sell off following Samsung Electronics’ 8–9% plunge after its shareholder-return plan disappointed investors : NASDAQ:SNDK NASDAQ:WDC NASDAQ:MU NASDAQ:SKHY
‼️ Additional
U.S. stock futures were lower early Monday as Treasury Secretary Scott Bessent prepared to announce new Iran sanctions
-- Bessent could tap near $1 trillion Treasury General Account to fund bond buybacks, sources said
U.S. imposing new 50% tariffs on$20 billion of Canadian goods
Fed Chair Warsh is scheduled to speak on Friday, August 28. The Jackson Hole Economic Symposium will take place this week, on August 27–28.
-- In addition to Jackson Hole, another major test for the market, according to media reports, will be Nvidia’s earnings report on August 26 after the US market close.
The US is expected to announce the “toughest sanctions in history” against Iran today — RTRS.
-- China’s Foreign Ministry said Beijing is prepared to take countermeasures if the US imposes sanctions related to Iran.
The US continues to draw down its Strategic Petroleum Reserve (SPR) at a record pace. Inventories have fallen to their lowest level since 1982.
-- US crude oil inventories are sufficient for just 41 days, the lowest level in half a century — BofA.
🏢 IPO
$BWGC – BW Industrial Holdings
Company provides facility construction services through its operating subsidiary BW Industrial Construction. It serves energy, electronics, automotive parts, advanced manufacturing and semiconductor fabrication customers. The company is also expanding into proprietary products, starting with modular water treatment systems designed for rapid deployment.
Price: $6.00–$7.00
Shares: 2.6M
Raised: ~$17.1M
Market Cap: ~$143.2M
LTM:
Revenue: $55.6M
Net Income: $7.6M
Key point:
Company is already profitable, but the IPO range was reduced from $7.00–$9.00 to $6.00–$7.00.
Comparable public companies: NYSE:FLR , NYSE:KBR , NYSE:PWR , NYSE:MTZ , NYSE:ACM
NASDAQ:RIKU – Riku Dining Group
Company operates and franchises Japanese-style restaurants in Canada and Hong Kong. In Canada, it runs 4 Ajisen Ramen restaurants and franchises 9 more across Ontario. In Hong Kong, it operates 7 restaurants under Yakiniku Kakura, Yakiniku 802 and Ufufu Cafe. Core thesis is expansion of a small but already profitable restaurant and franchise platform.
Price: $4.00–$6.00
Shares: 5.0M
Raised: ~$25.0M
Market Cap: ~$115.0M
LTM:
Revenue: $18.7M
Net Income: $1.04M
Key point:
IPO size was increased from 2.25M to 5.0M shares while keeping the same $4.00–$6.00 price range.
Comparable public companies: NASDAQ:KRUS , SEED_ALEXDRAYM_BIGMAC:YOSH , NASDAQ:GENK , NYSE:DRI , NYSE:YUMC
NASDAQ:MDAT – Web3Labs Global Inc.
Company provides Web3 business services for blockchain companies and startups in Asia. Its services include strategic consulting, accelerator program management, marketing, market research and operational support. The company also works with several public blockchain ecosystems and aims to help Web3 startups commercialize decentralized products and establish operations in Hong Kong.
Price: $4.00–$5.00
Shares: 6.3M
Raised: ~$28.1M
Market Cap: ~$140.0M
LTM:
Revenue: $2.0M
Net Income: $0.88M
Key point:
Company is profitable, but the business remains extremely small and highly exposed to Web3 / crypto market cycles.
Comparable public companies: NASDAQ:BTCS , NASDAQ:COIN , NASDAQ:BTBT , NASDAQ:HIVE , NASDAQ:MARA , NASDAQ:RIOT
📋 List of tickers involved:
NASDAQ:PDD NASDAQ:STLD NYSE:NUE NYSE:CLF NASDAQ:SDOT NYSE:XPEV NASDAQ:AAOI NASDAQ:LITE NYSE:COHR NYSE:GLW NYSE:BABA NASDAQ:SNDK NASDAQ:WDC NASDAQ:MU NASDAQ:SKHY $BWGC NYSE:FLR NYSE:KBR NYSE:PWR NYSE:MTZ NYSE:ACM NASDAQ:RIKU NASDAQ:KRUS SEED_ALEXDRAYM_BIGMAC:YOSH NASDAQ:GENK NYSE:DRI NYSE:YUMC NASDAQ:MDAT NASDAQ:BTCS NASDAQ:COIN NASDAQ:BTBT NASDAQ:HIVE NASDAQ:MARA NASDAQ:RIOT
Best regards – hi2morrow team.
Weekly Bias — 24 AugustThe week ahead leaves me neutral-to-cautious for Monday/Tuesday, but much more concerned about volatility from Wednesday onward, so I wouldn’t start the week with a blanket risk-off thesis
The charts show an incomplete correction sitting directly above important support, while the macro setup creates unusually strong 2-way event risk
The key contradiction is still intact — yields are flashing risk-off, while equities, volatility & breadth haven’t confirmed a disorderly de-risking
The 10Y is around 4.7%, substantially above its rising 50d average near 4.6%
The 30Y reached its highest level since 2007, while semis fell roughly 5% last week
A genuine valuation headwind for NASDAQ:QQQ
VIX is only around ~15, down sharply Friday; correlation is deeply negative at roughly -43%; dispersion has retreated & the percentage of NDX stocks above their 50d MA is still about 53%
This doesn’t look like systemic risk-off positioning, so I see fragility, not stress
At ~$713, price is sitting just above the rising intermediate MA around $709, after rejecting the $708–$710 area
RSI has reset to ~50, stochastic is near 22 & MACD has only just slipped fractionally below its signal
Volume Friday was ~33M vs roughly 39M average
The decline still hasn’t shown convincing expanding-volume seller follow-through
A Monday rally from $713 to $716–$718 would still fit perfectly inside the corrective structure
NASDAQ:QQQ needs to reclaim approximately $720–$722 & hold it before I’d classify the move as a meaningful bullish MSS
Conversely, I wouldn’t short merely because NASDAQ:QQQ trades $708–$709 intraday
We’ve already seen that liquidity swept & defended
I want a close/acceptance below roughly $708 followed by inability to reclaim $710
Would finally give sellers the confirmation they’ve been missing
The AMEX:SPY & AMEX:IWM charts are somewhat healthier than NASDAQ:QQQ
AMEX:SPY remains above its rising intermediate average around $753, while AMEX:IWM closed around $300, well above its ~$295 intermediate average
AMEX:IWM also outperformed Friday
A genuine macro risk-off move caused by yields normally shouldn’t leave small caps conspicuously outperforming indefinitely
If AMEX:IWM starts losing $295 while AMEX:SPY loses $752–$753 simultaneously with NASDAQ:QQQ
losing $708, the bearish signal becomes much stronger
Monday–Tuesday
I expect positioning/compression more than a decisive trend
The calendar is comparatively light, although geopolitical/oil developments remain capable of moving yields & risk assets
A $710–$720 NASDAQ:QQQ range wouldn’t surprise me
Wednesday morning
This is the first major regime test
Core PCE, Q2 GDP second estimate, durable goods, income & spending together at 8:30 AM EST
Current expectations include 0.2% MoM core PCE & 1.5% GDP growth
The reaction function is particularly important because of the 4.7%+ 10Y
A benign PCE print that pulls yields lower would remove the biggest immediate obstacle to
NASDAQ:QQQ
In that situation, $720–$722 could break quickly
Hot PCE + another yield breakout would be the dangerous combination
If that occurs while NASDAQ:QQQ is sitting near $708–$710, I’d expect support to have substantially less chance of surviving
Wednesday after the close brings the second major catalyst — NASDAQ:NVDA earnings
Consensus expectations are extraordinarily high
Current previews put revenue around $92B & adjusted EPS around $2.10, with investors focused heavily on next-quarter guidance & gross margins
Options are pricing approximately a ±6% NASDAQ:NVDA earnings move
A normal NASDAQ:NVDA beat may not be sufficient
The market appears to expect a beat & raise
Guidance & margins will probably matter more than simply exceeding the headline EPS/revenue consensus
So my NASDAQ:NVDA reaction framework
Major beat + strong guide + stable/improving margins — semi squeeze → NASDAQ:QQQ
$720/$728 & potentially $734
Beat + merely inline guide — expect the initial pop vulnerable to fade
Beat + margin/forward-guide disappointment — potentially significant AI de-rating
Miss/weak guide — NASDAQ:QQQ $708 → $700 becomes very realistic
Also explains why I wouldn’t aggressively buy NASDAQ:QQQ at $720 immediately before Wednesday evening
The technical breakout could be completely repriced several hours later
Then Friday gives us another major macro test
Warsh at Jackson Hole plus the preliminary payroll benchmark revision
The calendar & current week-ahead previews confirm Jackson Hole runs 27-29 August, with the preliminary payroll benchmark revision Friday
So there are effectively 3 independent repricing mechanisms
Wednesday 8:30 AM EST — inflation/growth → yields
Wednesday 4:20 PM EST —
NASDAQ:NVDA → AI/semi earnings expectations
Friday — Warsh + labor revisions → Fed/rate expectations
VXN/VIX has collapsed substantially from its July extreme
Volatility is no longer commanding the enormous relative premium it did during the earlier tech sell-off
Combined with VIX ~15 & correlation deeply negative, suggests the market is currently treating the weakness as sector/index dispersion rather than systemic liquidation
Another reason I wouldn’t front-run a crash
It’s also why a break of $708 accompanied by VIX >18–20 & correlation moving rapidly toward zero/positive would be especially informative because it would represent a volatility regime change, not merely another NASDAQ:QQQ pullback
Think of $708 as the trapdoor → macro conditions have weakened the floor, but price hasn’t fallen through it
Above $720–$722, especially with 10Y retreating below roughly 4.7%, I’d favor upside toward $728–$730, then $734–$735
Between $710 & $720, I’d treat NASDAQ:QQQ as balance/chop & avoid extrapolating intraday moves
Below $708 with acceptance, particularly if 10Y simultaneously pushes above its recent high, I’d switch decisively defensive & target $700 first, then $691–$695
If NASDAQ:QQQ sweeps $708 again Monday/Tuesday, but immediately recovers $710 while VIX stays contained, I’d interpret that as another failed breakdown rather than confirmation of risk-off
The bigger picture is that the HTF uptrend hasn’t broken while the LTF structure is corrective/bearish, momentum has reset, breadth remains adequate & volatility isn’t confirming panic, but rates are an increasingly serious divergence, so Wednesday is where those signals are most likely to reconcile SPY Aug 24–28: $765 Is Where the Market Shows Its Hand
I probably care more about the SPY chart this week than any individual stock.
Not because SPY will necessarily make the biggest move.
Because it tells me what kind of environment everything else is trading in.
NVDA can have a beautiful setup.
AMD can be sitting perfectly on support.
TSLA can break resistance.
But if SPY starts losing important structure, those trades suddenly have a lot less help behind them.
Right now SPY is sitting around **$767**, after pulling back from the recent high at **$779.37**.
At first glance, that looks bearish.
We had the high.
We had several red sessions.
Momentum cooled.
But I think the bigger daily chart tells a more interesting story.
SPY broke above the previous descending resistance area earlier this month, pushed into new highs, and is now coming back toward the breakout zone.
So I'm not looking at this as a broken market yet.
I'm looking at a market being tested.
And the first real test is happening right now.
The 4-hour chart shows the recent decline much more clearly.
SPY came down from $779, lost $772, lost $769, slipped through $765 briefly and touched roughly **$762** before buyers finally reacted.
Now we're back around $767.
That bounce matters.
But I don't think one bounce proves anything.
The market has to show whether $765 can actually hold when sellers come back.
That's the number I keep coming back to.
The GEX map is packed very tightly around current price.
I have important levels around **$763, $765, $766, $768, $769, $772 and $773**.
That's a lot of positioning inside only ten dollars.
When I see something like that, I don't expect every level to produce a major reversal.
What I expect is friction.
Price may spend time moving back and forth through these levels before one side finally gets enough control to push away from the cluster.
The strongest immediate level below price appears to be around **$765**.
That makes sense with the chart too.
SPY already tested below it and recovered.
Now I want to see what happens on the second test.
If $765 keeps attracting buyers, the first upside area I care about is **$768 to $769**.
Above that, $772 becomes more important.
For me, getting back above **$772 to $773** would be the first real sign that this pullback may be ending.
That doesn't automatically mean another all-time high.
But it would put SPY back into the upper part of the recent range and give buyers a much better position.
Then the conversation changes.
I start watching the mid-$770s again.
And eventually, **$779.37** comes back into view.
What I don't want to do is call SPY bullish simply because it bounces from $765 to $768.
That's still inside the same battle.
The more meaningful move would be getting through the upper part of this GEX cluster and staying there.
The downside is where things become more interesting.
If SPY loses $765 again and this time cannot recover it, **$763** is next.
After that I have **$761 to $760**.
The recent 4-hour low is roughly **$761.99**, so this isn't just an options level.
It's actual price structure.
That makes the $760 to $762 area important to me.
If buyers defend it again, SPY can still spend more time consolidating without doing serious damage to the larger setup.
But if $760 fails cleanly, I think traders need to stop treating every dip as an automatic buying opportunity.
The daily chart has another important area underneath, around **$758 to $759**.
Below that, the larger breakout area near **$751 to $752** becomes much more relevant.
That is where my view would start changing more seriously.
SPY can pull back from $779 to $765 and still be healthy.
It can even test the upper $750s and still keep the broader structure alive.
But if we start losing the entire breakout area around $751 to $758, then this is no longer just a routine pullback from the highs.
The market would be telling us something different.
The 4-hour RSI is sitting around **42**.
That's another reason I'm not interested in making an extreme call here.
Momentum has weakened, but SPY isn't deeply washed out.
There is room for another leg down if sellers regain control.
There is also enough stabilization here for buyers to build a bounce.
So for August 24–28, I'm not coming into the week with a prediction that SPY must make a new high or must correct.
I'm watching how the market behaves around a very small area.
**$765 is the center of the fight.**
Above $769, buyers start improving their position.
Above $772 to $773, I take the recovery much more seriously.
Back near $779, we're talking about the highs again.
Below $765, I start watching $763 and $760.
Below $760, the upper $750s matter.
And if SPY eventually loses the larger $751 to $758 breakout area, I would become much more cautious with bullish setups across the rest of the market.
That's why SPY is probably the first chart I'll look at every morning this week.
I'm not asking it to tell me whether the market is bullish or bearish for the rest of the year.
I just want one answer.
Can buyers keep defending **$765**, or was the bounce from $762 only buying them a little more time?
SPY Weekly Market Report — Preparation > PredictionWe have a very tradable week developing, but that does not mean I know which direction the market is going.
That distinction matters.
The 15-minute chart appears to have broken the short-term downtrend that developed off the recent highs. That gives the bulls something to work with, but it is only the beginning of the repair process.
SPY finished around 765.70, and the important structure above us is stacked pretty clearly:
769 → 771 → 772 → 773 → 776
Below us, 766 is the immediate battlefield. If the repair fails and downside structure begins rebuilding, 758/756 become increasingly important.
Current Scenario Weighting
🟢 Green — 35%
The 15-minute trend break holds.
A constructive futures session or modest gap higher Monday could help confirm that something has changed. From there, reclaiming 769 would be the first meaningful step.
The bigger test is 771–773.
If SPY can reclaim that area, hold it, and begin establishing structure above it, the repair becomes much more convincing and 776 comes into play.
From there, a week-long grind back toward 780 is absolutely on the table.
Notice the wording:
reclaim → hold → build structure
I am not interested in blindly chasing SPY because it traded through a line.
🟡 Yellow — 32%
There are actually two ways Yellow can develop, and this may be the most frustrating scenario.
The first is a bull trap.
SPY breaks higher, potentially works into 769–773, gets everyone convinced the correction is over... and then loses the breakout and works back down.
The second is basically the opposite.
SPY breaks lower, loses the immediate structure, gets everyone convinced another major selloff has started... only to reclaim the breakdown and recover.
Either version could create a lot of movement while SPY ultimately finishes the week not terribly far from where it started.
With the amount of major information coming this week, I would not be surprised to see both bulls and bears get trapped at different points.
🔴 Red — 30%
The 15-minute trend break fails.
SPY loses the immediate 766 area, cannot repair it, and begins rebuilding bearish structure underneath.
That would make the recent bounce look increasingly like a failed recovery rather than the start of a new leg higher.
If that happens, 758/756 become much more important.
The key again isn't merely touching those prices.
I'm watching how price behaves when it gets there.
🟠 Orange — 3%
This is the technical term for: “Oh F***!”
A geopolitical shock, unexpected economic development, violent repricing in rates, major earnings surprise, or something nobody currently has on their bingo card blows through the normal map.
I map this because literally anything can happen in markets.
But Orange is different from Red.
Red is orderly deterioration that I can potentially trade.
Orange is disorder.
And personally, I will not short the initial sky-is-falling move.
I've learned that lesson the expensive way.
If Orange happens, my priority is protecting capital, letting the initial shock play out, and waiting for the market to rebuild enough structure that I can actually measure risk again.
The good news: almost everything else is tradable
This is the part I really want people to understand.
I don't need Green to happen.
I don't need Red to happen.
I don't need my highest-weighted scenario to be correct.
Green can produce trades.
Yellow can produce trades.
Red can produce trades.
The market decides which environment we get.
Time determines where and how we participate.
The larger scenario map gives us the battlefield.
Then I drop to the 5-minute chart and look for the actual evidence required to risk capital.
That is where HD Options Signals comes into the process.
It isn't there to tell us:
“BUY CALLS NOW.”
It's there to help organize the evidence while we evaluate things like structure, VWAP, momentum, regime, confirmation and whether the setup is actually tradable.
Combine that with these larger weekly maps and the Premarket Prep each morning, and we should have a pretty solid navigation system regardless of which path SPY eventually chooses.
The goal isn't predicting the week Sunday night.
The goal is making sure Monday morning isn't the first time we've considered what might happen.
This analysis will change
These are my current scenario weights:
🟢 Green 35%
🟡 Yellow 32%
🔴 Red 30%
🟠 Orange 3%
They are not permanent.
Futures will give us new information.
Monday's price action will give us new information.
The behavior around these levels will give us new information.
And we have major catalysts throughout the week that can change the market's perspective very quickly.
So I'll continue updating the map during the week.
Changing the analysis when the evidence changes isn't moving the goalposts.
It's the entire point.
And one last thing for everyone who follows these posts:
There are no dumb questions on my pages.
Seriously.
I don't care whether you've traded for 15 years or opened your first chart yesterday.
Ask.
If I know the answer, I'll explain it.
If I don't know the answer, I'm not going to bullshit you.
We'll work together and figure it out.
None of us has this market completely figured out. We're here to learn from each other, become better traders, and hopefully protect a little more capital along the way.
See you in the Premarket Prep.  Long
Long
I found a pattern in 0DTE credit spreads. Then I killed it.Two weeks ago my research engine turned up something that looked real: across 20 configurations of 0DTE credit spreads on 12 markets, only 7 held positive expectancy in all three time splits — and 6 of those 7 were CALL spreads, not puts.
That cuts against how retail trades 0DTE, which is overwhelmingly put-selling. It was tempting.
But I had looked at all 20 configurations before I named the pattern. That is textbook multiple comparisons, and noticing it afterwards does not fix it. So I wrote the test down before running it: eight markets the original never touched, and a decision rule frozen in advance — it replicates only if the median difference is positive AND at least three quarters of markets agree.
Result: median -1.16% of width, 3 of 7 positive. Refuted.
The dispersion shows why. SMH calls beat SMH puts by 7.57 points of width. COIN calls LOST to COIN puts by 11.11. Which side wins is a property of the name, not a law about sides.
One thing did replicate, and it is the boring one: 6 of 7 markets had a net-positive put side. Not 7 — XLE ran -0.33%, and XLE is one of the three where calls "won", so that win came from puts being weak rather than calls being strong.
Also worth knowing from the original 12 markets: nothing cleared +10% net expectancy on either side. Credits look generous on single names — AVGO and TSLA collect 29-32% of width — but fifth-percentile outcomes sit near -70% of width. The tails eat the premium.
The pattern was real in the data that produced it. It was not real anywhere else.
Method notes: real OPRA option bars via Alpaca, 2024-01 to 2026-08, 10:00 ET entry, settled at intrinsic, 50 bps of width assumed for cost. Every figure is percent of spread width per trade. The replication was preregistered and evaluated exactly once.
Hypothetical backtests on research data. Not investment advice. Education 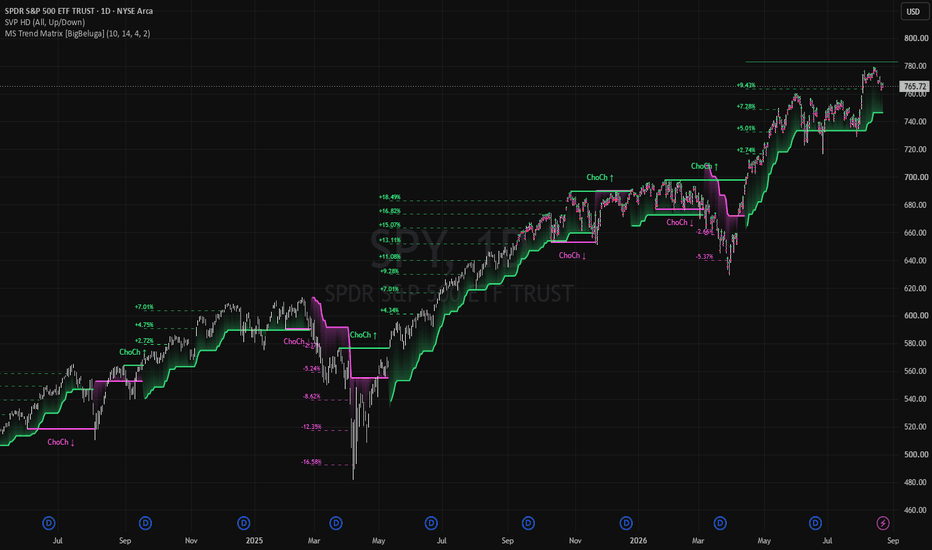
Long