 Long
Long
 Short
Short
 Long
Long
Long 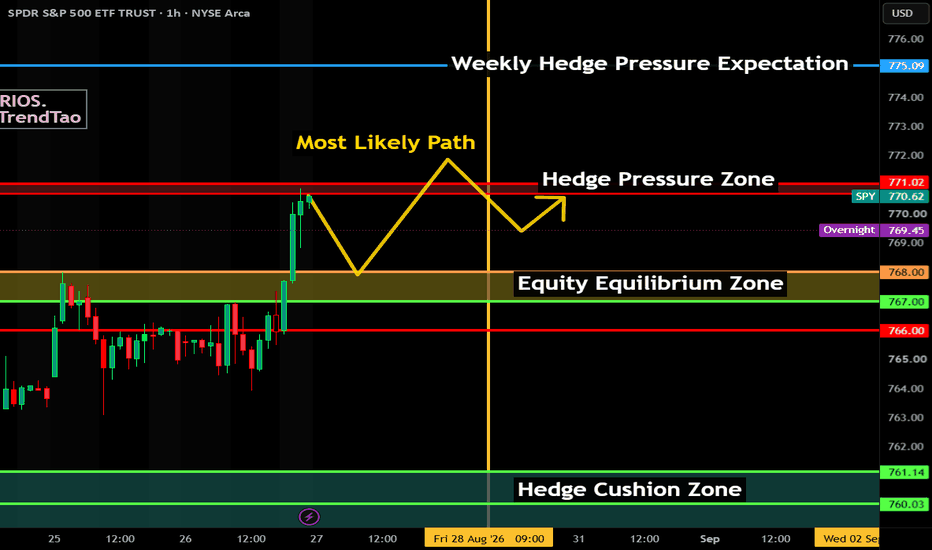
# SPY Aug 27: $770 Is the First Real Test
SPY is giving us a pretty clean setup for Thursday.
The daily chart still looks constructive. The bigger breakout above the old descending resistance is holding, and price has not fallen back into the prior range.
After pulling back from the recent high near **$781.81**, SPY found buyers again and is trading around **$769 to $770** overnight.
That puts price right into the first area I care about.
The 15-minute chart is strong, but it is also getting stretched.
SPY made a sharp move from roughly **$764 to above $770**, and RSI is already around **73**.
So I would not chase the first green candle Thursday morning.
I want to see what happens around **$770**.
The GEX map is packed tightly around current price.
I’m watching **$767, $768, $769 and $770** on the upside.
Below price, the important levels are **$765, $764, $763, $762 and $760**.
That tells me Thursday could be more about how SPY handles a very tight group of levels than about predicting a huge move before the open.
For me, **$770 is the first test**.
If SPY gets above $770 and buyers can hold it, I think the market has room to push back toward the low $770s and eventually challenge the recent highs again.
But I would not treat a quick move above $770 as confirmation.
I want to see price stay there.
If $770 rejects, I’m watching **$769 and $768** first.
Below that, **$767** becomes important.
That area also lines up with the short-term breakout structure from Wednesday.
If buyers defend $767 to $768, I would still consider the intraday structure healthy.
The level that matters more to me on weakness is **$765**.
There is meaningful GEX sitting there, and the 15-minute chart shows price spent a lot of time fighting around that area before the late move higher.
If SPY falls back below $765 and cannot recover it, I would stop treating the pullback as minor.
Then $764, $763 and $762 come back into play.
Below $762, I would start watching **$760**.
That would also tell me something about the rest of my watchlist.
If SPY is holding above $768 to $770, I’m much more comfortable looking at bullish setups in NVDA, AMD, PLTR and the other momentum names.
If SPY starts losing $765 and $762, I become much more selective with calls even if an individual stock still looks good.
That is why SPY matters more than just another chart.
It sets the environment for everything else.
For Aug. 27, I’m watching **$770 on top and $765 underneath**.
Hold $770 and buyers keep control.
Reject it and we probably stay inside the range.
Lose $765 and the tone starts changing.
SPY doesn’t need to make a new high Thursday to stay bullish.
It just needs to prove that this breakout still has buyers behind it.
Long 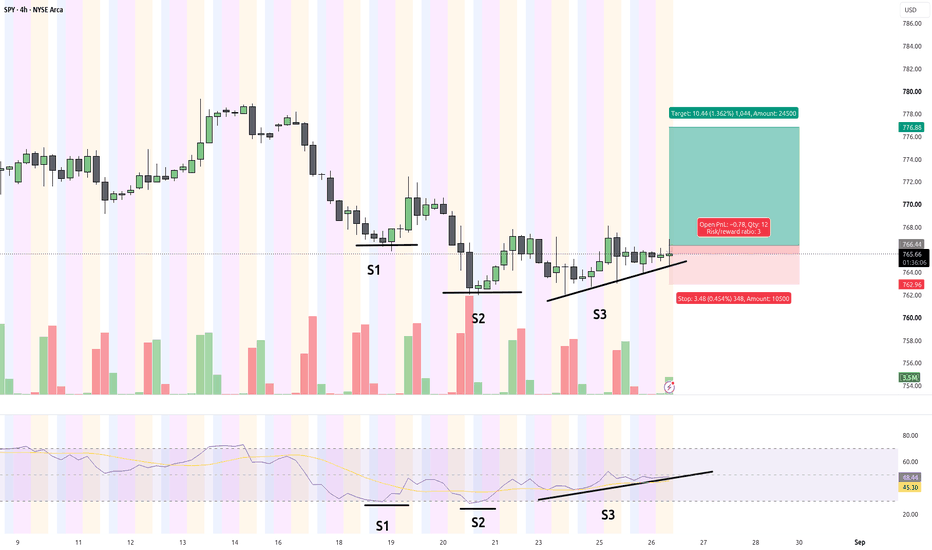
AALG LONG — 1D ALMA Re-entry (WR 83% · avg RR 4.2)█ SETUP
NASDAQ:AALG · 1D · long only.
(Context: AALG — 2× daily American Airlines ETF — levered AAL beta to US legacy-airline tape, jet fuel, and travel risk appetite, not a discretionary “buy the airline dip” call.)
ALMA Averaging Strategy: ALMA 3 / σ2, SD band 2, min diff 1/1, 25% per bar, up to 4 adds, hard stop −10% from average entry.
Strategy Tester (AALG 1D):
Win rate 83% · profit factor 8.9 · max drawdown 5%
Avg winning trade +29.3% · avg losing trade −7.0%
Typical hold ~17×1D bars on winners — levered-airline mean-reversion grid on the daily Averaging template · 41-trade sample
═
█ WHY NOW
Fresh 1D ALMA re-entry on the 24 Aug 13:32 UTC bar ~ $11.63 — lot 1 of 4 after the prior ladder fully stopped 21 Aug ~$11.25 (that cycle opened 14 Aug ~$13.56 and averaged down through 17–19 Aug ).
Same Averaging template, deeper wash into the mid-$11s — bar-close re-arm, not revenge size into the August stop and not a new airline thesis. Hard stop −10% from fill ~ $10.47 . Exits follow Pine ALMA flip + min diff or the hard stop. Scale-in stays 25% per bar, up to 4 adds, if lower bars qualify.
═
█ MACRO
Sector: AALG = 2× daily AAL — beta to US legacy-airline fares, jet-fuel / Hormuz oil tape, capacity discipline, and travel risk appetite more than Mag7 leadership.
Tape (10–25 Aug): levered AAL beta washed with fuel/oil pressure ( 10 Aug sector selloff; 17 Aug BofA PT cut on AAL; 24 Aug TD Cowen PT cut still Buy) while 18 Aug AAL product/premium-seat narrative printed; underlying AAL still soft vs early-Aug highs into late Aug. Research Hub on AALG is thin (no fresh graded issuer cards) — locked AAL brief verdict stays mixed_cautious (fuel sensitivity / profit-gap vs DAL/UAL); Hub also carries early-Aug ops noise (IT delay cluster) already digested in the 26 Aug AAL brief. Execution is 1D ALMA Averaging on the re-arm close — not a fuel, PT, or product forecast.
═
█ OUTLOOK
Factor board from 25 Aug AALG ~ 11.25 (long-score ~22.9 · short-score ~−22.9) — same mid-$11s pocket as the re-entry fill (~$11.63 on 24 Aug ).
Positive factors
- Tester: 83% WR · PF 8.9 · avg win +29.3% vs avg loss −7.0% (avg RR 4.2) · 41-trade sample — fat right tail vs a bounded −10% ALMA stop
- Clean re-entry after a full August strategy stop — process reset at a lower print, not an open loser being averaged in silence
- ALMA — 1D OVERHEAT-S: SHORT · S:12 vs SAvg:4.1 · OVERHEAT-S — daily execution clock heavily stretched below the band into the re-arm
- EMA — 1D Below near the line: Cur S:12 · Dev +0.5% — sell-time stretch with price close to the daily mean into the board
- Underlying AAL board (same tape family): 1D ALMA OVERHEAT-S · Resistance Break bounce-up B 63% ( 21 Aug ) — airline beta repair skew into the levered ETF re-entry
Negative factors
- Prior Aug ladder stopped in ~4 sessions — recent path already tagged the kill-switch; this is a fresh clock, not proof the wash is done
- ALMA — 3D / 1W SHORT still young-to-mid: 3D S:4 vs SAvg:4.0 · 1W S:2 vs SAvg:3.2 — structure clocks not fully stretched; lower adds or the stop can print first
- EMA — 3D Below: Cur S:4 · Dev −1.1% — slow below-session can extend before HTF reclaim
- First lot only (1 of 4) — thin cushion if fuel/airline beta gaps lower before adds qualify
- Score balanced (~23 vs ~−23) — board not one-way; levered ETF amplifies both repair and next wash
- Jet-fuel / Hormuz + near-breakeven AAL FY path can reprice 2× beta faster than the ~17-bar sample hold
Takeaway: the 1D ALMA strategy and 83% WR / 4.2 avg RR support a disciplined first-lot re-arm ~$11.63 after the Aug 21 stop, with 1D ALMA OVERHEAT-S, LTF ALMA LONG flips, and deep weekly EMA discount framing repair fuel — but a fresh clock after a recent full stop, young HTF ALMA SHORT, balanced scores, and thin 1/4 cushion in a levered fuel-sensitive name frame a high-volatility grind, not a clean airline reclaim; nominal risk stays on the −10% hard stop / Pine exit path.
Base case: follow 1D ALMA Averaging · hold/add on qualifying daily closes while the mid-$11s digest · mean-revert toward the prior mid-$12s / mid-$13s shelves if airline beta stabilizes without a gap through the stop.
Bear case: lose the ~$11.0–11.3 pocket · fuel/airline beta gaps lower · template posts −10% toward ~10.5 from the working average · wait for the next bar-close arm.
Chart: NASDAQ:AALG 1D — ALMA Averaging Strategy.
Educational idea. Live position — past backtest ≠ future results. NFA.  Long
Long
S&P 500 Trading Idea | Technical Analysisnstrument: SPDR S&P 500 ETF Trust (SPY)
Time frame: 15-minute chart
Current price: 765.06
Market structure: Price is consolidating between a marked demand zone and supply zone.
Bullish setup
Entry zone: 764.55–764.85, near the demand zone.
Stop-loss: Below 764.40, or below the demand-zone low after allowing for a small buffer.
Targets:
TP1: 766.00–766.10, near the supply zone.
TP2: 766.77.
TP3: 767.73.
Extended target: 768.56.
Condition: Look for a bullish rejection candle, higher low, or strong 15-minute close from the demand zone before entering. Consider moving the stop to breakeven after price reaches the first target.
Bearish setup
Entry zone: 765.90–766.10, only if price rejects the supply zone.
Stop-loss: Above 766.25–766.35.
Targets:
TP1: 764.80–764.55, near the demand zone.
TP2: 763.66.
TP3: 762.63.
Extended target: 761.76.
Condition: Wait for a clear rejection or bearish reversal pattern inside the supply zone. Avoid shorting directly into the demand zone.
Trade plan
The preferred approach is to trade the zone reaction, not the middle of the range around 765.00–765.50. A long setup has better confirmation near demand, while a short setup becomes attractive only after rejection from supply. If neither zone produces a clear reaction, remain flat and wait for the breakout confirmation.
Risk note: This is an educational chart-based idea, not financial advice. Keep position risk small and verify the actual SPY price, spread, liquidity, and market conditions before placing any trade. Long 
SPY Midweek Update — The Market Is Running Out of RoomWe came into this week with several possible paths mapped for SPY.
Two sessions in, the market still hasn’t committed to one.
That does not mean nothing has changed.
It means the evidence has narrowed the battlefield.
SPY is currently trading around 766, sitting directly in the middle of a cluster of levels that have repeatedly mattered:
764 Projected AOA
765 Projected AOA
766 Projected AOA
PDH near 767
769 Projected AOA
That is a lot of structure packed into a relatively small area.
And that helps explain what we have seen over the last two sessions:
negotiation.
Neither side has been able to establish sustained acceptance away from this region.
The Green Path
Green remains the orderly bullish continuation scenario.
The first step is still holding the 765–766 area and then reclaiming PDH around 767.
Above that, 769 becomes the important structural test.
If SPY can reclaim 769 and begin building structure above it, the chart opens considerably.
That would put the 770–773 region back in play and create the possibility of a broader continuation into the end of the week.
The important word is structure.
A candle trading above 769 is not enough.
I want to see the market demonstrate that buyers are actually willing to continue paying higher prices after getting there.
The Yellow Path
Yellow remains the negotiation scenario.
SPY could continue rotating between roughly 764 and 767, repeatedly testing both sides without producing sustained expansion.
Given the number of major catalysts still ahead this week, this would not surprise me.
Markets sometimes compress before they expand.
And Wednesday alone brings both major economic data and Nvidia earnings.
So continued chop before one of those catalysts would make perfect sense.
The Red Path
Red begins gaining weight if SPY loses 764 and cannot quickly repair it.
Below there, PDL around 763 becomes extremely important.
A clean loss of PDL followed by acceptance underneath it would materially weaken the current structure.
From there, the downside becomes much less crowded with nearby support.
That does not mean price automatically collapses.
It simply means the market would have removed several layers of support that are currently keeping the auction contained.
And Now There Is Blue
I’m adding one small tail-risk scenario to the upside.
🔵 Blue — past your structure
There are currently unconfirmed reports of a possible U.S.–Iran ceasefire circulating.
I am specifically emphasizing unconfirmed.
Official reporting still describes an environment of sanctions, diplomatic efforts and attempts to prevent further escalation — not a completed ceasefire agreement.
But if a credible ceasefire or meaningful de-escalation agreement were suddenly confirmed, that could create a completely different type of market reaction.
Blue is not Green.
Green is:
reclaim level → hold → build structure → continue.
Blue is:
headline hits → market reprices immediately → SPY blows through multiple resistance levels before normal structure has time to form.
Something like:
769 → 773 → 776+ very quickly
would qualify.
That does not mean chase calls.
It means the normal scenario map has been temporarily overwhelmed by a catalyst and we need to let the market establish new structure before deciding what comes next.
Blue stays low probability until something is actually confirmed.
The Macro Backdrop
The environment outside the chart is becoming increasingly important.
Oil has fallen sharply today and Treasury yields have eased, both of which have helped equities stabilize and supported the tech rebound.
But the biggest scheduled catalysts are still ahead.
Wednesday morning: GDP/PCE-related economic data.
Wednesday after the close: Nvidia earnings.
Friday: Fed Chair Kevin Warsh at Jackson Hole.
NVDA in particular matters because of its weight in the major indexes and because the entire AI complex has been under pressure recently.
That means the relatively tight structure SPY is sitting in right now probably should not be mistaken for a quiet week.
The market may simply be waiting.
Current Scenario Weighting
Based on the chart as it sits now, I’d currently lean:
🟢 Green — 32%
Hold 765–766 → reclaim PDH → 769 → build structure higher.
🟡 Yellow — 35%
Continued negotiation and false breaks inside the current structural cluster.
🔴 Red — 29%
Lose 764 → lose PDL → failure to repair opens lower structure.
🔵 Blue — 4%
Unexpected catalyst-driven upside expansion that blows through the normal resistance ladder.
Those numbers are not promises.
They are simply my current weighting of the available evidence.
And they will change if the evidence changes.
What I’m Watching Next
For me, SPY is sitting at a very clean decision area.
Above 769 with structure: bullish evidence improves significantly.
Between 764 and 769: negotiation continues.
Below 764 / PDL: bearish evidence strengthens.
Major geopolitical de-escalation headline: be prepared for Blue.
I do not need to know today which path ultimately wins.
I just want to make sure none of them surprises me when it does. Research 25.08.2026🌏 Markets:
AMEX:SPY +3.60 0.47%(pre/m)
NASDAQ:QQQ +6.76 0.96%(pre/m)
🆕 Economic News:
08:15 USA – ADP Employment Change Weekly
09:00 USA – S&P/Case-Shiller Home Price
10:00 USA – Consumer Confidence
10:00 USA – New Home Sales
16:30 USA – API Crude Oil Stock Change
📈 Gap Ups
Reaction to earnings/guidance:
NYSE:GFI TSX:BNS
Other news:
Raymond James upgraded NASDAQ:AMD from Outperform to Strong Buy and lifted its price target to $641 from $565.
NASDAQ:SPCX Stock Rises as Nvidia NASDAQ:NVDA Space Chip Paves Way for Musk’s Orbital AI Ambitions
JPMorgan sees Nokia NYSE:NOK as an underappreciated AI and cloud beneficiary, with its order pipeline pointing to stronger 2027-28 earnings, Sees 100% Upside, keeping an Overweight rating and a $21 price target.
NASDAQ:NBIS Raises $5.8B in Debt, Beating Initial Target
Former House Speaker Nancy Pelosi revealed a significant acquisition of the NYSE:BE shares and options in fresh financial disclosures on Monday.
UBS upgraded NASDAQ:FLNC to Neutral from Sell and raised its price target to $12.00 from $9.00.
NASDAQ:RCON Wins RMB 9.6 Million Oilfield Production Informatization System Integration Project
📉 Gap Downs
Reaction to earnings/guidance:
NYSE:DKS NYSE:VIPS ASX:WDS NASDAQ:BZ TSX:BMO
Other news:
NYSE:NKE falls in syphaty to NYSE:DKS
‼️ Additional
Nvidia NASDAQ:NVDA has effectively become a banker for the AI boom, putting the company on potentially dangerous ground. Growing financial commitments could amplify the impact of any downturn — WSJ.
CryptoQuant reports record profit-taking in BTC by “new whales” at current price levels.
The US Treasury is threatening sanctions against parties that comply with Iranian demands when transiting the Strait of Hormuz.
-- The US Treasury imposed sanctions on entities involved in the transportation of Iranian oil.
-- The US will give other countries time to wind down certain trade operations with Iran — US Treasury.
The Fed now holds more than half of all outstanding US Treasuries with maturities of 10–15 years.
🏢 IPO
NASDAQ:ADBT – Advasa Holdings, Inc.
Company operates a fintech platform focused on earned wage access. Its core FUKUPE product lets employees access wages they have already earned before the traditional payday, while integrating with employer HR and payroll systems. The platform is currently live in Japan, with planned expansion into Indonesia and the UAE.
Listing Type: NASDAQ Direct Listing
Ticker: NASDAQ:ADBT
Shares Registered: up to 94.1M
Prospectus Price: $10.00
Raised: $0 — Direct Listing, no new capital raised
LTM:
Revenue: $17.37M
Net Income: $0.95M
Key point:
The $10.00 prospectus price is primarily for Nasdaq listing requirements and may differ materially from the actual trading price after the direct listing.
Comparable public companies: NASDAQ:SOFI , NYSE:NU , NASDAQ:PAYO , NYSE:FOUR , NASDAQ:DAVE , NASDAQ:UPST
📋 List of tickers involved:
NYSE:GFI TSX:BNS NASDAQ:AMD NASDAQ:SPCX NASDAQ:NVDA NYSE:NOK NASDAQ:NBIS NYSE:BE NASDAQ:FLNC NASDAQ:RCON NYSE:DKS NYSE:VIPS ASX:WDS NASDAQ:BZ TSX:BMO NYSE:NKE NASDAQ:ADBT NASDAQ:SOFI NYSE:NU NASDAQ:PAYO NYSE:FOUR NASDAQ:DAVE NASDAQ:UPST
Best regards – hi2morrow team.


