Short
Short
 Long
Long

 Long
Long
Long 
Long 
QQQ DIAMOND PATTERNBelow $695.25 we get a symmetrical move lower
Diamond patterns typically are symmetrical results.
QQQ is in a corrective consolidation after a strong uptrend, trading below recent highs with momentum indicators tilted mildly bearish but long‑term trend still up.
Chart highlights:
A sharp prior uptrend from late March into early June, followed by a broadening/diamond‑like consolidation pattern with lower highs and higher lows.
Price oscillating inside that diamond and recently slipping toward the lower half, with a projected downside arrow toward the mid‑600s or lower, plus elevated volume spikes on some down days.
This structure suggests distribution/indecision at the highs, where a break of the lower boundary could trigger a deeper correction; conversely, a breakout above the upper boundary would invalidate the bearish scenario.
Current trend and levels
QQQ recently made an all‑time closing high around the mid‑740s in early June 2026 before pulling back.
It is now trading in the low‑710s to mid‑720s range, below that high yet well above its 52‑week low near the mid‑540s, so structurally it remains in a long‑term uptrend despite the pullback.
Over the past year, the average price has been around the low‑600s, showing that current levels are still extended versus the longer‑term mean, which increases the risk of a mean‑reverting correction.
Momentum and short‑term bias
Daily technical readings have shifted from overbought to neutral/bearish, with indicators such as RSI leaning toward “sell” territory, consistent with your idea of a consolidation that may resolve lower.
Recent sessions show lower highs and a series of tests of support zones around the low‑700s, signaling waning buying pressure while sellers sell into strength.
However, volatility remains moderate and there is no evidence yet of a full trend reversal on higher time frames; rather, this looks like an overextended market pausing or correcting within a larger uptrend.
Key support and resistance
Major resistance: the recent high near 745–750; a daily close back above that region would signal the bulls have regained control and would likely invalidate a bearish diamond breakdown.
Near‑term resistance: the mid‑730s, which recent analyses identify as a level that, if reclaimed, opens a retest of the highs.
Immediate support: the low‑700s, where recent lows and volume clusters align; a decisive breakdown here would open the door to the high‑600s and potentially toward the 52‑week price midpoint around the low‑600s. $KBE ETF (U.S. Banks): Coiled for Direction, but where?
KBE ETF (U.S. Banks): Coiled for Direction, but where?
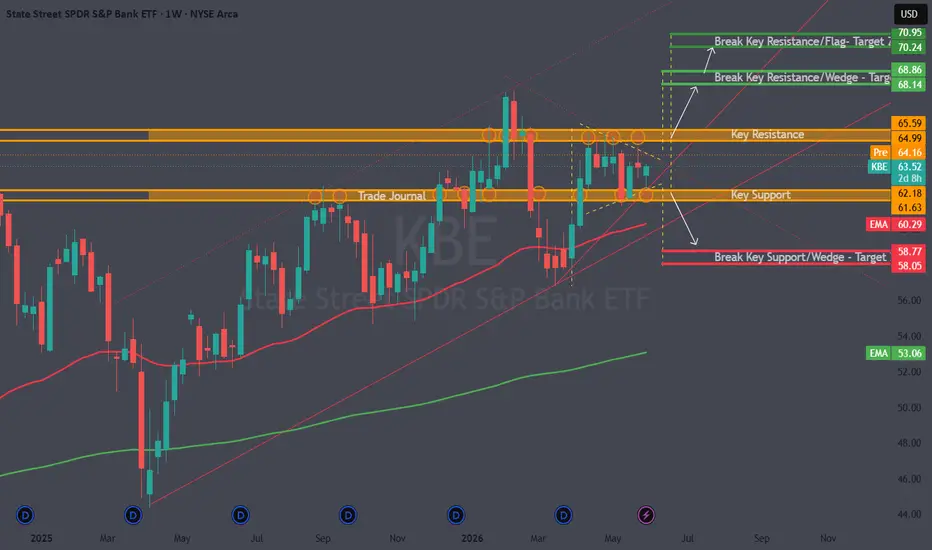
The U.S. banking sector, as tracked by KBE, has spent an extended period consolidating—coiling within a tightening range as the market awaits a decisive directional catalyst. For traders, the key is not prediction, but preparation. The opportunity lies in recognizing the setup and being ready to act once direction is confirmed.
Understanding the Cycle
Bank stocks are highly cyclical and tend to move in response to a combination of macroeconomic and financial conditions.
Banks typically outperform when:
Yield curves steepen, improving net interest margins.
Economic growth accelerates, driving loan demand.
Credit conditions remain stable with low default rates.
Financial conditions ease, supporting capital markets activity.
Regulatory or fiscal environments are supportive of lending and balance sheet expansion.
Conversely, banks tend to underperform when:
Yield curves flatten or invert, compressing margins.
Recession risks rise, increasing loan loss provisions.
Credit stress builds across consumers or corporates.
Liquidity tightens or funding costs increase.
Policy uncertainty or regulation weighs on profitability.
Technical Structure
From a technical standpoint, KBE is currently compressing within a wedge/flag formation—typically a precursor to expansion in volatility.
Key support: 61.63
Key resistance: 65.59
Price action is trading higher in the pre-market, approaching the upper boundary of this range. A confirmed breakout above resistance would signal potential continuation to the upside, while a breakdown below support would shift the structure bearish.
Trade Framework
This is a classic “coiled spring” setup. As traders, the focus should be on reaction rather than anticipation.
A breakout above 65.59 with confirmation (volume, follow-through) opens the door for upside continuation.
A breakdown below 61.63 would invalidate the bullish structure and favor downside positioning.
Until then, patience within the range is key.
While there is a slight upside bias given current pre-market strength, confirmation remains essential before committing to directional exposure.
Trade Journal | Trade what you see, not what you think.
 Long
Long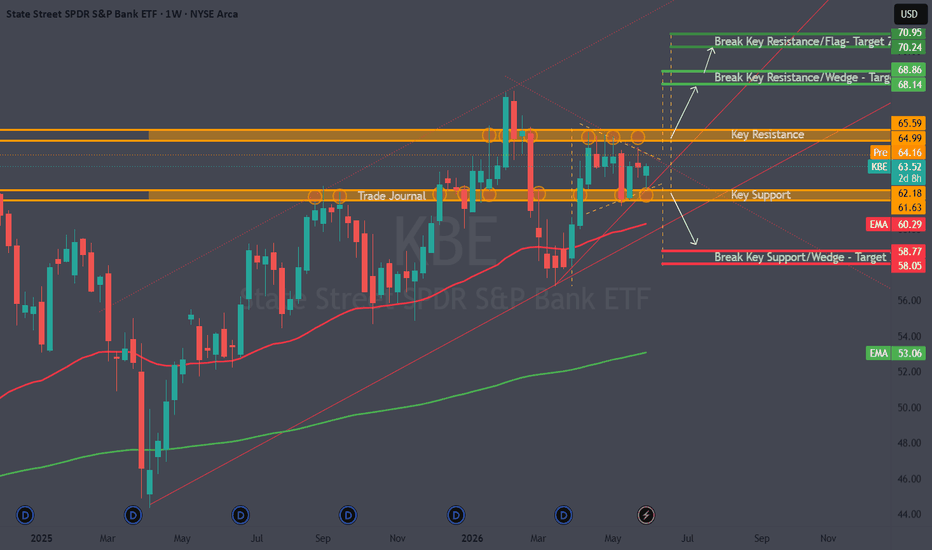
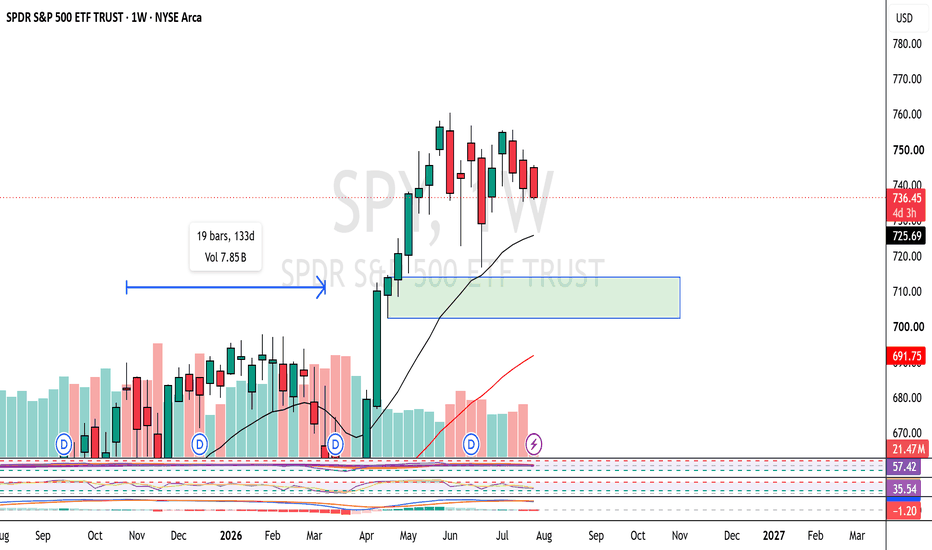
SPY Rejected 748 A Sixth Time And Slid Back.SPY Rejected 748 A Sixth Time And Slid Back.
Speaking back to Monday: the sixth run at 748 needed a close above to mean anything, and it did not get one. SPY rejected 748 again, slid back through 740.44, and is trading 738.72 - back below the level it reclaimed, with the reclaim itself now in question. The daily still carries a bullish thesis and a fresh high-conviction announcement, but on the hourly it is back inside the mess between 735 and 748. Six failures at 748 is a ceiling; back under 740.44 is a warning. Neutral.
Resistance: 740.44 - the reclaimed level, lost again
Key resistance: 748.00 - the six-time ceiling
Current price: 738.72
Support: 736.87 - first support
Key support: 735.21 - the trap low
Structural floor: 731.04 - the deeper shelf
Two paths from here:
It reclaims 740.44 again and holds the range. The daily is still bullish and the announcement conviction is still top-quartile. If SPY reclaims 740.44 and bases, the range holds and 748 comes back into view for a seventh, better-rested attempt. The higher-timeframe bull is not dead yet.
It loses 735.21 and the range breaks for real. Back below 740.44 after six failures at 748, with NVDA collapsing and BTC breaking its floor, the path of least resistance is down. A loss of 735.21 confirms the range break and opens 731. The cross-market risk-off is the context that matters here.
SPY could not close above 748 on its best-supported try, and it is back below 740.44 while the rest of the board breaks down. The bullish daily keeps it two-sided, but the burden is now fully on the bulls to reclaim 740.44 and hold it.
Built with SYNTHESIS v3.3 | SOM / ACE / IMP / SYNTHESIS
Study, not financial advice.  Long
Long
Cycle Fundamentals II: Translating cycles into price projections📊 In Part 1, we explored the idea that cycles may exist in price data. This naturally raises the next question - what could we do with this information? The half-span offset, again from J.M. Hurst's seminal work on cycles, can help turn a measurable cycle into a projection that can be acted on.
🧠 In many ways, the concept is straightforward.
Step 1: Identify a cycle and measure it top to top or bottom to bottom. In the stylized image above, that is a 20-week cycle
Step 2: Take a copy of the cycle/chart and shift it forward by half of its length. 10 weeks in our example
Step 3: Proceed to analysis. Where the original and the shifted cycle cross should mark the halfway point of the advance or decline and forms the basis of the projection. Taking a measure of the distance from the preceding high or low to the crossing - and projecting the same distance beyond it provides an indication of where the move may complete
🎯 The third panel applies this process to the illustrative chart from Part 1. Here, driven by the underlying cycles in the data, the projection logic flags zones where tops and bottoms are worth watching for. In theory, identifying the halfway point on the cycle should give the trader or investor an estimate of how large a move may be, and how long it may take based on the fulfillment of the cycle. Of course, this is a highly stylized example and cycle projections should not be viewed as a matter of fact. The projection is a possibility to be considered. Cycles can also change (or be mis-identified) and quickly become. Crossing back below a projection line can serve as a clear from of "invalidation" of the projection and provide insight into stop-loss positioning and trade sizing (we will discuss this further in a future post).
📌 In Part 1 we posited that cycles may underlie some familiar chart patterns and market behavior. In Part 2 we have put forward a methodology that can help unlock valuable price projection insights for consideration by the trader. In Part 3, we will start to get practical – translating Hurst’s “nominal” cycle lengths into trading days. Until then, try taking a look at a well-defined high, measure back to a prior one, and project half the distance forward to see where it lands – could it indicate a turning point? Education 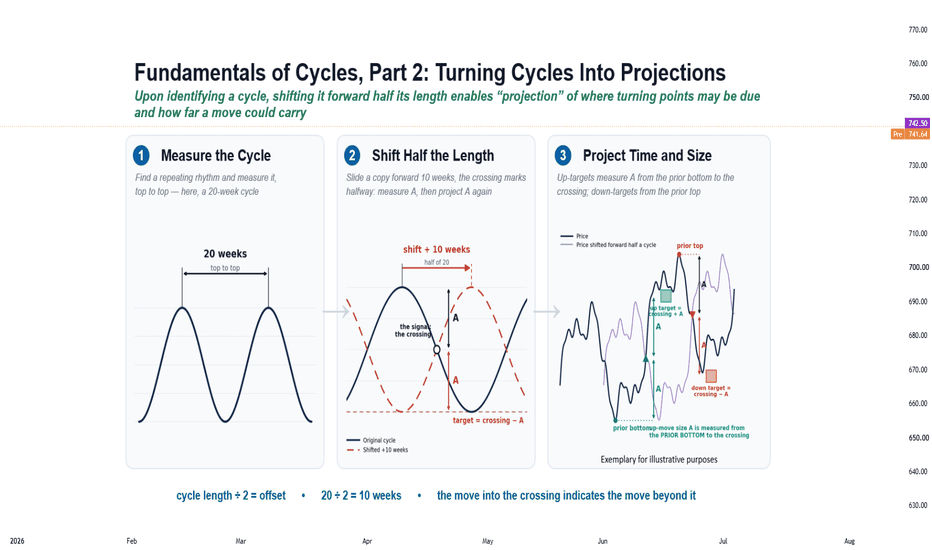
 Long
Long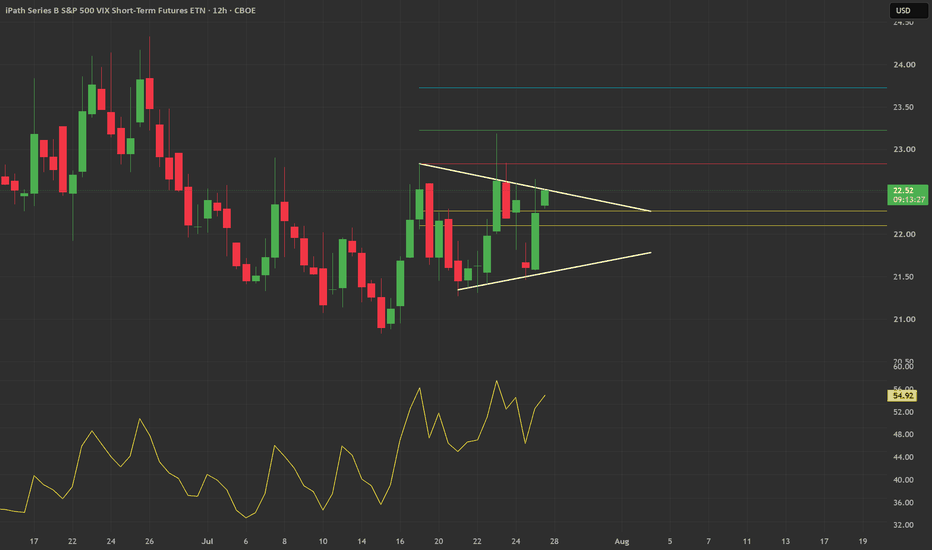
Short 
TIP: Why high inflation won’t save this ETF - July 2026SYMBOL: AMEX:TIP | Direction: Short | Timeframe: 3-Week
Published: July 2026
TIPS are supposed to protect you from inflation. The clue is in the name. Treasury Inflation Protected Securities. So why is this chart signalling a correction?
Because the popular understanding of how TIPS work is incomplete. The inflation adjustment is
real. It is simply not the only thing driving the price of a bond ETF. Duration risk is. Real yields
are. And both of those are moving in the wrong direction for TIP holders right now.
TIP has rallied from the 2022 lows in a well-defined ascending channel. That channel is now
exhausted at its upper boundary. Bearish momentum signals are printing. The 3-week chart is
asking a question that the inflation narrative cannot answer.
On the above 3-week chart TIP has reached the upper boundary of its multi-year
ascending channel with bearish momentum signals printing across multiple oscillators.
Three reasons now exist to expect a corrective move lower. They include:
1) Upper channel exhaustion with a bear pending signal . TIP has been climbing within
a clear ascending channel since the 2022 lows. Price is now pressing the upper
boundary of that channel at ~$107. A Bear Pending signal has printed at this level.
Historically, this break of support has marked every significant reversal in this ETF, including the
2021 top and the 2019 peak. It does not print often, but when it does at an upper channel
resistance, Look left.
2) Bearish divergence across the majority of momentum oscillators. More than half of
the oscillators and momentum gauges on the 3-week chart print bearish divergence at
current levels. Price has made a higher high within the channel. Momentum has not
confirmed it. That divergence is the market’s internal structure signalling that buyers are
losing the argument, even as the price tag says otherwise. RSI is simultaneously testing
the upper boundary of its own ascending channel, a level at which it has repeatedly
turned lower. Mean reversion from here is the higher probability path.
3) Duration risk is running faster than the inflation credit. TIP holds intermediate-term
U.S. Treasury Inflation-Protected Securities with an average duration of approximately 6
years. The mathematics of this matters. A 1% rise in nominal Treasury yields inflicts
roughly a 5–6% price drag on a bond of this duration. The CPI adjustment to principal is
real and it helps, but it does not move fast enough to offset aggressive yield moves.
When the Fed holds rates high, when Treasury supply is heavy, and when real interest
rates rise, the base bond price falls faster than inflation adds to it. The price of TIP
drops. The ETF structure cannot change the maths.
Targets (corrective)
• 1st target: ~$101. Mid-channel mean reversion. Prior consolidation zone.
• 2nd target: ~$93. Lower channel boundary. A deeper correction to this level would
represent a full round-trip to the post-2022 recovery base.
A 3-week close above the upper channel boundary, sustained, would invalidate this setup. That
level is approximately $109–$110. If TIP breaks and holds above there, the corrective thesis is
wrong.
The crowd
The crowd holds TIPS as the inflation hedge. That logic is not wrong. It is incomplete. Retail
investors who own TIP have been told, correctly, that the principal adjusts with CPI. What they
have not always been told is that the ETF price is also a function of its underlying bond prices,
which move inversely with yields and are sensitive to duration. When the two forces work
against each other, the net result depends on the maths, not the narrative.
This idea is not a call that inflation disappears. It is a call that the channel is exhausted, the
signals are bearish, and the duration drag is not being fully priced in. Owning the right
instrument for the wrong reason is still the wrong trade. The chart does not care about the
rationale. It cares about price.
The inflation hedge that falls when inflation is high is not a paradox. It is duration. It has always
been duration. The chart is just the most recent reminder.
Ww
Type: Fixed income / ETF technical | Timeframe: 3–9 months
=============================================
Disclaimer : This idea is for educational and informational purposes only. It is not financial advice. It is not a call that inflation is declining or that TIPS will permanently underperform. TIP is a fixed income ETF that tracks U.S. Treasury Inflation-Protected Securities. The price of this ETF is sensitive to changes in nominal interest rates, real yields, and duration, in addition to inflation adjustments. A rise in nominal Treasury yields will negatively affect the price of this
ETF irrespective of the prevailing inflation rate.
Always do your own research and consult a qualified financial adviser before making any investment decisions. Past performance is not indicative of future results. Short 
 Short
Short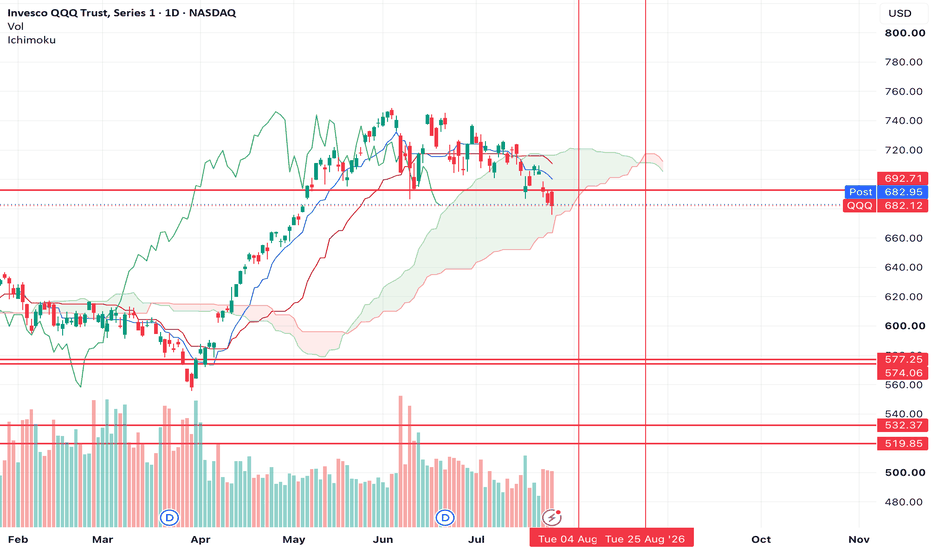
Short 
Week 31 of 52 | Market Open Update #2The market came in with a lot of optimism this morning after oil sold off over the weekend, but we're already seeing that first burst of buying cool off.
Right now, this doesn't look like the start of a "buy everything" rally. It looks more like investors are picking their spots while waiting for the Fed and one of the biggest earnings weeks of the year.
Lower oil is definitely helping. Treasury yields have eased a bit, the VIX is lower, and that's enough to bring buyers back into parts of the market that were hit hardest last week. But if you look under the hood, AI stocks are telling a different story.
That's where my attention is today.
What's actually driving today's move?
Honestly, I think this morning is more about positioning than new information.
Yes, the pause in Middle East tensions helped push oil lower, but everyone already knew that before the opening bell. What we're seeing now is investors deciding where they actually want to put money ahead of the Fed and Big Tech earnings.
If semiconductors can't rally on a day like today, that's worth paying attention to.
Who's leading?
Travel, financials and consumer stocks are having a good morning. Lower oil is an obvious tailwind there.
Technology is green too, but it's not nearly as strong as futures suggested before the open. The biggest drag is still the chip space.
Bond yields are a little softer, the VIX is back below 18, and neither one is flashing stress right now.
Stocks I'm watching
NASDAQ:ASTS is trying to recover after Friday's reversal. The move looks encouraging so far, but I'd like to see it stay above the $58 area before calling the pullback over.
NASDAQ:MSTR is one of the stronger names this morning thanks to Bitcoin pushing back above $65K. As long as BTC stays firm, buyers should remain interested.
NASDAQ:GOOG is finally getting some relief after last week's earnings selloff. Whether that recovery sticks probably depends more on Microsoft's earnings than Alphabet itself.
NASDAQ:AAPL is quietly doing what Apple usually does. It's holding up well, but I think most investors are waiting for earnings before making a bigger move.
NASDAQ:NVDA is the one that stands out—in a bad way. It opened strong and sellers showed up almost immediately. That's not what you want to see if you're bullish on AI this week.
NASDAQ:SMCI looks healthier than Nvidia, but I'd still like to see buyers defend the $30 area.
NASDAQ:MU bounced at the open and then gave almost everything back. After Friday's heavy selling, I think institutions are still reducing exposure rather than adding to positions.
NYSE:NOW continues to impress. Last week's earnings reaction has completely flipped, and it's quietly becoming one of the strongest software names again.
What I'm watching this afternoon
I'm really only focused on three things.
First, can SPY hold onto today's gains? If the opening gap disappears, this could turn into another "sell the rally" session.
Second, I want to see if NVDA and MU can stop making lower highs. If semis stay weak, it'll be hard for the Nasdaq to build real momentum.
And finally, I'm watching Treasury yields. They've been helping equities this morning, but if they start climbing again, today's rally could lose steam pretty quickly. Week 31 of 52 | Daily Market Brief #2Last week reminded everyone how quickly market leadership can change. The AMEX:SPY barely moved, but underneath the surface we saw aggressive selling in semiconductors while money rotated into names like Apple and several defensive sectors. This week is likely to be even more important with the Fed meeting and earnings from NASDAQ:MSFT , NASDAQ:META , NASDAQ:AMZN and NASDAQ:AAPL .
The good news this morning is that geopolitical tensions appear to have eased slightly over the weekend. Oil is trading lower after reports that direct attacks between the U.S. and Iran have paused, and that's giving equity futures a boost before the open. Lower oil also takes some pressure off inflation expectations, which is exactly what growth stocks needed after last week's selloff.
That said, I don't think today's story is really about oil. It's about whether investors are willing to buy technology again before one of the biggest earnings weeks of the year.
The market already told us something important after Alphabet reported. Strong revenue growth wasn't enough. Investors want proof that massive AI spending is turning into profitable growth and free cash flow. Microsoft, Meta and Amazon now have to answer that question too. If they do, last week's semiconductor weakness may end up looking like a healthy reset. If they don't, I wouldn't be surprised to see another round of selling across AI-related names.
Treasury yields remain another key piece of the puzzle. The recent move toward 4.7% on the 10-year has been one of the biggest headwinds for growth stocks. If yields continue moving lower alongside oil, that would create a much better backdrop for technology. On the other hand, if yields reverse higher, today's rally could fade quickly.
Stocks I'm Watching
ASTS — Friday's reversal changed the short-term picture. I'd like to see buyers defend the $55-$56 area before becoming more constructive.
MSTR — Still trading almost entirely with Bitcoin. If BTC can reclaim the mid-$65K area, MSTR should benefit quickly.
GOOG — Last week's reaction wasn't really about earnings quality. It was about AI spending. This week's hyperscaler earnings will either validate that concern or prove the market overreacted.
AAPL — One of last week's strongest mega-cap names. Investors clearly rotated toward Apple, but expectations going into earnings are now much higher.
NVDA — Probably the most important stock on the board again this week. The long-term AI story hasn't changed, but investors want evidence that infrastructure spending continues translating into demand.
SMCI — I'm watching whether last week's pullback finds support around the recent breakout area. Losing that level would suggest momentum is fading.
MU — Friday's selling looked more like institutional profit-taking than a change in the long-term story. I'd like to see the stock stabilize before calling a bottom.
NOW — One of the strongest post-earnings reversals last week. As long as Treasury yields cooperate, software could continue outperforming.
Three Things I'll Be Watching Today
1. Oil after the weekend headlines. If crude continues moving lower, it should remain supportive for equities.
2. Treasury yields. Technology probably won't sustain a rally if the 10-year starts climbing again.
3. Semiconductor leadership. I want to see whether NVDA, MU and SMCI actually participate in today's strength. If they don't, I'd be cautious about chasing the early move.
Disclaimer: This analysis is for educational purposes only and reflects my personal opinion based on current market conditions. It is not financial advice. Always do your own research before making investment decisions. Long