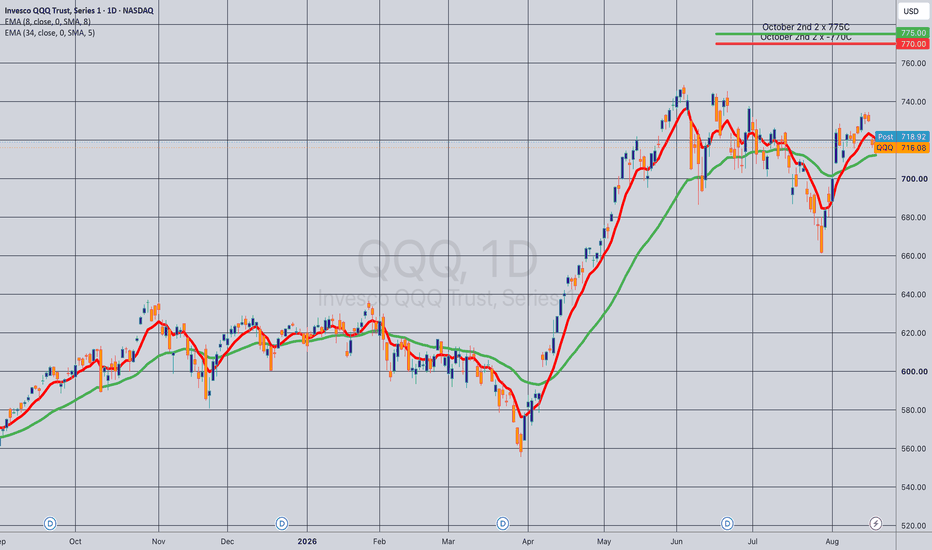
Short
Short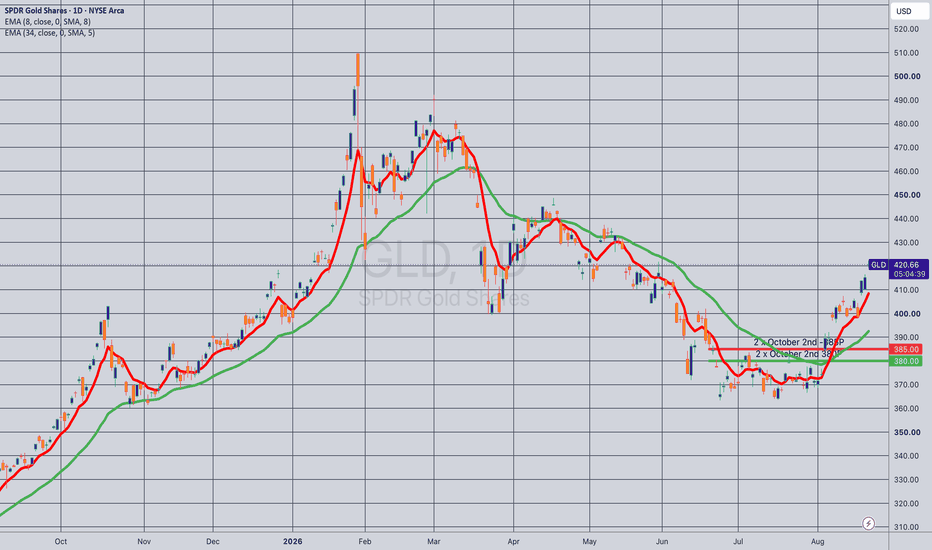
Research 21.08.2026🌏 Markets:
AMEX:SPY +3.57 0.47%(pre/m)
NASDAQ:QQQ +5.60 0.79%(pre/m)
🆕 Economic News:
CRYPTOCAP:BTC has surged 23% over the past two days, while NASDAQ:MSTR is up 35% and NASDAQ:COIN has gained 27%.
📈 Gap Ups
Reaction to earnings/guidance:
NASDAQ:ROST NYSE:BKE NYSE:BEKE NYSE:BJ NYSE:UI
Other news:
AMEX:GDXU — the Gold Miners 3X Leveraged ETN — has surged more than 50% over the past three days.
-- Another sign that investor interest is shifting from one group of risk assets to another: NYSE:HMY NYSE:GFI NASDAQ:HYMC NYSE:NEM NYSE:AEM NYSE:WPM NYSE:AU and others
Nomura, in its latest Asia ex-Japan Daily Research Summary on Friday, highlighted stronger-than-expected operating performance at NASDAQ:NTES NetEase.
NASDAQ:SKHY considers building memory chip plant in Japan, Hankyoreh reports
NASDAQ:JUNS pumping after 1/75 split
NASDAQ:SPCX : Following the lock-up expiration, $45 billion worth of SpaceX shares will become available for trading.
Spotify NYSE:SPOT increased its share buyback program by $1.5 billion.
📉 Gap Downs
Reaction to earnings/guidance:
NASDAQ:OSIS
Other news:
NYSE:BABA Falls as AI Spending Surges 75% and Profit Misses
NYSE:GSK shares kept at neutral by Citi as unproven phase III pipeline curbs long-term growth
‼️ Additional
UBS Global Wealth Management raised its year-end S&P 500 target to 8,100.
Most analysts are bullish on European equities, with a further 10% gain expected by the end of this year — BBG.
China is rapidly narrowing the gap with the US in AI — BBG.
The USD continues to weaken against major currencies.
-- BofA: A failed intervention in the US bond market risks triggering a sharp decline in the dollar.
-- The stakes are now very high for Bessent, as he needs to preserve market stability ahead of the November US midterm elections.
-- BESSENT: THE SIZE OF BUYBACKS OF LONG-DATED BONDS COULD EXCEED THE $4 BILLION ANNOUNCED YESTERDAY.
🔁 Business Combination / De-SPAC
NASDAQ:RFAI – RF Acquisition Corp II / Nanyang Biologics
Nanyang Biologics is a Singapore-based early-stage biotech using AI to discover drug candidates from natural compounds. Its Vecura / DTIGN platform supports a preclinical pipeline led by NB-A002, an experimental oncology therapy targeting ILF2. The company also has cardiovascular and mental health programs, but currently has no approved drugs and no meaningful commercial revenue.
Expected New Ticker: $NYB
Key points:
Nanyang remains a highly speculative preclinical biotech; valuation is based mainly on future pipeline and AI-platform potential rather than an established commercial business
Net Loss: ~$7.22M for the six months ended March 31, 2026
Cash: ~$0.89M as of Sept. 30, 2025
Low-float setup:
Around 3.998M public RFAI shares remained after an earlier redemption
Holders subsequently submitted preliminary redemption requests for 3.956M shares
If nearly all requests remain in place, the remaining public float could theoretically fall to roughly 42K shares
Final redemption amount and float are not yet confirmed because requests can still be withdrawn
Comparable public companies: NASDAQ:RXRX , NASDAQ:SDGR , NASDAQ:ABCL , NASDAQ:TEM , NASDAQ:CRSP , NASDAQ:BEAM
📋 List of tickers involved:
CRYPTOCAP:BTC NASDAQ:MSTR NASDAQ:COIN NASDAQ:ROST NYSE:BKE NYSE:BEKE NYSE:BJ NYSE:UI NYSE:HMY NYSE:GFI NASDAQ:HYMC NYSE:NEM NYSE:AEM NYSE:WPM NYSE:AU NASDAQ:NTES NASDAQ:SKHY NASDAQ:JUNS NASDAQ:SPCX NYSE:SPOT NASDAQ:OSIS NYSE:BABA NYSE:GSK NASDAQ:RFAI $NYB NASDAQ:RXRX NASDAQ:SDGR NASDAQ:ABCL NASDAQ:TEM NASDAQ:CRSP NASDAQ:BEAM
Best regards – hi2morrow team.
 Long
Long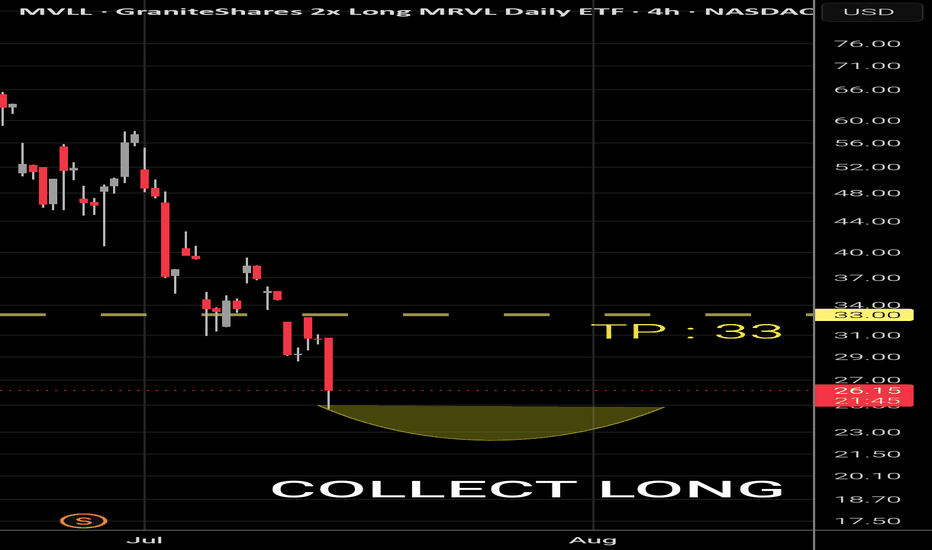
 Long
Long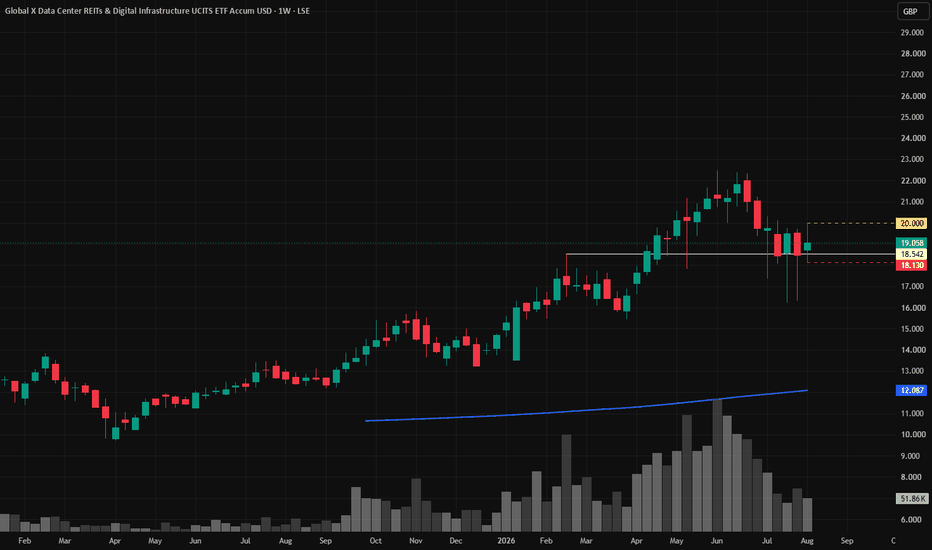
 Long
Long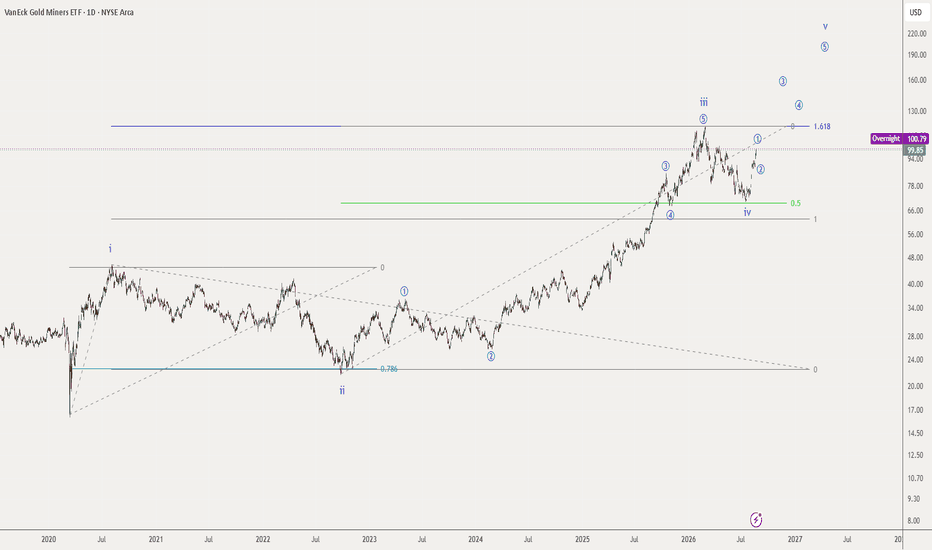
Long 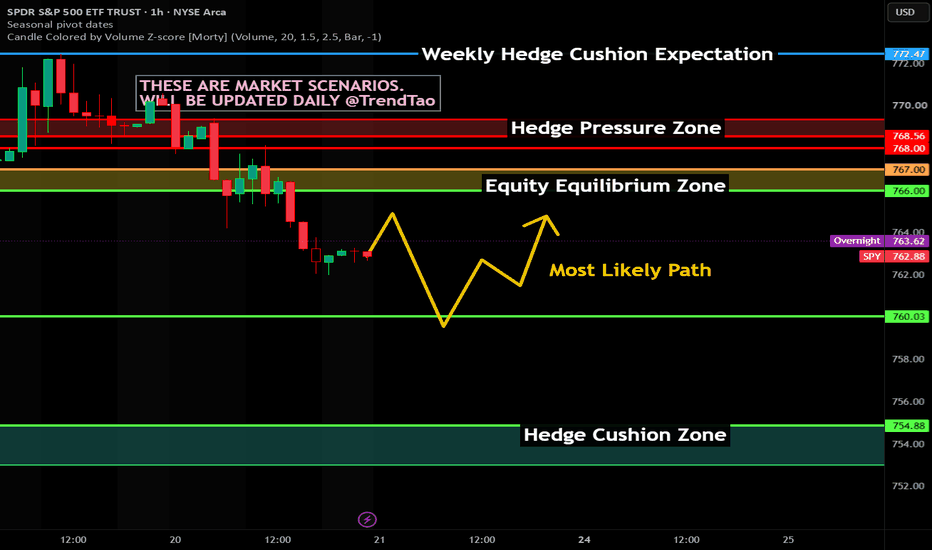
 Short
Short
GLD 15M — Long | 0.5 Retrace Held, Targeting the 1.382 FibGLD 15M — Long | 0.5 Retrace Held, Targeting the 1.382 Reverse Fib at 418.96
Bias: Long Timeframe: 15M — intraday swing, 1–3 sessions Entry: 414.50–415.05 at market, or 413.30–413.60 on a retest Stop: 412.85 (below the 0.5 / 0.541 cluster) T1: 418.00 · T2: 418.96 · T3: 419.74 R:R: ~1.9:1 at market · ~3.5:1 on the retest fill
The structure
Impulse leg runs 409.85 → 416.44, a 6.59-handle range. The pullback bottomed at 413.08 — the 0.5 midpoint — and reversed. That is the whole trade. A retracement that stalls at the midpoint and does not extend toward 0.382 (412.37) or 0.236 (411.41) tells you the sellers ran out of inventory before the buyers ran out of bid. Trend structure is intact.
Price is now 414.93, back above the 0.702 (414.48) and pressing the 0.786 (415.03). Reclaim 415.03, then take out the 416.44 swing high, and the reverse fib extensions become the measured objective.
Levels that matter:
Level Price Role
0.236 411.41 Structural floor — below this the thesis is dead
0.382 412.37 Last-ditch support
0.5 413.08 The pivot. Held. Now support.
0.786 415.03 Immediate resistance — testing now
1.0 416.44 Swing high. Break = trigger
1.236 418.00 T1 — real supply, see below
1.382 418.96 T2 — primary target
1.5 419.74 T3 — measured-move confluence
Why 418.96 is not an arbitrary number
Two independent methods converge on the same zone.
AB=CD. A = 409.85, B = 416.44, C = 413.08. Project AB from C and you get 419.67, which lands on the 1.5 extension at 419.74. The 1.382 target is therefore conservative against the classic measured move — 418.96 to 419.74 is the exit band, not a single price.
Spot confluence. At the current GLD/spot ratio (~0.0928 oz per share), 418.00 maps to roughly $4,506 — effectively the August 13 intraday high of $4,509. That is a genuine supply shelf, not a fib artifact. Expect a reaction there. Scale out at T1 rather than assuming clean passage to T2.
Macro: why the tape is on the right side
The lazy version of this thesis is "Fed cuts, gold rips." That is not what is happening, and the actual setup is stronger.
1. Gold is rallying with long bonds. That is the tell. Gold made its move to $4,480 alongside a rally in long-dated Treasuries, triggered by the Treasury doubling its note and bond buyback and by Bessent pushing for higher limits on the Fed's FIMA facility. Normally a bond rally is gold-negative — it implies disinflation. When gold and the long end rally together because the fiscal authority is managing the curve, the market is not pricing disinflation. It is pricing sovereign balance-sheet risk. That is the debasement bid, and it does not need a rate cut to work.
2. A hawkish Fed that cannot get real rates restrictive. Funds at 3.50–3.75% against a 3.3% 2026 core PCE projection is a real policy rate of roughly 20–45bp. Three regional presidents dissented for hikes in July; nine of eighteen officials penciled in a hike for this year. This is a committee that wants to be restrictive and structurally cannot be, because the long end is doing the tightening and the Treasury is actively suppressing it. Gold prices that gap.
3. Price-insensitive structural bid. Central banks bought 288.9 tonnes in Q2 — up 62% YoY, the strongest Q2 in the WGC series — and they bought it into gold's steepest quarterly decline since 2013. Poland took 51t, the PBoC 33t on a 21-month buying streak. Reserve managers do not chase and do not stop out. That is a bid under the market that does not care about the 15-minute chart.
4. Positioning is washed out. Gold printed $5,500 intraday in January and traded below $4,000 in late June. That is a ~27% peak-to-trough flush. Speculative length was destroyed. The recovery through the 100-day at $4,387 for the first time in over two months is base-building off cleared positioning, not a late-cycle chase.
5. Twin supply shocks. Tariff-driven cost pressure and an unresolved US–Iran conflict are two independent supply-side shocks running simultaneously. That is a harder problem than either alone, it keeps a risk premium in energy, and it keeps the inflation tail fat.
What kills this trade
Structural invalidation: 15M close below 413.08 weakens it materially. Below 411.41 the thesis is dead — don't argue with it. Below 409.85 the entire leg is void.
Event risk — this is the big one. Warsh delivers his first Jackson Hole keynote Friday, August 28, 19 days before the September 16 FOMC, with July PCE landing the same morning. He has stripped forward guidance from Fed communication and has said he is "not constrained by market prices." September hike odds are near one in three. If he pushes back on that pricing, real yields jump, DXY firms, and gold takes a hit that no 15-minute fib will absorb.
The saving grace: this setup projects to target around Aug 21–22, well before the symposium. It should resolve first. Do not carry this as a swing into Aug 28 on fib logic alone — if it hasn't paid by Friday's close, the thesis has changed and the position should be re-underwritten as a macro trade with a macro stop, not held on autopilot.
Valuation headwind: spot is already trading above revised sell-side consensus. JPM cut to a $4,300 Q3 average and $4,500 Q4; BofA cut its 2026 average 14% to $4,360. The WGC mid-year base case is rangebound ±5%. None of that stops a 1% intraday extension, but it argues against extrapolating this beyond 419.74.
Execution notes
GLD trades RTH; spot runs nearly 24/5. Overnight moves show up as gaps at the open, so this fib grid has holes in it. If you want clean levels, mirror the setup on XAUUSD or GC.
Friday close into Monday open is unhedged gap risk. Size for it or flatten into the weekend.
This is a ~1.0% move on the underlying. The macro is context, not the thesis. It tells you which side of the tape to be on. The fib tells you where to get in and where to get out. Do not size this like a macro position because the macro paragraph reads well.
Not investment advice. Positions and views are my own and may change without notice. Levels are current as of Aug 20, 2026, 11:51 UTC-7. Long 
IBIT - Testing Critical LevelIBIT is currently at the most critical level of its current range. Breaking above the $41 to $42 zone in the short term is likely to not be an easy task, and here is why.
The 0.618 Confluence
First, this is the 0.618 of the macro trend:
The Historical Significance of This Level
Second, the market structure that has built around this level is significant. Looking back at the March to October 2024 range, this same price level was the most important zone during that period (red circles). Now price is once again battling that same level, which can be clearly seen on the VRVP:
If you look back at that idea and click play, price is currently trading right around the top of the large volume shelf between $37 and $41. Since price has entered this zone from below, I would expect more selling within this range than accumulation in the short term.
The Bullish Developments Beneath the Surface
That said, it is important to note some other developments occurring at the same time. A bullish divergence has begun playing out on the weekly chart, along with a few other volume indicators that could be showing early signs of trend momentum genuinely shifting toward a sustained breakout.
In the short term, a retracement from this level still seems likely. However, the higher timeframe is signaling that a further breakout could follow. This lines up closely with what Bitcoin has historically shown coming out of its bear markets, and now the Bitcoin related ETFs appear to be developing that same cyclical structure. Is the market tired?This is essentially the same setup as before, just without the momentum oscillator panel and with price ticking at 725.28 instead of 725.39. Same read applies.
Current structure
Price is climbing inside the rising purple channel that's held since the late-July low near 656.13. The smaller yellow zigzag inside it shows the recent swing sequence: low near 690, spike up to ~725, pullback to ~710, rally back toward current price. The blue arrow projects a rally into the 725–730 zone, a rejection, and a drop down toward ~695.
Key confluence for the projected top
The dotted white upper channel line and the descending yellow trendline (extending from the projected ~740 peak) converge around 730–733. That's the same zone as the 729.98 level and the gray supply block sitting just above current price — a logical place for sellers to step back in if the rally continues.
If price rejects here (bearish path)
Failure to clear ~729.98–733 → pullback toward the 718.68 support first.
Loss of that level → test of the 705–710 zone, which has already acted as a higher-low pivot (visible in the yellow zigzag).
Loss of $718 could lead to waterfall.
A clean break of that pivot would open the move down toward 695.25, matching where the blue arrow bottoms out — also close to where the lower channel boundary and the dashed midline converge.
Deeper supports if 695.25 fails
679.35, then 675.78, with 656.13 (origin of the channel) as the major floor.
Resistance stack above current price
725.28 (current) → 729.98 → gray supply block just under 737.62 → 737.62.
What invalidates the drop
A strong close above ~730–733 with continuation would instead favor a push toward 737.62 and possibly the channel top near 740, negating the pullback scenario.
Bottom line
The blue arrow is a technically reasonable pullback scenario — it depends on price stalling at the 729–733 confluence (trendline + supply) rather than breaking through it. Right now price is right at the edge of that decision zone, so the next candle or two closing above/below 729.98 will likely tell you which path is playing out. This isn't financial advice — just a read of the pattern as drawn.
For now we are still leaning to the bullish side.
NVDA earnings should push the semiconductor stocks higher.  Long
Long
Research 20.08.2026🌏 Markets:
AMEX:SPY -1.57 -0.20%(pre/m)
NASDAQ:QQQ -2.30 -0.32%(pre/m)
🆕 Economic News:
CRYPTOCAP:BTC surged 12% over the past 24 hours, rising from $64,500 to $72,500 and triggering a $3 billion liquidation wave.
08:30 USA – Initial/Continuing Jobless Claims
08:30 USA – Philadelphia Fed Manufacturing Index
📈 Gap Ups
Reaction to earnings/guidance:
NASDAQ:BULL NASDAQ:FUTU NYSE:ATHM NYSE:BILL NYSE:DE
Other news:
NASDAQ:MSTR , NYSE:BMNR , NASDAQ:COIN , NYSE:CRCL , NASDAQ:HOOD , NASDAQ:GLXY Stock Extend Rally After Bitcoin CRYPTOCAP:BTC Blasts Past $72K, Triggering $3B Liquidation Wave
NASDAQ:RARE First Gene Therapy Approval
NASDAQ:SKHY Reaches Tentative Deal With Union on Wages
NASDAQ:SGLY Enters Into Non-Binding Strategic Framework Agreement for Potential 900-Acre South Carolina AI Data Center Campus
NASDAQ:WETO continues to pump after its 1-for-100 reverse split. Some analysts are linking the move to the recent IPO of a Chinese robotics company that surged 600%, although the companies operate in different areas.
📉 Gap Downs
Reaction to earnings/guidance:
NASDAQ:WMT GETTEX:AAO NASDAQ:NTES FTMO_OANDA:BABA NASDAQ:IOND NYSE:AEG
Other news:
NASDAQ:SPCX shares continue to fall after the successful landing of a reusable rocket by its Chinese competitor.
‼️ Additional
Bessent has become the most interventionist US Treasury Secretary in decades — BBG.
-- Yesterday, the US Treasury decided to intervene and try to bring down extremely elevated yields in the government bond market by doubling the volume of purchases of long-duration bonds.
-- Trump urged Americans not to worry about volatility in the bond market.
-- Experts say the US Treasury’s red line has now become clear: the 30-year yield at 5.30%.
The US plans to reduce tariffs on metals and autos from Canada as part of a trade agreement, if one is reached — BBG.
-- Mexico is seeking a deal with the US similar to the agreement with Canada — BBG.
PRIME: Japan increased imports of US oil by 814.5% YoY in July.
Moderna shares yesterday posted the largest single-day gain in history among S&P 500 stocks, rising 177%.
🏢 IPO
OpenAI plans to hold an IPO in 2027 — CNBC.
OpenAI competitor Anthropic plans to hold an IPO in September 2026.
Anthropic’s IPO could become the largest in history. The startup could receive a $2 trillion valuation in the listing, the FT previously reported.
📋 List of tickers involved:
NASDAQ:BULL NASDAQ:FUTU NYSE:ATHM NYSE:BILL NYSE:DE NASDAQ:MSTR NYSE:BMNR NASDAQ:COIN NYSE:CRCL NASDAQ:HOOD NASDAQ:GLXY CRYPTOCAP:BTC NASDAQ:RARE NASDAQ:SKHY NASDAQ:SGLY NASDAQ:WETO NASDAQ:WMT GETTEX:AAO NASDAQ:NTES FTMO_OANDA:BABA NASDAQ:IOND NYSE:AEG NASDAQ:SPCX
Best regards – hi2morrow team.
You're too bored to be profitableYou think you need a better strategy.
You don't.
Somewhere in your trading career, you have a strategy you shelved a few months back. There's a system that already works. You backtested it. It held up. Maybe it wasn't glamorous, just 10% more than what the S&P 500 gives a year. It's not the account-flipping holy grail you wanted.
"I just need to find the one that actually works," you tell yourself, opening another YouTube strategy breakdown.
You didn't need a better system. You needed to sit still long enough to run the one you had.
The live market lies
Backtesting and live trading are not the same skill.
Backtesting is fast. You scroll, you tag, you move on. Live trading is slow. It makes you wait for the exact price action your system needs before you're allowed to trade.
That waiting is boring. Especially now, when everything else in your life moves instantly. A notification, a scroll, a like. Then you sit in front of a chart for an hour waiting for one candle to close.
Bored traders break rules
A trader who's bored doesn't sit still. They force a trade that doesn't fit the plan.
They lie to themselves first. "The context is a bit iffy, but this entry kind of fits." It doesn't. You know it doesn't. You take it anyway, because waiting for the real setup felt worse than being wrong.
Here's what that costs you.
Every trade that doesn't match your backtested rules decrease your expectancy and profit factor. Stacked over a course of a few months, they're the difference between the equity curve you tested and the one you're actually trading.
You end up in a drawdown and conclude the system doesn't work. The system was never the problem. The trades outside the system were.
One trade at a time
Don't procrastinate once you have a profitable trading system. Use it.
Take one trade at a time, exactly as your rules say, nothing added and nothing skipped. That's it. That's the whole fix.
Every rule-following trade builds reps. Reps build confidence. Confidence is what lets you sit through the boring stretch instead of forcing something to fill it.
Build the arsenal
Once your first system is running, you've bought yourself something valuable. Time. Now you have the capacity to backtest a second system.
A second system waits for a different setup than your first. Different price action, different conditions, different timing. Run two or three clean systems side by side and there's almost always something legitimate to execute, instead of a boring stretch that tempts you into a trade that isn't yours to take.
That's not chasing a holy grail. That's the actual fix for the boredom that was never going to leave on its own.
Pull your last 10 trades. Count how many matched your backtested rules exactly, entry, stop, and target. If it's under 7, you don't have a strategy problem. You have a boredom problem, and now you know what to do about it.  Long
Long
Short 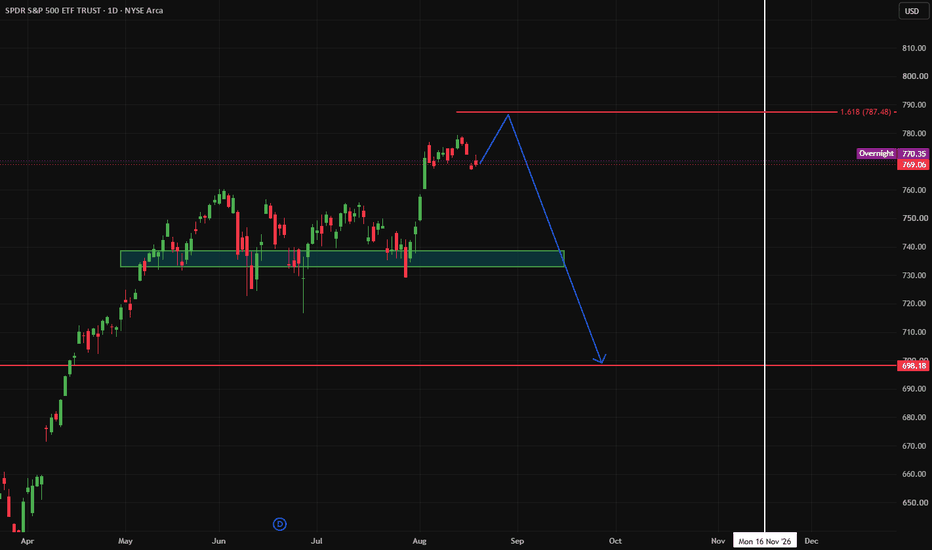
Overview: A Reversal Strategy for Trading on the Daily Timeframe
🍀Overview
● Hi all, I recently completed a Pine Script strategy designed for trading on the daily timeframe.
● I'm not good at technical analysis, so I rely on setups rather than discretionary analysis. I put the rules together into a strategy so the decisions are more systematic.
● The strategy has a few parameters that can be adjusted. I have now finalized them, and the rules will remain unchanged unless a change is necessary.
● Since I only completed the strategy recently, it has already entered positions in some tickers.
● For the initial posts on each ticker, I will describe the setup retrospectively and then continue to follow the trade until the strategy or I exit the position.
● For new setups, I will publish a separate idea as soon as the strategy enters a position and follow the trade until it closes.
● Let's go through the strategy using SPY as an example.
🍀Strategy
Strategy name
● Currently using the generic name "Reversal Strategy"
Script
● Reversal Strategy
Direction
● Long only
Assumption
● This is a long-only strategy. The underlying assumption is that these instruments are likely to grow over time.
● The strategy tries to take advantage of price fluctuations by entering a long position when the stock is at a discount.
● If this assumption does not hold, I don't expect the strategy to work well. That's why I focus on instruments such as SPY and the Mag 7, with others potentially added in the future.
Instruments
● SPY, Mag 7
Timeframe
● Daily
Indicators
● RSI (Relative Strength Index)
○ This is built on top of TradingView's original RSI indicator. It preserves the original RSI calculation and visualization while adding customizable overbought/oversold exit signals directly on the main price chart.
● NATR Oscillator
○ The NATR Oscillator converts Normalized Average True Range into a rolling 0–100 oscillator.
○ NATR is calculated as ATR divided by the current closing price and expressed as a percentage. The indicator then compares the current NATR with the highest and lowest NATR readings over the selected lookback period.
Signals
● Main signal: RSI
○ Long setup: RSI crosses above 30
○ Short setup: RSI crosses below 70
● Confirmatory signal: NATR Oscillator
○ NATR Oscillator >= 80
Scoring
● Main signal: 0.5
● Confirmatory signal: 0.5
● Setup score: Main signal score + confirmatory signal score
● Entry threshold: 1.0
Conditions
● A setup occurs when both signals appear at the same time.
● The strategy must not currently be in a position.
● The strategy enters when the setup score is greater than or equal to the entry threshold.
● One entry, one exit. No scaling in or out.
Risk Management
● Reward-to-risk ratio: 4:1
● Entry: Close of the candle that triggers the setup
● Stop loss: 4x daily ATR
● Take profit: 16x daily ATR
● Manual exit: If an opposite signal or short setup appears, I can choose to exit only when the reward is at least 2R. Otherwise, I will continue holding.
● Order management: Bracket order (limit entry, market stop, limit target)
● Rule: If the entry is not filled and price reaches the target first, the bracket order is canceled. The strategy treats this as a missed setup and waits for the next one.
Visualization
Please refer to the 2nd screen shot.
● Pane 1: Price Chart
○ Shapes
■ Green triangles: RSI crosses above 30
■ Red triangles: RSI crosses below 70
○ Bracket order visualization (a simplified version compared with TradingView's long/short position drawing tools)
■ Green zone: profit zone
■ Red zone: loss zone
■ Middle gray line: entry price
○ Labels
■ Entry label: entry price
■ Stop label: stop price and stop distance
■ Target label: target price and target distance
● Pane 2: Volume Z-Score
○ Shown for completeness and does not affect the strategy.
○ It compares the current volume with its recent average and standard deviation to identify unusually high, normal, or below-normal volume.
● Pane 3: RSI
○ Chart for the RSI indicator.
● Pane 4: NATR Oscillator
○ Chart for the NATR Oscillator.
● Pane 5: Strategy pane
○ Static lines
■ Green line: long setup threshold, currently 1.0
■ Red line: short setup threshold, currently 1.0
○ Dynamic lines
■ Green line: long setup score for that candle
■ Red line: short setup score for that candle
○ Peaks
■ Green peak: a long setup occurs when it touches or crosses the long threshold
■ Red peak: a short setup occurs when it touches or crosses the short threshold
○ Table
■ Ticker
■ Bias: long setup score > short setup score = long bias; reverse = short bias; otherwise tie
■ L/S scores (thres): long/short scores and thresholds on the latest candle
■ Stop/target dist: stop and target distances if entering a position, currently 4x daily ATR for the stop and 16x daily ATR for the target
Alerts
● The strategy fires an alert whenever a setup occurs, long or short, regardless of whether it is currently holding a position.
🍀Example: SPY
As mentioned earlier, I only completed the strategy recently, so I can only analyze this trade retrospectively. Let's look at what the strategy would have done.
● Date: 09/04/2025
● Signals
○ Main signal: RSI oversold exit — RSI crossed above 30
○ Confirmatory signal: NATR Oscillator >= 80
● Scoring
○ Long setup score = main signal + confirmatory signal = 0.5 + 0.5 = 1.0
○ The long setup score was greater than or equal to the long threshold, resulting in a green peak in Pane 5. The strategy then entered a long position by placing a bracket order.
● Risk Management
○ Reward-to-risk ratio: 4:1, although I can exit earlier
○ Entry: 548.62, the close of the setup candle
○ Stop loss: 4x daily ATR, with a stop distance of 75.54
○ Take profit: 16x daily ATR, with a target distance of 302.17
● Order Management
The strategy would place a bracket order
○ Limit entry: 548.62
○ Market stop: 484.37
○ Limit target: 805.63
● Trade Status
○ Target: Not reached
○ Opposite signal: No short setup has appeared since entry.
○ Exit condition: None met, so the position remains open.
That's it for an overview of the strategy and an example using SPY.
Short 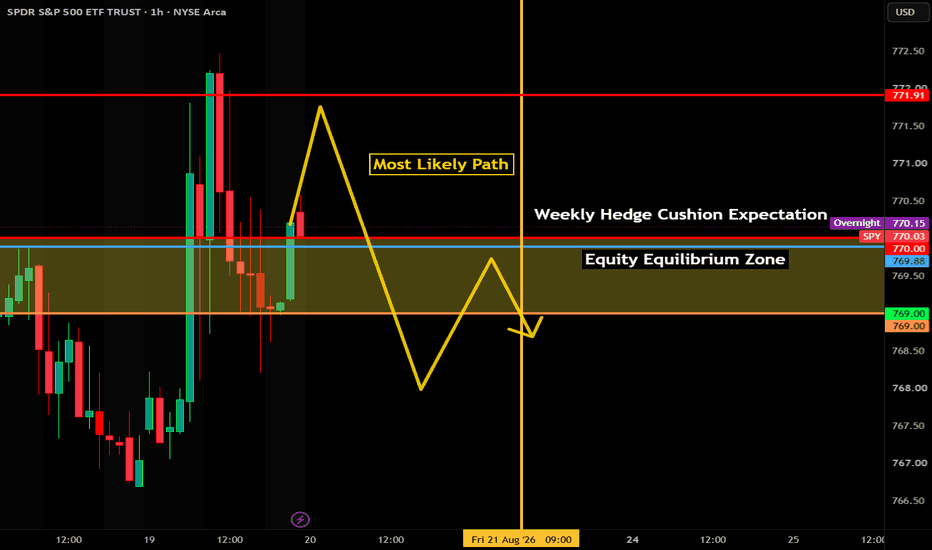
SPY: old value above, new value below, nothing traded in betweenSPY, 1 hour. Weekly volume profile plus weekly-anchored pivots.
Where the auction has been. The last two completed weeks built value in nearly the same place: the Aug 3-7 profile's point of control sits at roughly 771.9, the Aug 10-14 profile's at roughly 772.8. That was the market's accepted price for two weeks.
Where it is now. This week opened near the top of that range and has spent three sessions building a new high-volume node well below it. The developing weekly point of control is roughly 767.85, with the bulk of the week's volume between roughly 767.5 and 769.9. Wednesday closed 769.06, inside that node.
What has not traded. Roughly 770.0 to 772.5 is the thinnest part of this week's profile, and it is exactly where both prior weekly points of control sit. Weekly S1 (771.09) runs through the middle of it. Old value above, new value below, and very little trade in between.
What the weekly pivots add. PP (774.97) was tested once and held, then BC (774.29), TC (775.66) and S1 (771.09) were each tested once and broken. Price has been below S1 for five bars and has already reached S2 (768.68), tagging it three times. R1 (778.85) has not been tested at all this week.
What to look for Thursday.
Balance case: rotation inside roughly 767.5 to 769.9. That is the node the market is actively building, and trade inside it is balance, not direction.
Upside: a reclaim of the overnight level near 770.1 and then S1 at 771.09 puts price into the thin pocket. There is very little volume on the profile between roughly 772.5 and the old value at roughly 772.8 up to BC at 774.29, so that stretch is unobstructed.
Downside: losing S2 at 768.68 and then the node's low near 766.8 leaves nothing on the profile until S3 at 764.80. That gap is as thin as the one above.
What changes the read: acceptance back above BC at 774.29 would put the auction inside the old value area again and make this week's move a failed probe lower rather than a migration of value.
Charted with our own weekly volume profile (PVP) and pivot (PSB) studies. We build tools to help traders make better decisions. See the auction more clearly. Independent author, not affiliated with TradingView.
www.tradingview.com  Short
Short