SOXL possible inverse head shoulders day chartAMEX:SOXL
I don't see SOXL dropping much from here. This could simply be a bear trap.
The key level to watch is the daily 200 EMA around $105. As long as SOXL holds above it, the bullish trend remains intact. However, if it closes below the daily 200 EMA for multiple days and fails to reclaim it, I'd consider that a shift to bearish momentum.
If SOXL can hold above $120, it could be forming the right shoulder of an inverse head-and-shoulders pattern. If that's the case, I could see a move toward $155. If it then breaks above and holds that level, the next target could be around $230, where there's an unfilled daily gap between $230 and $240.
Even if SOXL reaches that area, I highly doubt it continues much higher. I'm still bearish on the monthly chart heading into October, as I believe the market is becoming extremely overbought. A rally to $230 would actually look like a potential shorting opportunity to me.
Looking further ahead, I could see SOXL trading in the $70–40 range sometime in 2027. That scenario only becomes likely if it loses the daily 200 EMA and bearish momentum takes control. As long as it stays above the 200 EMA, I'll remain bullish. Once it loses that level, I'd be looking for short opportunities instead.  Long
Long
 Long
Long
 Long
Long
Research 19.08.2026🌏 Markets:
AMEX:SPY +0.39 0.05%(pre/m)
NASDAQ:QQQ -0.96 -0.13%(pre/m)
🆕 Economic News:
10:30 USA – EIA Crude Oil/Gasoline Stocks Change
14:00 USA – FOMC Minutes
📈 Gap Ups
Reaction to earnings/guidance:
NASDAQ:KC NYSE:EL NYSE:YMM NYSE:KEYS NYSE:VIK NYSE:TOL NASDAQ:JKHY NYSE:TJX NYSE:SQM NASDAQ:ADI
Other news:
A customized vaccine from Merck NYSE:MRK and Moderna NASDAQ:MRNA kept patients cancer-free for longer than standard treatments, after their melanoma skin cancers had been cut out. It is the first Phase 3 trial success for a cancer treatment vaccine, meaning the companies can now ask regulators to approve the treatment for marketing. / NASDAQ:BNTX rising in syphaty to MRNA
NASDAQ:SKHY announced a massive KRW 40 trillion (~$28.6B) share buyback and cancellation program and said it will return more than 50% of 2025–2027 free cash flow to shareholders.
📉 Gap Downs
Reaction to earnings/guidance:
NASDAQ:MRCY NYSE:ZTO NYSE:LOW NYSE:TGT NYSE:ZIM
Other news:
NASDAQ:WYFI announced a $250M convertible senior notes offering
NASDAQ:NBIS announces proposed private offering of $4.50 billion of convertible senior notes
UBS on Tuesday lowered NASDAQ:INTC price target to $112 from $121 while keeping a Neutral rating.
U.S. memory chip stocks dipped in overnight trading heading into Wednesday, tracking a sharp selloff in Asian tech stocks and South Korea's benchmark index, where trading was briefly halted after a steep plunge. : NASDAQ:SNDK NASDAQ:MU NASDAQ:WDC NASDAQ:STX
NASDAQ:WYFI Announces Pricing of Upsized $270.0 Million Convertible Senior Notes Offering
‼️ Additional
Trump paused the introduction of 50% tariffs on Canadian goods for three days and announced a “deal” with Ottawa.
-- The rapid rise in diesel prices has started to weigh negatively on the US economy — FT.
Chinese private space company LandSpace successfully launched and landed its reusable ZQ-3 rocket on land. NASDAQ:SPCX
The Senate vote on the CLARITY Act is scheduled for September 15 at 2:00 p.m. ET, Senator Cynthia Lummis said.
Unitree Robotics shares surged 600% in their Shanghai debut.
BofA: Historically, the weak period for US equities begins in August, with selling pressure typically peaking in mid-September.
-- LPL Research: August is one of the weakest months of the year for US equities. September is the weakest.
WSJ: Shareholders are becoming disappointed with OpenAI’s financial performance in its race against Anthropic.
Cerebras NASDAQ:CBRS said its new computer delivers an AI performance speed advantage compared with Nvidia $NVDA.
Amazon NASDAQ:AMZN said it will expand its drone delivery service to nearly 500 US cities this year.
🏢 IPO
NYSE:LYNX – Lyntris, Inc.
Company provides defense technology connectivity solutions for the U.S. Department of Defense and allied militaries. Its products cover sensor architecture, sensor hardware and data software platforms used in missile defense, maritime surveillance, space ISR and communications. Lyntris was formed through the combination of Accelint and Vitesse.
Price: $17.50
Shares: 17.0M
Raised: $297.5M
Market Cap: ~$1.89B
LTM:
Revenue: $450.8M
Net Income: -$11.8M
Key point:
IPO was cut from 24.0M to 17.0M shares and priced at $17.50, below the original $19.00–$22.00 range.
Comparable public companies: NASDAQ:PLTR , NYSE:LHX , NYSE:LDOS , NASDAQ:SAIC , NASDAQ:KTOS , NYSE:BAH
📋 List of tickers involved:
NASDAQ:KC NYSE:EL NYSE:YMM NYSE:KEYS $VOK NYSE:TOL NASDAQ:JKHY NYSE:TJX NYSE:SQM NASDAQ:ADI NYSE:MRK NASDAQ:MRNA NASDAQ:BNTX NASDAQ:SKHY NASDAQ:MRCY NYSE:ZTO NYSE:LOW NYSE:TGT NYSE:ZIM NASDAQ:WYFI NASDAQ:NBIS NASDAQ:INTC NASDAQ:SNDK NASDAQ:MU NASDAQ:WDC NASDAQ:STX NASDAQ:SPCX NASDAQ:CBRS NASDAQ:NVDA NASDAQ:AMZN NYSE:LYNX NASDAQ:PLTR NYSE:LHX NYSE:LDOS NASDAQ:SAIC NASDAQ:KTOS NYSE:BAH
Best regards – hi2morrow team.
 Long
Long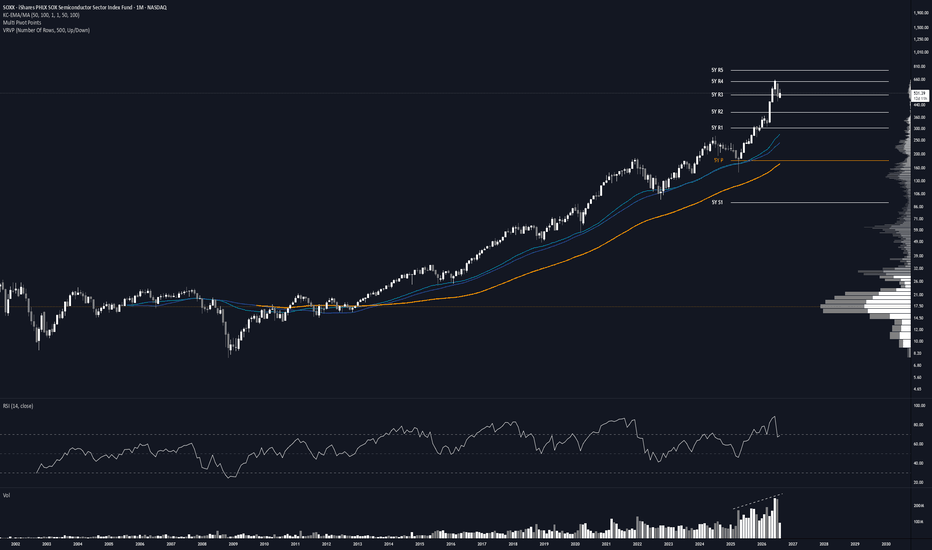
Long 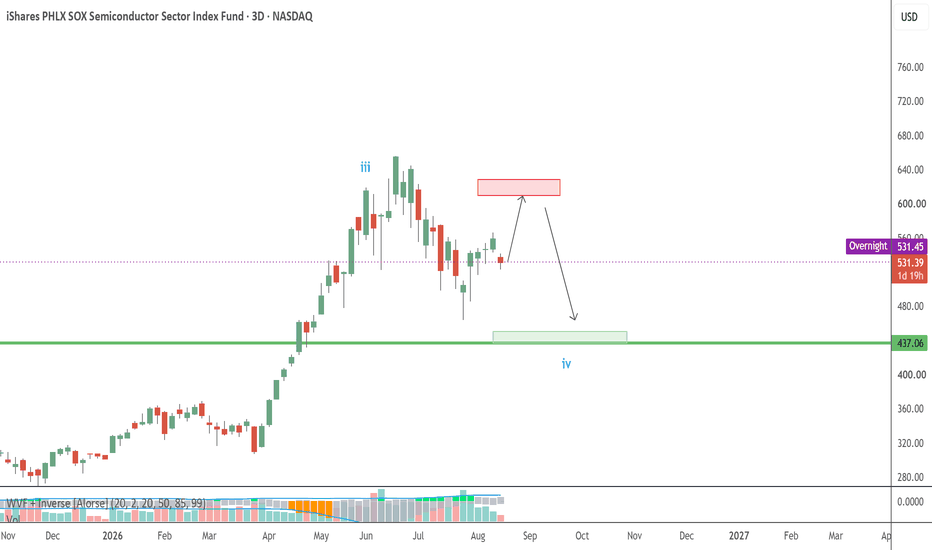
Long 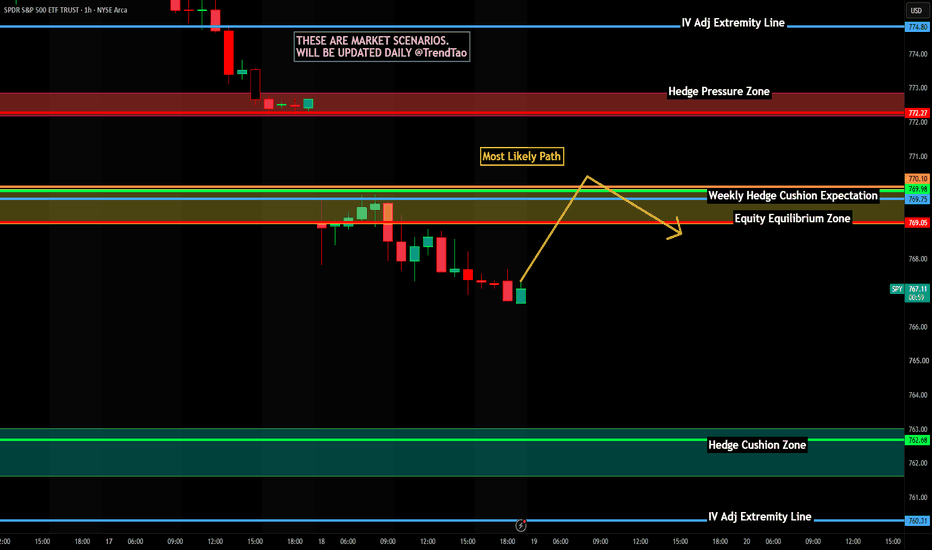
SPY End-of-Day Market Report — Aug. 18Today was not an easy trading session.
SPY finished around 767.37, down roughly 0.74%, but the weakness underneath the surface was considerably greater. QQQ lost about 1.69%, IWM fell 1.26%, while DIA was down only about 0.22%. That dispersion matters: growth and technology were taking much more damage than the Dow.
The macro pressure that created this morning’s gap never really disappeared.
Renewed U.S.–Iran tensions kept oil elevated, with Brent settling around $91.02 and WTI around $84.94. At the same time, long-term Treasury yields remained elevated, with the 30-year yield briefly reaching its highest level since 2007. That combination — higher energy prices, renewed inflation concerns and higher borrowing costs — hit technology particularly hard. Reuters reported the Nasdaq down about 1.3% and semiconductor stocks among the session’s biggest casualties.
What the chart taught us today
SPY spent almost the entire regular session trapped in the same broad ~767.5–769.5 chop box.
There were multiple attempts to break the range.
None produced sustained expansion.
That distinction became important today because the 5-minute chart eventually produced a valid bearish Entry structure, but the 15-minute chart continued to show a market that was overwhelmingly balanced.
That is one of my biggest lessons from today:
A valid lower-timeframe entry does not automatically mean the higher-timeframe environment deserves the trade.
The market finally broke beneath the range during the final minutes of trading, closing around 767.4.
That late breakdown matters.
But I’m not going to treat one late-session move as confirmation that tomorrow must continue lower.
Tomorrow’s battlefield
The first level I care about is essentially where we finished:
~767
That weak hourly reference has now become much more important.
If SPY opens tomorrow and begins accepting beneath 767, today’s late breakdown gains credibility. The hourly chart remains structurally thin underneath this area, so I would respect further downside rather than automatically assuming a bounce.
But if SPY quickly reclaims 767.5–769 and begins accepting back inside today’s range, then today’s final breakdown starts looking more like another failed escape.
From there, the repair sequence remains:
769 → 771 → 772 → 773
And only after that would I start thinking seriously about a larger recovery toward the newer 776 Projected AOA.
The catalyst we cannot ignore
Tomorrow afternoon brings the FOMC minutes from the July 28–29 meeting at 2:00 PM ET.
That meeting was unusually divided, with the Fed holding rates at 3.50%–3.75% while three members favored a 25-basis-point hike. Markets will be looking through the minutes for how concerned policymakers were about inflation and whether additional tightening remains a serious possibility.
That becomes especially relevant after today’s move in oil and long-duration Treasury yields.
Tomorrow morning also brings another important look at the consumer. Target, Lowe’s and TJX all report Wednesday, with Target’s earnings call scheduled for 8:00 AM ET and Lowe’s at 9:00 AM ET.
My expectations for Wednesday
I have a slight bearish lean, but I am absolutely not married to it.
🔴 Bearish continuation
SPY accepts below ~767, attempts to reclaim it fail, and sellers finally produce the expansion that never materialized during today’s range.
That would tell me today’s final breakdown was real.
🟡 Failed breakdown / negotiation
SPY reclaims 767.5–769 and spends another session negotiating around the same battlefield.
Given how aggressively today absorbed multiple breakout attempts, I would not dismiss this possibility at all.
🟢 Repair
SPY reclaims the entire range and begins working through:
769 → 771 → 772/773
That would be the first evidence that buyers are actually repairing structure rather than simply producing an oversold bounce.
One final lesson from today
Yesterday we had a clean setup, waited for confirmation and were paid +50%.
Today we had a valid setup in a much more difficult environment and took the loss.
And because we already follow two very simple rules —
one trade per day
hard -20% stop
—we are still positive on the week.
That is why risk management matters.
You do not need to win every trade.
You need to make sure one losing trade cannot erase the work of the trades that came before it.
Tomorrow starts from zero again.
No revenge trade.
No need to make today’s money back.
No prediction that must be proven correct.
We map the battlefield, wait for structure, and take the trade only if the market earns it. Short 
Long 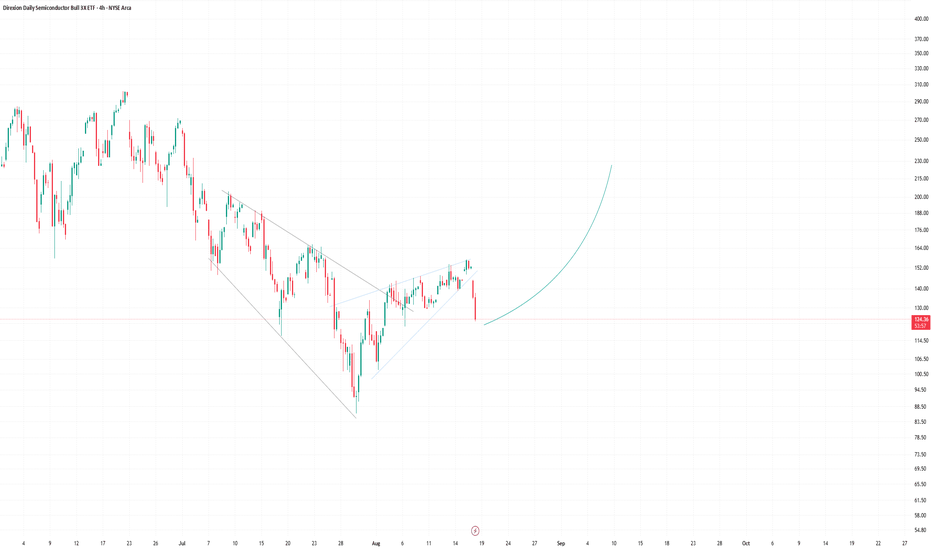
 Long
Long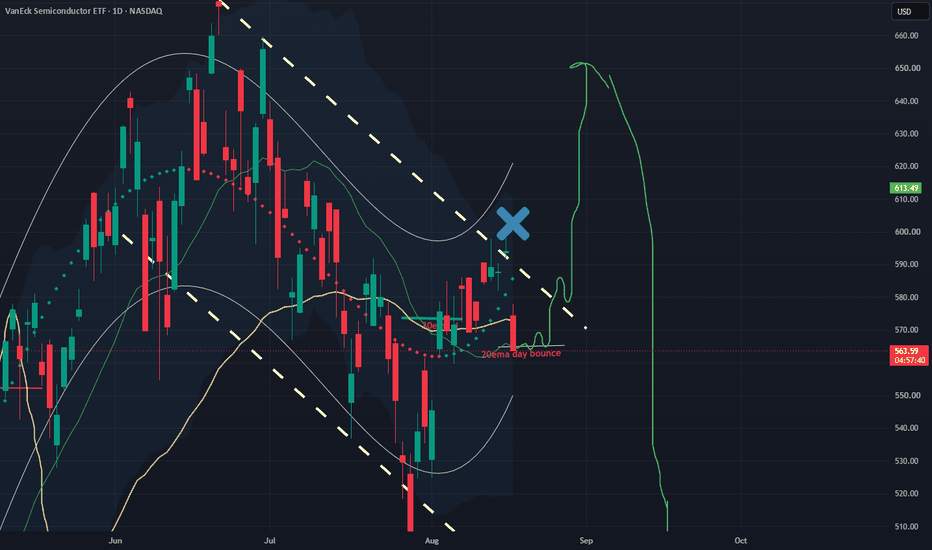
 Long
Long
 Long
Long
SPY Lost 776.81 - The Breakout Failed.SPY Lost 776.81 - The Breakout Failed.
SPY has decisively lost 776.81, trading 769.79 - well below both the breakout level and the 771.58 shelf beneath it. Monday's read was that a decisive close below 776.81 opened the downside, and that is what happened: the month-long breakout could not hold and has reversed. The chop on the line resolved down. Price is already extended below its levels, though, so this is a confirmed failure to respect, not a fresh entry to chase. Neutral.
Resistance: 771.58 - the lost shelf, now resistance
Key resistance: 776.81 - the failed breakout level
Current price: 769.79
Support: 765.71 - the trend line below
Key support: 759.67 - the prior high
Structural floor: 753.22 - deeper support
Two paths from here:
It retests 771.58 from below and rejects. A failed breakout often retests the broken level from underneath. A rejection at 771.58 would confirm the reversal and open 765 and below. That retest is the cleaner tell, not the current extended drop.
It reclaims 776.81 and the failure fails. If SPY snaps back above 776.81, the breakdown was itself a trap and the highs come back into view. Below 771.58 that is the less likely path, but the level defines it.
SPY's breakout failed - it lost 776.81 decisively and is now below 771.58. The chop on the line resolved down as flagged. Price is extended into the drop, so the read is a confirmed failure to respect, not a level to chase. 771.58 is the line that now caps it.
Built with SYNTHESIS v3.3 | SOM / ACE / IMP / SYNTHESIS
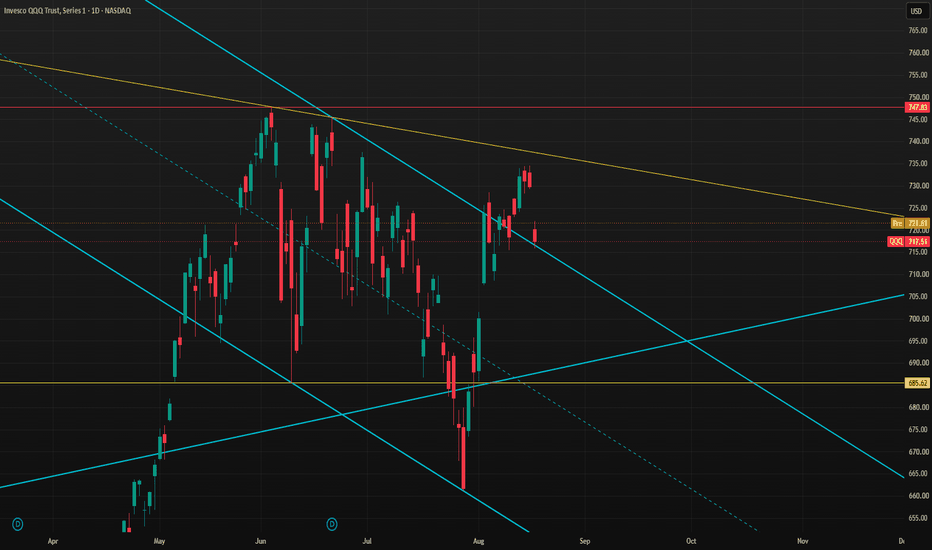
Study, not financial advice. QQQ: Post-ATH Consolidation – Two Paths to $850Fresh ATHs are rarely the end of a move—they are often the beginning of the next one. QQQ has printed a new all-time high at $769 and has now entered a constructive correction phase. This is not a structural breakdown; it looks like a healthy consolidation designed to build energy for the next leg higher.
We are not betting on direction.
We are waiting for price to confirm its next intent.
There are two distinct tactical windows I am watching for a high-probability long entry.
📌 The Two Entry Scenarios:
🟢 Scenario 1: Pullback & Price Action Confirmation.
Wait for the price to rotate down into the green support zone at 708.00. Here, we are not buying the level blindly. We are looking for a confirmed candle rejection on the 4H timeframe—such as a bullish engulfing pattern, a long lower wick, or a structural shift (MSS) off this zone. This provides a low-risk entry with tight invalidation.
🟢 Scenario 2: Breakout of the ATH.
If the market does not pull back and instead chooses to push through the major ATH level at 769.00 ( the 16 April high ), we wait for a clean candle close above it.
A subsequent retest of this broken level as support would confirm the breakout. This is our trigger for the larger macro move.
📊 Trade Management & Invaildation:
The invalidation for this entire bullish thesis is strictly set at 684.0. If the price breaks down below this level with conviction, the structural setup is completely void, and we stand aside.
Once the position is active, our primary directional target is set at 850.0. As always, we will re-evaluate and update the target as the market structure evolves.
💡 Execution Mindset:
No FOMO. No guessing. We do not chase the ATH, and we do not catch the falling knife blindly. We let the 4H timeframe provide the confirmation—whether on a pullback or a breakout—and we react accordingly.
⚠️ Risk Warning:
This analysis is for educational purposes only and does not constitute financial advice. QQQ is a high-capitalization ETF heavily correlated with the broader Nasdaq-100 tech sector. Always manage your position sizing strictly according to your personal risk tolerance, respect your invalidation level without hesitation, and never risk capital you are not fully prepared to lose.  Long
Long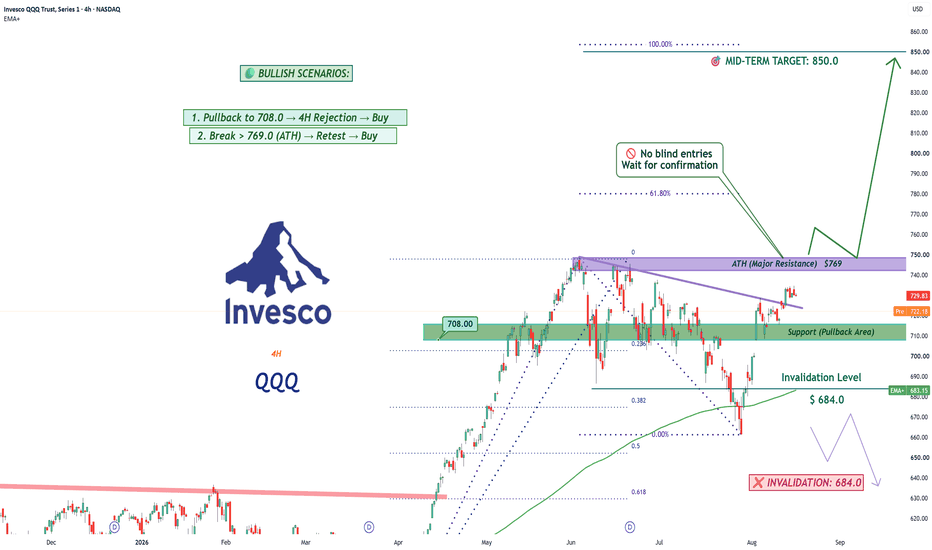
Long 
Short 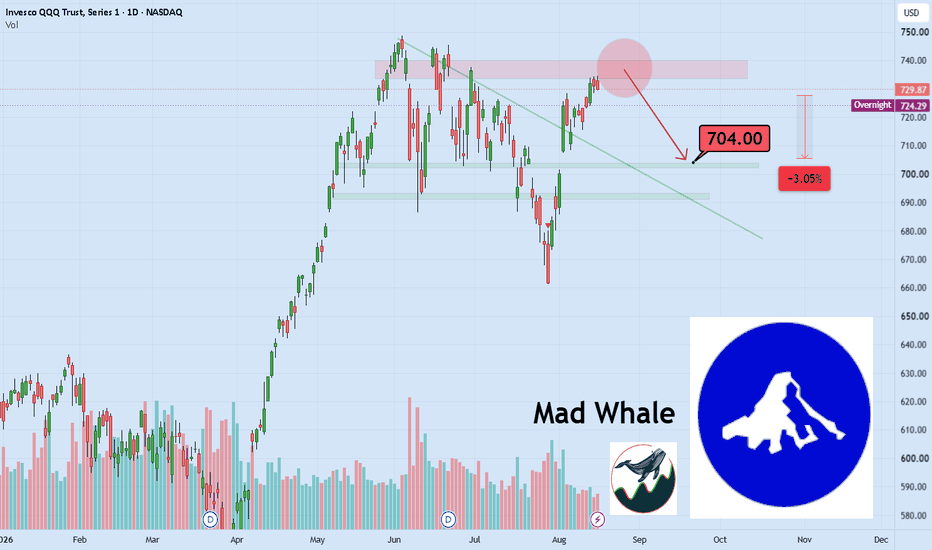
SPY has gaps to fill downsideAMEX:SPY remains in a strong uptrend on the daily timeframe, trading inside a rising channel. The overall trend is still bullish as long as price continues making higher highs and higher lows.
That said, after the recent breakout, I see several daily gaps below the current price that could act as potential retracement targets. The first area to watch is around $760–765, followed by $750–755, and finally $742–746. These zones also line up with previous resistance that may now act as support. The 50ema day (yellow line) sits around 750$ let's see if has a bounce near it..
If spy pulls back into those areas, I'd view them as potential buying opportunities rather than reasons to panic. A healthy retracement after a strong rally is normal, especially with multiple open gaps below.
As long as price holds above the rising trendline (white line) and key moving averages 50ema yellow line, 100ema orange line, purple 200ema day etc, I remain bullish. However, if the trendline breaks with strong selling volume, I'd expect a deeper correction before the next leg higher.
If it breaks above 780$ for multiple day's and don'T drop back under, I see it go to 800-850$ Short 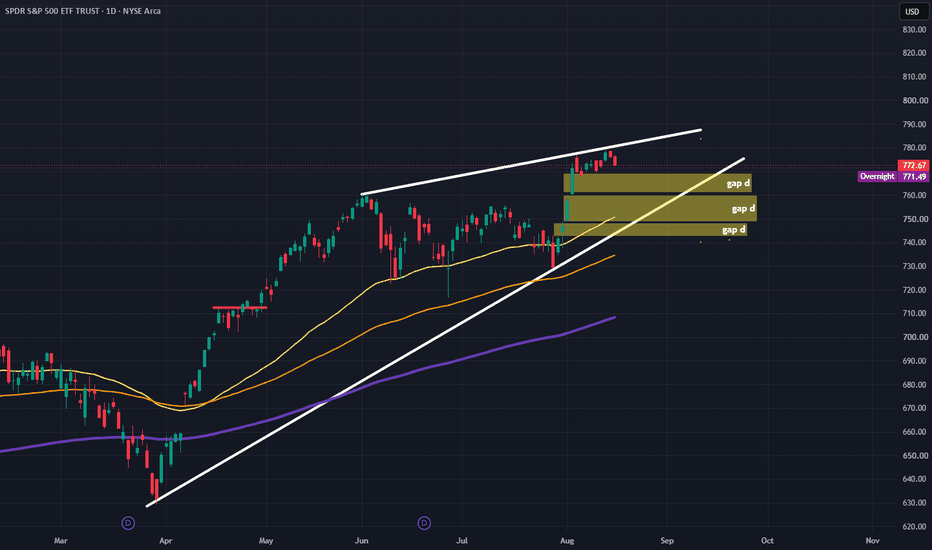
SPY Outlook Incomplete Bullish Cycle Supports AdvanceThe short‑term Elliott Wave outlook in the S&P 500 ETF (SPY) indicates that the cycle from the June 27 low continues to unfold as an impulse structure. From that low, wave ((i)) concluded at 756.22, followed by a corrective pullback in wave ((ii)) that ended at 725.96. The ETF then advanced in wave ((iii)), which developed as another impulse, as reflected in the 45‑minute chart. Within this sequence, wave (i) terminated at 746.55, while the subsequent dip in wave (ii) found support at 737.68. The rally extended further in wave (iii), reaching 776.85, before a modest retracement in wave (iv) ended at 771.29.
The final leg, wave (v), carried prices to 779.37, thereby completing wave ((iii)) of higher degree. At present, the market is engaged in a corrective phase identified as wave ((iv)). This pullback is expected to unfold in either three or seven swings, serving to correct the cycle that began from the July 30 low. Once this correction is complete, the broader rally should resume.
In the near term, the critical pivot remains at 725.96. As long as this level holds, the expectation is that any pullback will eventually locate support within a three, seven, or eleven‑swing sequence. Such a development would provide the foundation for renewed upside momentum, reinforcing the view that the larger bullish cycle remains intact. This structure highlights the disciplined rhythm of Elliott Wave analysis, where corrections serve as pauses before the prevailing trend continues.


