Long
Long
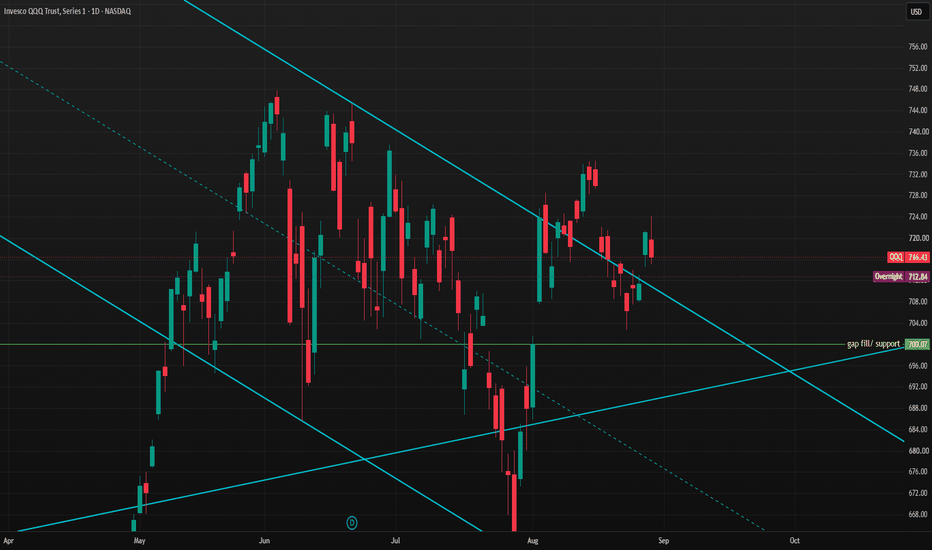
QQQ Weekly Outlook: 702 Support vs 725 Breakout | Aug. 31–Sep. 4QQQ Weekly Outlook: 702 Support vs 725 Breakout | Aug. 31–Sep. 4
QQQ finished last week at 716.43 after once again proving that the area between roughly 702 and 725 is the market’s current decision zone.
Last week gave us an unusually clean test of that framework. QQQ reached 702.70 on Monday, holding just above our lower support boundary, then rallied to 724.13 on Friday before failing just beneath the 725.39 breakout level. Neither side of the range confirmed, and price finished the week back near the middle.
The important change entering this week is that the broader structure has improved. The current chart shows the Daily, Weekly and Monthly trends all bullish , bullish market structure, price above the 20 EMA, and buyers controlling VWAP. The market-state model is also back to Bull Directional .
But that does not automatically make 716 an attractive bullish entry location. Momentum remains neutral, price is mid-range, and QQQ is still below both the descending resistance structure and 725.39 R1 . The current signal plan therefore remains WAIT .
Bullish scenario
The first real test is 725.39 . A convincing breakout and acceptance above that level would clear the top of the current decision range and weaken the descending resistance structure. Above 725.39, the next upside references are 736.10 , then 745.74 . The larger confirmed Double Bottom measured-move reference remains near 766.02 .
Neutral scenario
If QQQ remains between 702.14 and 725.39 , the market is still inside the same broad range that controlled last week. In that environment, strength into resistance and weakness into support can continue to reverse without producing a durable directional move. The middle of the range remains the least informative location.
Bearish scenario
The first important downside level is now 702.14 . A test that holds and reclaims that area would continue to support the bullish higher-timeframe structure. A decisive loss of 702.14 would materially change the picture and expose 686.19 next. Beneath that, the major lower reference is 662.46 , close to the existing Double Top measured-move reference around 664.20 .
So the setup entering the week is constructive, but conditional:
Above 725.39 → bullish expansion becomes more credible.
Between 702.14 and 725.39 → remain patient; the range still controls.
Below 702.14 → downside risk increases materially.
The strongest part of the chart right now is the higher-timeframe trend. The weakest part is location. Until QQQ reaches one of the edges of the range or produces a clean breakout, there is little reason to force a directional call from the middle.
This week’s major catalysts are heavily concentrated around the labor market. Tuesday brings JOLTS and ISM Manufacturing at 10:00 ET. Wednesday brings ADP employment at 8:15 ET. Thursday includes jobless claims and revised productivity/costs at 8:30 ET plus ISM Services at 10:00 ET. Friday brings the August Employment Situation / nonfarm payrolls at 8:30 ET.
Friday is especially important because the previous July employment report showed payrolls down 23,000 with unemployment at 4.1% , making the August report a potentially significant catalyst for rates and growth-sensitive technology shares.
Bottom line: QQQ enters the week with bullish higher-timeframe structure, but still trapped beneath the same resistance that capped last week. 702 and 725 remain the levels that matter most. Let price tell us which side wins.
Informational purposes only. Not financial advice. SPY: The After-Window Opened on an Oil Shock...On 21 August I published the CME September curve at 34.6% hike against 65.4% hold and flagged Warsh Friday as the reaction function reveal.
He gave it.
About twenty points of hike moved in the hour he spoke, and the curve kept going. Monday's pull reads September 66.1% hike against 33.9% hold, October 74.4% hike, December 89.0% hike, and ease 0.0% at all three. September was 57.0% on Friday and 41.4% a week ago, though it also read 67.0% on 31 July, so the front end has round-tripped a month rather than set a new extreme.
The August employment situation lands Friday 4 September at 08:30 ET against a +58K consensus after July's −23K, on the last session Fed voters can speak before FOMC blackout starts at midnight. Watch payrolls and participation separately: the July print held the unemployment rate at 4.1% by falling participation, and a Temporary Protected Status revocation for about 350,000 people in late July can hold the rate down for the wrong reason again.
Warsh named the gauge, the share of 199 disaggregated PCE components rising more than 3% over twelve months, currently at 54%. That is what any print from here reads against.
Best of luck!
Cheers,
Ivan Labrie. Long 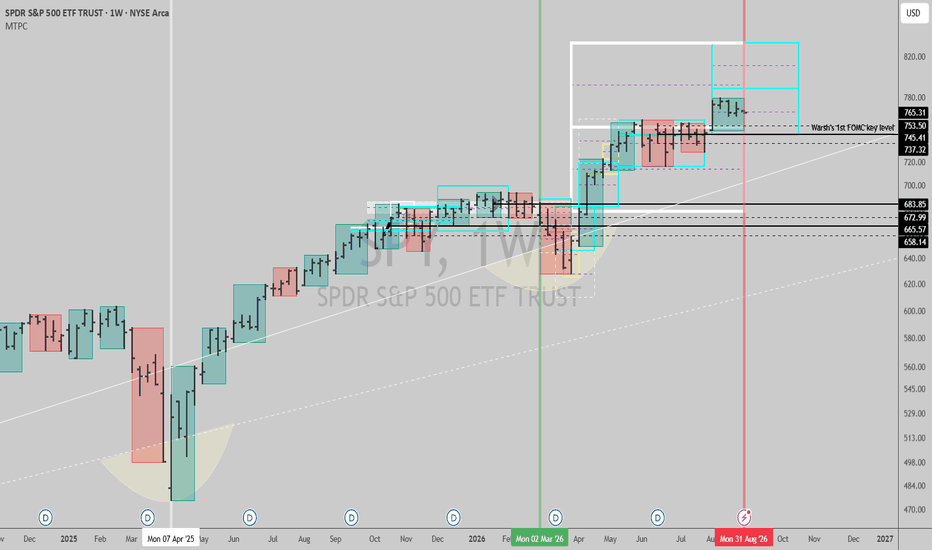
Short 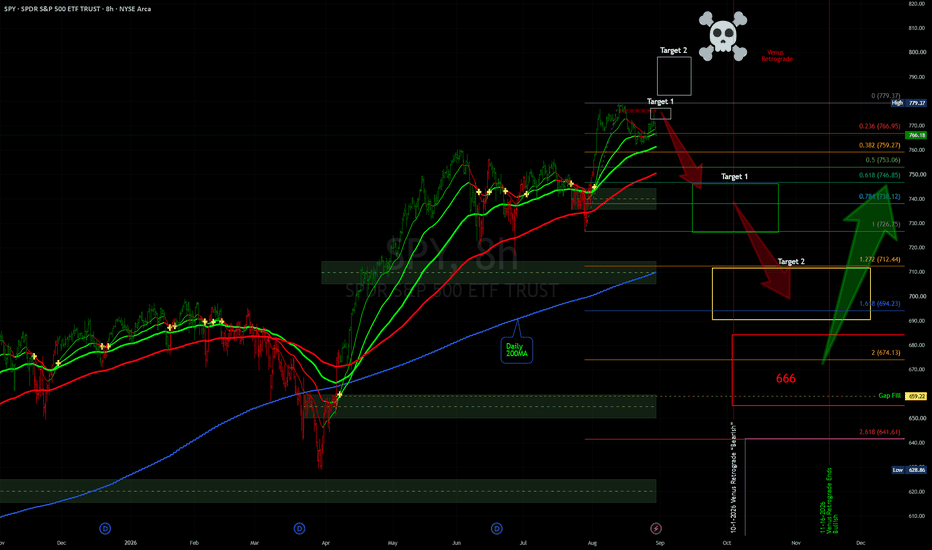
SPY: Price Breaks Above Horizontal Consolidation, Eyes New ATH!The SPDR S&P 500 ETF Trust (SPY) recently traded around $772, consolidating near its higher weekly ranges as Wall Street weighs ongoing corporate earnings, shifting Federal Reserve rate expectations, and broader macroeconomic factors. Markets have seen mixed sessions driven by tech sector evaluation and upcoming economic symposium focus.
Technical Insight:
SPY was confined inside a sideways formation, fluctuating on a momentum of support and resistance, for a couple of months now. Lately the ETF broke above the horizontal resistance zone, at $760. Price is making a back test, as we anticipate bullish continuation between, $756-$764.
Key Point:
A confirmed pullback around this zones, activates a buy position, aiming towards $790, as next potential high.
Thanks for reading. Long 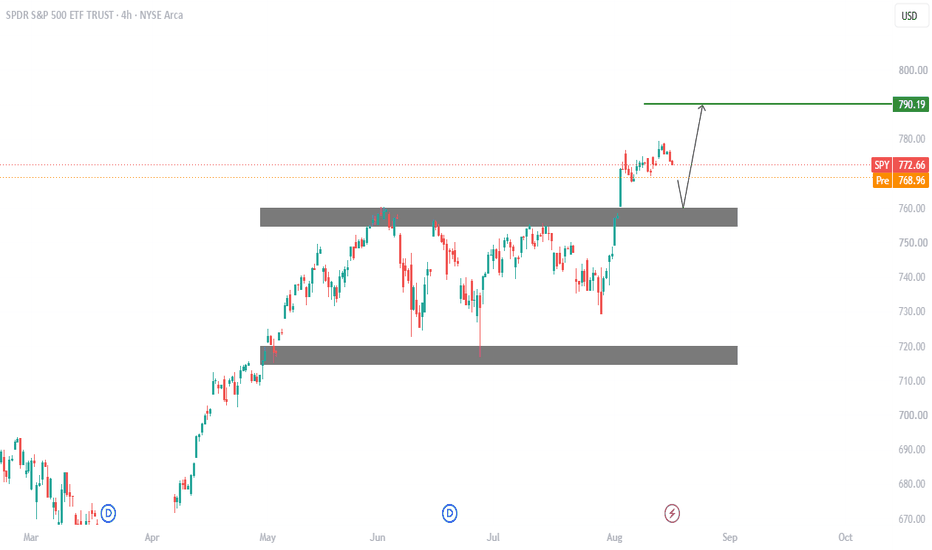
Short 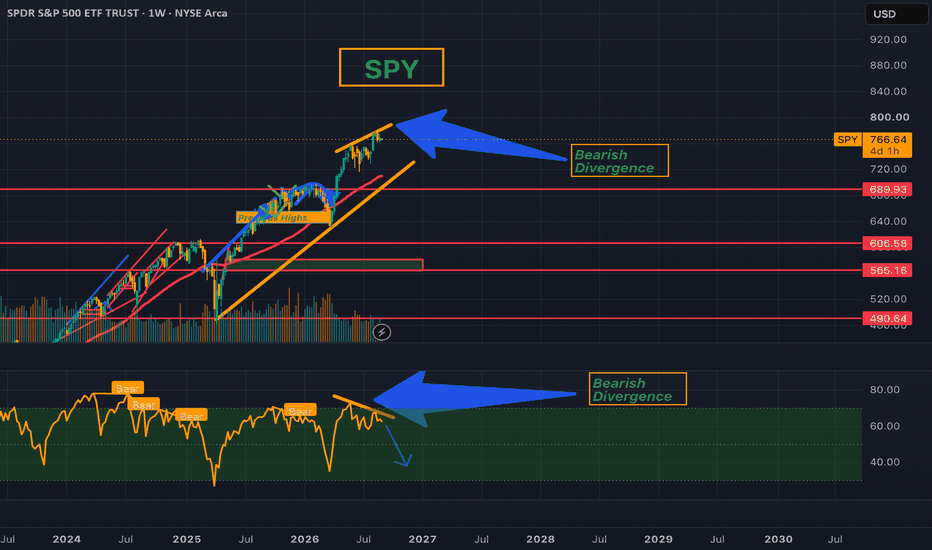
Short 
Semiconductors Setting Up Base As Macro Fears CoolTaking a close look at the RIGHT chart, we can see a classic inverse head and shoulders base forming. What makes this structure especially interesting is the nesting. Inside the broader right shoulder of the main pattern, price action has carved out a smaller secondary inverse head and shoulders.
This type of pattern within a pattern often signals that buyers are stepping in early and absorbing selling pressure before the larger breakout unfolds. When the smaller structure resolves upward, it can provide the momentum needed to confirm the larger bottoming process.
The Macro Picture: Why Are Markets Not Spooked?!?!?!
On paper, the broader macro backdrop looks intimidating:
10 Yr Yield:
TVC:TNX is sitting at levels much higher than during the regional banking stress of 2023. However, instead of panicking, equities are absorbing this move. The market views current yield strength as a reflection of solid economic momentum rather than a sudden systemic crunch.
Japanese Yen:
The Yen has handed back about half of its massive run. While the initial spike caused widespread turbulence, the current retracement shows that global currency repositioning is unfolding in an orderly way without forced liquidation cascades.
Volatility Suppression:
Despite elevated bond yields and currency swings, fear gauges are not ripping higher. Heavy option premium selling and persistent dip buying continue to place a floor under pullbacks, keeping markets remarkably stable.
Key Takeaway
While macro headlines seem heavy, the underlying price action tells a calmer story. The nested inverse head and shoulders pattern highlights steady accumulation in semiconductors, while the market reaction to high yields and currency moves points to strong resilience.
Watch for the pattern neckline to clear to CONFIRM that the next upward leg is underway.
What is your take on this semiconductor setup?
Are we set for a breakout, or will macro pressure eventually weigh on equities?
TGtg! # SPY Is Pinned at $770—Until It Isn’t | Aug. 31–Sept. 4
**Daily chart**
SPY is still in an uptrend. I do not see a broken daily chart here. I see a market that pulled back from $779.49 and is now trying to settle around $770.
The recent dip held well above the previous breakout near $755.72. That keeps the larger trend bullish. At the same time, buyers have not been able to push back through the high.
Daily RSI is around 60. It is still on the bullish side, but momentum has cooled from the earlier run. I would not turn one pullback into a market-top prediction. I would also not chase while SPY is sitting under resistance.
My daily levels:
* $779.49 major resistance
* $785 next breakout target
* $771–$772 first resistance
* $768–$770 current decision area
* $755.72 major daily support
* $730 secondary support
* $717 larger trend support
A daily close above $779.49 would put SPY back into price discovery. Losing $755.72 would be the first real damage to the current daily structure.
**15-minute chart**
Friday’s move was a trap for anyone chasing the morning strength. SPY ran to $775.30 and then sold off to $768.31. It spent the rest of the session moving sideways around $769.
The late-day base stopped the selling, but buyers never recovered $770. Price is also under the short-term average and the descending intraday trend.
For Monday, $770 is the first line I am watching. A quick move above it means very little. I want a 15-minute candle to close above $770–$770.50 and stay there.
If that happens, the next levels are $772, $772.77, $774 and $775.30.
On the downside, $768.31 and $768.05 are the Friday lows. A break below them could send SPY toward $766, $765 and possibly $760.
**GEX map**
The GEX map is centered almost perfectly around the current price.
Overhead levels:
* $770 high-volatility level
* $772 first call level
* $774
* $775
* $785 major open-interest level
Downside levels:
* $768
* $766
* $765
* $760 major put wall
* $755
* $750
The current GEX state is mixed and leaning defensive, with puts making up about 60.3% of the positioning shown. This matters because price can move faster once one side of the range breaks.
The $770 high-volatility line is likely to be the main pivot. Holding above it favors $772–$775. Staying below it keeps pressure on $768.
The largest downside concentration is at $760. If $765 fails, I would expect $760 to start acting like a magnet.
IVR is around 21 and implied volatility is still relatively low. SPY options are not carrying extreme premium, but 0DTE and 1DTE contracts can still lose value quickly if price stays stuck around $769–$770.
**Day-trading plan**
For calls, I want a 15-minute close above $770.50 and then a clean hold. My targets are $772, $774 and $775.30. If SPY breaks Friday’s high with volume, I would keep a small runner for $779.50.
Another possible long is a flush under $768 followed by a quick recovery back above $769. I would wait for the reclaim instead of buying during the drop.
For puts, I am watching for a rejection from $770–$772 followed by a break below $768. Targets would be $766, $765 and $760. The bearish setup is wrong if SPY gets back above $770.50 and holds.
I will avoid trading inside the $769–$770 area. That is too close to the high-volatility pivot and could produce a lot of movement without going anywhere.
**Long-term investment view**
For long-term investing, SPY is different from an individual stock. I am not trying to find one perfect entry and put all the money in at once.
My normal approach is regular buying, with extra cash reserved for larger pullbacks.
The areas where I would consider increasing the position are:
* $755–$760
* $730
* $717
A weekly close below $717 would break the larger trend shown on this chart. Until then, pullbacks remain part of an overall bullish structure.
If SPY clears $779.49, the next levels are $785, $790 and $800. I would continue holding a long-term position through that move instead of selling everything because the market reached another high.
For this week, $770 controls the short-term direction. Above it, SPY can work back toward $775 and $779. Below $768, the door opens toward $765 and $760.
This is my chart plan for the week, not a recommendation to buy or sell.
SPY Sunday Market Prep: Futures Lower, Geopolitical Risk Back inFutures are lower Sunday evening, and the biggest change since the original weekend map is not technical — it’s the macro backdrop.
The S&P 500 and Nasdaq futures are both modestly red, while oil has jumped more than 2% after renewed U.S.–Iran military action around the Strait of Hormuz. Brent is back around $90 and WTI around $85, which immediately brings inflation and rate expectations back into the conversation.
That matters because the market was already digesting a more hawkish Fed after Jackson Hole. Warsh’s comments increased expectations for a possible September hike, and the 2-year Treasury yield moved sharply higher.
So now we have:
higher oil + higher geopolitical risk + a more hawkish Fed backdrop
That combination is not ideal for high-duration growth and AI names.
Why NVDA and other AI leaders may struggle
NVDA’s earnings were strong enough to reaffirm the AI demand story, but the stock still showed how sensitive the group is to macro pressure.
If Middle East tensions remain elevated and oil keeps climbing, yields could stay firm or move higher.
That creates a tougher environment for names like:
NVDA
AVGO
DELL
other high-multiple AI / semiconductor stocks
because higher yields increase the discount rate investors apply to future earnings.
That does not mean NVDA suddenly becomes fundamentally weak.
It means the macro environment can overpower good company-specific fundamentals, at least temporarily.
SPY Map
I would not redraw the scenarios yet.
The original battlefield still works.
771 — first meaningful upside repair area
769 — Friday close / immediate decision
PDL around 768
766 → 765 → 764 — lower AOA cluster
What has changed is the weighting.
🟢 Green
Green is still alive, but now requires more proof.
If futures recover and SPY can reclaim 769 → 771, then buyers have absorbed the initial geopolitical shock.
Above 771, the path toward:
773 → PDH → 776
reopens.
If that happens while oil cools and yields stabilize, Green becomes much more credible.
🟡 Yellow
Yellow is still my highest-weight scenario.
SPY could easily spend the early part of the week rotating around:
766–771
while traders digest:
Fed expectations
oil
Iran headlines
labor data
and major tech earnings.
That would fit the original thesis of an early-week negotiation before a larger directional move later.
🔴 Red
Red deserves more weight tonight.
If SPY loses 768 / PDL and begins accepting below it, then:
766 → 765 → 764
becomes the immediate downside ladder.
If 764 breaks cleanly and cannot be reclaimed, then the deeper Red path into the upper 750s becomes much more realistic.
That would likely require continued geopolitical escalation, rising oil, rising yields, or a deterioration in the week’s labor data.
My weighting now
Before futures opened:
Yellow > Green > Red
After tonight’s news:
Yellow > Red > Green
Not because the bullish case is dead.
Because the market now has another source of inflation and risk to price.
The bigger question is not whether futures are red Sunday night.
It is whether SPY can absorb the geopolitical shock and recover its Friday structure.
For now I’m leaving the map exactly where it is.
We’ll re-evaluate Monday morning once we have overnight price action, oil, yields, and any additional headlines. SPY - Back At The Floor With A Data Print On The ClockSPY - Back At The Floor With A Data Print On The Clock
The S&P 500 ETF is opening soft near the low end of the two-week range that has held between roughly 765.71 and 771.58. This morning's dip under that floor is a pre-market print, not a settled read, so it does not count as a break yet. The daily picture still leans constructive, and the level that would actually change the posture is a confirmed close that holds, in either direction. There is also a scheduled risk on the clock: the ISM manufacturing report lands at 10:00 Eastern, which is a timing event to respect, not a direction to trade ahead of.
Resistance: 771.58 (range top and trigger)
Key resistance: 775.30, then 779.37
Current price: 763.23
Support: 765.52, then 762.57
Key support: 759.13
Structural: 753.22
Two paths from here:
Reclaim and hold above 765.71 during the regular session and the range stays intact, with 771.58 back in view as the level that has rejected four times.
Close the regular session below 765.71 and hold it, and the two-week range breaks down, opening 759.13 and then 753.22.
The range has been the whole story for two weeks, and it takes a held close, not a morning wick, to end it.
Built with SYNTHESIS v3.3 | SOM / ACE / IMP / SYNTHESIS
Study, not financial advice.  Education
 Long
Long
Long 
SPY Sept. 1: Negative GEX Below $770
SPY finished Monday at $766.77 and traded around $766.93 after hours. The session moved from $769.77 down to $764.72 before buyers recovered part of the decline.
The larger trend is still bullish, but short-term momentum has weakened. Tuesday’s direction will depend on whether SPY can reclaim $770 or loses Monday’s low.
Daily Timeframe
SPY reached a recent high of $779.37 before pulling back into the mid-$760s. The current decline has not broken the larger uptrend, but buyers have not yet produced another daily breakout.
Daily RSI is around 54.2 and below its signal line near 60. Momentum has cooled and is no longer supporting an aggressive bullish entry.
The first daily resistance is around $770, followed by $775.93 and $779.37. A daily close above $780 would restart the larger breakout and open the path toward $790 and $800.
The first important daily support is around $755. Below that, the next major support is near $729, followed by $717.
15-Minute Timeframe
SPY began the session near $769.50 and remained under pressure throughout the morning. The decline reached $764.72 before buyers stepped in during the afternoon.
Price recovered toward $768 and broke above the intraday falling channel, but the breakout did not continue. SPY finished near $767.50 and is now retesting the broken trendline.
The 15-minute indicator also shows support breaking down. That makes the current bounce less convincing until $768 and $770 are reclaimed.
The immediate intraday range is $764.72 to $770.
GEX Map
Monday’s 0DTE GEX map showed negative gamma with puts representing 69.4% of the positioning.
Important upside levels:
$768 first resistance
$769 call level
$770 high-volatility level
$772 major call level
$774 secondary call level
$775 upper put level
Important downside levels:
$766 first put level
$765 stronger put level
$760 largest downside put wall
The negative gamma environment matters. When dealers are positioned in negative gamma, they may hedge in the same direction as the market move. That can make breakouts and breakdowns travel faster.
Below $768, SPY was trading inside the negative gamma area. A break below $765 could therefore accelerate toward $760.
This map was based on the August 31 0DTE expiration. Those contracts have expired, so Tuesday’s live GEX map must be checked before treating these levels as current dealer positioning.
Call Setup
For calls, I first want SPY to break $768 and hold it on a retest.
Initial upside targets:
$769
$770
$772
The stronger call setup begins above $770. If SPY breaks $770 and successfully retests it, the next targets are:
$772
$774
$775.30
$775.93
$779.37
I would not chase calls directly into $770. That is the high-volatility level and could reject price without confirmation.
Put Setup
Puts become interesting if SPY rejects $768 to $770 and then loses $766.
Downside targets:
$765
$764.72
$763.25
$760
The cleaner breakdown comes below $764.72. I would wait for that level to break and fail on the retest before expecting a larger move toward $760.
If $760 breaks, the daily chart opens toward approximately $755.
Economic Data Risk
Tuesday includes manufacturing and labor-market data. A strong reaction around the morning releases could override the early technical setup.
I would avoid entering immediately before the data and wait for SPY to establish direction afterward.
My Plan
Above $770 with a successful retest, I am looking for calls toward $772 and $775.
Below $766 with a failed reclaim, I am looking for puts toward $764.72 and $760.
Between $766 and $770, I will wait. That area contains several nearby GEX levels and can produce false breakouts.
The larger trend remains bullish, but the short-term setup favors caution. SPY needs to reclaim $770 before buyers take back control. Below $765, negative gamma could turn an ordinary pullback into a faster move toward $760.
 Long
Long