 Long
Long
 Long
Long
 Long
Long
Market Physics Beyond Moving Averages: The Kinematic FrameworkMarket Physics Beyond Moving Averages: The Kinematic & Hilbert Space Framework
For decades, traditional technical analysis has relied on static chart patterns or lagging moving averages. While these tools attempt to define where an asset has been, they fail to measure the live physical forces driving price action.
The Market Kinematics System changes this paradigm by treating price movements as a physical object in motion within an abstract Hilbert Probability Space. By unifying Newtonian kinematics—Velocity, Acceleration, and Jerk—with quantum probability vectors, we can measure momentum, structural force, state superposition, and turning points in real time.
I. The Core Concept: Price as a Physical Object
In classical mechanics, you cannot predict a moving object's trajectory by looking at its position alone. You must know its speed, whether it is accelerating, and how fast that rate of change is shifting. Quantum mechanics adds a critical dimension: measuring whether the system is in a deterministic directional trajectory or a state of probabilistic noise.
Position (x): Raw asset price (P_t).
Velocity (V): Directional speed of price movement (1st derivative).
Acceleration (A): Underlying force driving the trend (2nd derivative).
Jerk (J): Structural shift in force (3rd derivative)—the leading engine inflection.
Hilbert State Vector (|Ψ⟩): 3-axis orthogonal probability vector measuring trend conviction versus ambient market noise.
│
▼ (1st Derivative)
│
▼ (2nd Derivative)
│
▼ (3rd Derivative)
│
▼ (State Projection)
II. Volatility Standardizing & Hilbert State Vectors
To make kinematic equations work across any market (from high-volatility altcoins to broad index ETFs), metrics are standardized into scale-invariant Sigma Units (σ) using rolling volatility (σ_t):
R ˆ_t=(P_t-P_(t-1))/σ_t
From smoothed standardized return streams, continuous rates of change are derived:
Velocity (V_σ): Smooth directional speed (k_v=18).
Acceleration (A_σ): Rate of change of velocity (k_a=5).
Jerk (J_σ): Rate of change of acceleration (k_j=50).
Delta Jerk (ΔJ_σ): Immediate shift rate in jerk (J_t-J_(t-1)), signaling initial force ignition.
Hilbert Space Mechanics
Price action is simultaneously projected onto a 3-dimensional complex vector space spanning three orthogonal eigenstates:
|Ψ⟩=P_"Up" |↑⟩+P_"Down" |↓⟩+P_"Chop" |⋅⟩
P_"Up" : Bullish directional weight.
P_"Down" : Bearish directional weight.
P_"Chop" : Non-directional entropy weight.
III. The Superposition Veto Gate (P_"Chop" ≥38.0%)
When market noise expands during sideways consolidations, entropy spikes. In Hilbert Space, this state represents quantum superposition—a condition where classical derivative signals carry high false-positive rates due to ambient chop.
The Superposition Veto Rule: When P_"Chop" ≥38.0%, all new trade triggers are hard-vetoed regardless of kinematic derivative scores. Capital remains protected until entropy decays and the system collapses into a high-conviction directional eigenstate (P_"Up" ≥55% or P_"Down" ≥50%).
IV. Reading Market Regimes: The Sign & Hilbert Matrix
By pairing derivative signs (+/-) with Hilbert state vectors, the market is classified into objective operational regimes:
🚀 Expansion Surge: (P_"Up" ≥55%)
The Forces: Price is rising (V>0), accelerating (A>0), and force is expanding (J>0).
Operational Execution: Core Long Hold. All internal physical cylinders firing in unison.
🛑 Ignition Recovery (B_2 Primary Entry): (ΔJ>0)
The Forces: Price speed remains negative (V<0), but downward force has decelerated (A>0) as positive Jerk ignites (J>0,ΔJ>0).
Operational Execution: Sandbox Primary Entry. Structural bottoming phase where smart money absorbs supply prior to price turning positive.
⚠️ Superposition / Chop Gate: Any Vector (P_"Chop" ≥38%)
The Forces: Market noise dominates directional energy vectors.
Operational Execution: Hard Veto. Freeze new entries to eliminate false breakouts.
🥀 Thrust Decay:
The Forces: Price advancing (V>0,A>0), but internal force acceleration has turned negative (J<0).
Operational Execution: Ratchet Stops. Lock in 50% scale profits; tighten stops to -0.50σ below the prior bar low.
📉 Contraction Cascade (B_1 Anchor): (P_"Down" ≥50%)
The Forces: Price falling (V<0), accelerating downward (A<0), and drop intensifying (J<0).
Operational Execution: Veto / Cash. Establishes the structural swing low print (P_(B1_low)) for future entry anchors.
V. Eliminating Lag: The Empirical Reversal Chain
Traditional moving averages lag because they wait for price level confirmation. Kinematic and Hilbert mechanics track the leading chain of physical causality:
"Delta Jerk " (ΔJ>0)⟶"Jerk " (J>0)⟶"Acceleration " (A>0)⟶"Velocity " (V>0)
│
▼ (Delta Jerk Spikes / J > 0)
<── PRIMARY SANDBOX ENTRY
│
▼ (Velocity Crosses 0.00σ)
<── CORE POSITION SCALE
By identifying the B_1→B_2 transition ( → ) with Hilbert clearance (P_"Chop" <38%), positions are established at structural turning points long before traditional indicators generate a standard buy signal.
QQQ / NDX Weekly Outlook – Week 35 of 2026 (AUG 31 - SEP 04)QQQ WEEKLY MARKET OUTLOOK
QQQ Weekly Recap Outlook
NASDAQ:QQQ served as our primary operational focus and executed flawlessly.
• Demand 1 Entry: Price delivered a textbook entry from our predefined Demand 1 Zone on Monday, providing the exact reaction we were looking for.
• Long Scenario 1: The setup captured a massive 20-point (+2.85%) bullish expansion.
• Target 1: Price reached the predefined Flip Level exactly as mapped.
• Bullish Target 1: The bullish continuation extended into Bullish Target 1, completing the full scenario as planned.
• Execution Outcome: The trade delivered an exceptional return and demonstrated the accuracy of our structural mapping and predefined levels.
(For reference, I have included last week's outlook on the right.)
UA CAPITAL Trading Desk Weekly Execution Metrics | WEEK 34
Total Trades Closed: 11
Winning Trades: 8
Losing Trades: 3
Overall Win Rate: 73%
Index Options: 1 Trade (1 Win — QQQ)
Futures Desk: 5 Trades (2W 2L on ES | 1W on NQ)
Equities Desk: 1 Trade (1 Win — MSFT)
Precious Metals: 2 Trades (2 Wins — Silver & Copper)
Forex: 1 Trade (1 Win — EUR Short)
Portfolio Hedge: VIX 17C - L (Controlled Insurance Premium)
This Week's Scenarios / Prediction
Risk Index
This oscillator reads macro conditions and converts them into a technical risk framework. It was developed internally at UA CAPITAL and remains the primary indicator I use for both short-term and long-term positioning decisions.
Long term: Risk on
Mid term: Risk on
Short term: Risk off
A warning: Macro liquidity conditions remain fragile, and a negative news catalyst could still trigger a sharp downside flush. Geopolitical risk, particularly the Iran conflict, remains elevated, while the macro environment continues to show significant compression and imbalance.
NASDAQ:QQQ Technical Look
There are two zones where I expect bullish reactions.
SWING LEVEL: 710
SUPPORT 2: 686
If price finds support and bounces from either of these two levels, I expect the following bullish targets:
FLIP LEVEL: 726.5
BULLISH TARGET 1: 738
BULLISH TARGET 2: 747
Flip Level Rejection: If price gets rejected at the Flip Level, we may look for a short opportunity targeting the Swing Level first, with further downside toward Support 2.
Decision Zone: The Flip Level appears to be a critical decision zone for the next directional move.
Blue Box Breakdown: If price breaks below the Blue Box, we may look for a short setup targeting Support 2.
A strong break above the Flip Level could initiate a move toward the Bullish Targets above.
This analysis is for educational purposes only and reflects my personal opinion. It is not financial advice.
SPY / SPX Weekly Outlook – Week 35 of 2026 (AUG 31 -SEP 04)SPY / SPX WEEKLY MARKET OUTLOOK
SPY Weekly Recap Outlook
Although the early week Demand Zones were not perfectly retested, our structural maps remained highly accurate.
• Demand Zone: Price did not provide the precise retest required for a high conviction entry, so we avoided forcing a trade.
• Long Scenario 3: During Thursday’s AM session, price broke above our predefined Flip Level, officially activating Long Scenario 3.
• Entry Discipline: Since the breakout did not provide the required pullback, we remained patient and did not chase the move.
• Price Expansion: Following the breakout, price delivered a clean 8-point (+1.00%) upward expansion.
• Execution Takeaway: The move validated the strength of our structural mapping and the institutional geometry behind our playbooks, even without a direct entry.
UA CAPITAL Trading Desk Weekly Execution Metrics | WEEK 34
Total Trades Closed: 11
Winning Trades: 8
Losing Trades: 3
Overall Win Rate: 73%
Index Options: 1 Trade (1 Win — QQQ)
Futures Desk: 5 Trades (2W 2L on ES | 1W on NQ)
Equities Desk: 1 Trade (1 Win — MSFT)
Precious Metals: 2 Trades (2 Wins — Silver & Copper)
Forex: 1 Trade (1 Win — EUR Short)
Portfolio Hedge: VIX 17C - L (Controlled Insurance Premium)
This Week's Scenarios / Prediction
Risk Index
This oscillator reads macro conditions and converts them into a technical risk framework. It was developed internally at UA CAPITAL and remains the primary indicator I use for both short-term and long-term positioning decisions.
Long term: Risk on
Mid term: Risk on
Short term: Risk off
A warning: Macro liquidity conditions remain fragile, and a negative news catalyst could still trigger a sharp downside flush. Geopolitical risk, particularly the Iran conflict, remains elevated, while the macro environment continues to show significant compression and imbalance.
SPY Technical Look
There are two zones where I expect bullish reactions.
Flip Level: 767.5
Main Bounce Zone: 759
If price finds support and bounces from either of these two levels, I expect the following bullish targets:
Bullish Target 1: 774.5
Bullish Target 2: 779.5
A break below the Flip Level could initiate a move toward the First Key Level below.
This analysis is for educational purposes only and reflects my personal opinion. It is not financial advice.
 Short
Short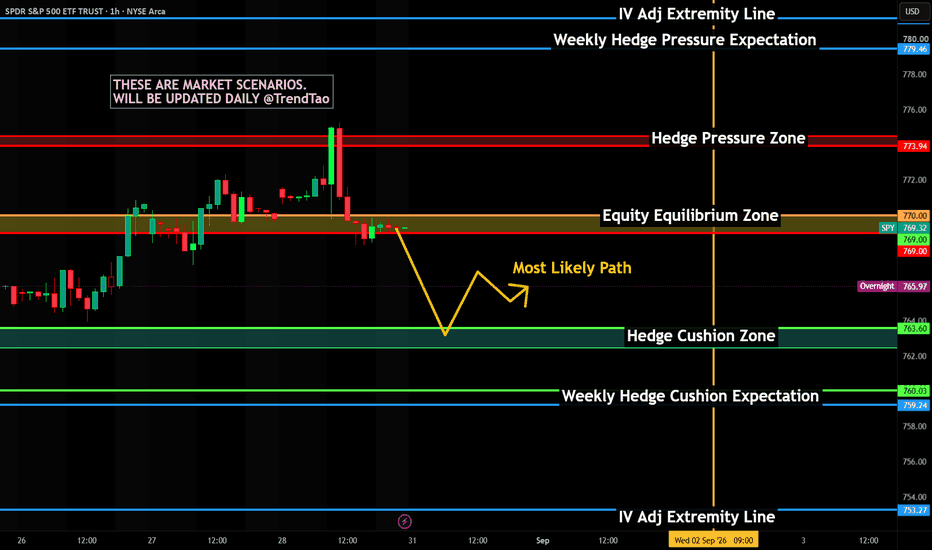
Market Independence Collapse (MIC): A Falsifiable Hypothesis forTITLE
Market Independence Collapse (MIC): A Falsifiable Hypothesis for Regime-Transition Risk
DESCRIPTION
How many genuinely independent market decisions are really left?
Markets are normally a mixture of competing views. Long-term investors, hedge funds, retail traders, analysts, journalists, options desks, systematic strategies and macro participants do not all receive the same information or react to it in the same way.
This research hypothesis asks whether markets become more fragile when those nominally independent decision processes begin to synchronize.
The danger is not consensus by itself.
The danger may be a loss of effective independence.
1. THE ORIGINAL IDEA: NARRATIVE ENTROPY COLLAPSE
Consider two markets.
In Market A, ten investors are bullish for ten different reasons:
earnings growth, valuation, rates, productivity, flows, buybacks, demographics, macro conditions, sector rotation and company-specific research.
In Market B, ten investors are bullish because essentially the same underlying thesis dominates their decision-making.
Traditional sentiment analysis may classify both markets as equally bullish.
But they do not contain the same amount of independent information.
This distinction led to the original concept of Narrative Entropy Collapse (NEC).
A simple starting measure is Shannon entropy:
Hn = -Σ p(i) log p(i)
where p(i) represents the share of observed narrative mass assigned to narrative i.
Higher Hn means explanations are distributed across many narratives.
Lower Hn means market explanations are becoming concentrated.
But raw entropy alone is not enough.
A major event can legitimately cause many independent analysts to reach the same conclusion.
The stronger question is whether previously distinct information communities — institutional research, news, retail/social discussion, derivatives, market behavior and macro/cross-asset information — are independently converging on the same latent themes.
2. WHY CRITICALITY IS RELEVANT
The theoretical motivation comes partly from interacting-agent models, herding research and statistical-physics concepts such as criticality and phase transitions.
The useful intuition is that stronger coupling between individual agents can create nonlinear collective behavior.
Near a critical state, relatively small disturbances may generate disproportionately large system responses.
But traders are not atoms.
Market participants differ in capital, leverage, horizon, mandate, information, incentives and strategy.
They learn, anticipate one another, change behavior and operate inside evolving market structures.
So the physics analogy is motivation — not proof and not a literal production model.
The hypothesis is narrower:
As effective independence falls, market sensitivity to disturbances may increase.
3. THE CRITIQUE THAT EXPANDED THE THEORY
Narrative convergence alone is not enough.
Markets can synchronize without participants believing the same thing.
Dealer hedging can mechanically force buying or selling as price changes.
Systematic strategies can respond to common price, volatility or trend thresholds.
Volatility-control strategies can deleverage simultaneously.
Passive flows and portfolio rebalancing can produce correlated transactions.
Liquidity deterioration can amplify all of these responses.
This means Narrative Entropy Collapse is only one possible form of a broader phenomenon.
That broader hypothesis is Market Independence Collapse.
4. THREE WAYS MARKET INDEPENDENCE CAN DISAPPEAR
SAME STORY
Different information communities converge on the same explanation.
Narrative independence falls.
SAME TRADE
Participants may have different reasons for acting but end up holding increasingly similar economic exposures.
Position independence falls.
SAME TRIGGER
Participants may retain different beliefs and positions but respond to the same price, volatility, liquidity or risk threshold.
Behavioral independence falls.
The central idea is that the number of market participants is not necessarily the number of independent market decisions.
5. THE MIC STATE VECTOR
The hypothesis becomes more interesting when several forms of dependence converge.
Hn — Narrative Diversity
Are genuinely independent explanations becoming less diverse?
Lower Hn may indicate increasing narrative concentration.
Hp — Exposure Diversity
Are different strategies converging on the same underlying economic exposure?
Lower Hp means greater position concentration.
J — Directional Coupling
Are previously separate communities increasingly leading, following or mirroring one another?
Higher J means stronger cross-community dependence.
M — Mechanical Sensitivity
How strongly could common price, volatility or liquidity thresholds force synchronized behavior?
Higher M means greater mechanical response sensitivity.
L — Liquidity
Can the market absorb synchronized flows without a disproportionate price response?
Lower L may increase fragility.
C — Correlation / Crowding
Are assets, factors or strategies increasingly behaving like one position?
Higher C means greater co-movement.
Additional control or state variables may include:
D — dispersion
V — realized and implied volatility
P — positioning / crowding proxies
Macro state
Market structure
The important point is that no single variable is expected to be sufficient.
The dangerous configuration is potentially:
Narrative diversity ↓
Exposure diversity ↓
Directional coupling ↑
Mechanical sensitivity ↑
Liquidity ↓
Crowding / correlation ↑
Fragility is therefore not simply:
“Everyone is bullish.”
It is closer to:
“Too many nominally separate actors may behave similarly when the same disturbance arrives.”
6. WHO MOVED FIRST?
Correlation alone is not enough.
Suppose price rises first and financial media subsequently converge on a bullish explanation.
That may simply be:
PRICE → NARRATIVE
The language is explaining something that already happened.
The more interesting possibility is:
INFORMATION / POSITIONING / STRUCTURE
→ NARRATIVE CONVERGENCE
→ MARKET TRANSITION
That requires directional dependence rather than simple contemporaneous correlation.
Possible methods include:
lead-lag tests
mutual information
transfer entropy
semantic lead-lag transitions
Each component should be tested independently before being combined into a composite score.
7. THE MEASUREMENT CAN CREATE A FALSE SIGNAL
Narrative analysis introduces a major measurement problem.
Suppose one embedding model and one clustering method show a dramatic entropy collapse.
If the effect disappears after changing the clustering method, topic resolution, lookback window or source weighting, the result may simply be a hyperparameter artifact.
A robust Narrative Entropy Collapse should therefore survive reasonable changes in:
embedding models
clustering methods
topic resolution
lookback windows
source weighting
source composition
The phenomenon should remain visible even when the measurement apparatus changes.
8. WHAT MIC WOULD ACTUALLY PREDICT
The primary target should not initially be:
“Market up”
or
“Market down.”
The primary output should be something like:
P(Regime Transition within horizon h)
Possible objective transition labels include:
volatility expansion
liquidity deterioration
correlation spike
tail return
drawdown
upside melt-up
statistically defined regime change
Direction should be treated as a second problem.
A fragile system could resolve downward through liquidation.
It could also resolve upward through a squeeze or melt-up.
Transition probability ≠ directional probability.
9. INITIAL MODEL CONCEPT
Conceptually:
Transition Probability =
f(
narrative entropy,
exposure diversity,
cross-community coupling,
mechanical sensitivity,
positioning,
liquidity,
volatility,
correlation,
dispersion,
macro state,
market structure
)
The first models should be interpretable.
More complex models should only be added if they demonstrate incremental information beyond simpler specifications.
Complexity has to earn its place.
10. HOW TO TEST THE THEORY
This framework should be built as a falsifiable empirical study.
POINT-IN-TIME DATA
Historical data must reflect only information that was actually available at each moment.
BASELINE MODELS
MIC has to compete against simpler models using variables such as:
realized volatility
implied volatility
trend / returns
breadth
liquidity
positioning
macro variables
conventional sentiment
cross-asset correlation
market microstructure
WALK-FORWARD TESTING
Train on historical data.
Freeze the model.
Test on genuinely unseen future periods.
Then roll forward.
Financial time series should not be randomly shuffled.
ABLATION TESTS
Remove individual components one at a time.
If narrative entropy adds nothing after volatility and positioning are known, then the narrative component fails.
If nearly all predictive information comes from options data, then the result should be described as an options signal rather than a new theory.
PLACEBO TESTS
Randomize narrative timestamps.
Use unrelated text.
Test fake transition dates.
Shift signals forward and backward.
Apply realistic publication and processing delays.
ROBUSTNESS
Require the relationship to survive different:
assets
decades
volatility regimes
bull and bear markets
time horizons
narrative classifications
data sources
CALIBRATION
Relevant metrics include:
precision
recall
ROC-AUC
PR-AUC
Brier score
calibration
lead time
false-alarm duration
out-of-sample loss improvement
information gain over baselines
11. KILL CRITERION
This is the most important part.
If Market Independence Collapse measures do not add stable out-of-sample predictive information beyond conventional volatility, liquidity, positioning and correlation variables, the theory should be rejected or reduced to a descriptive market-state measure.
The purpose is not to protect the theory.
The purpose is to design a test capable of proving it wrong.
12. LIMITATIONS
There are many ways MIC could fail.
Consensus may simply be correct.
Market participants are heterogeneous.
Private information is largely invisible.
Narrative measurements may react to price rather than lead it.
Mechanical flows may dominate narrative effects.
Data-source composition changes through time.
A widely used signal could become reflexive.
The same narrative can correspond to different positions or horizons.
Criticality may be directionless.
Critical thresholds may drift.
Multiple testing can create false discoveries.
Exogenous shocks can overwhelm endogenous market structure.
Even successful prediction would not prove that Market Independence Collapse caused the subsequent transition.
THE CENTRAL HYPOTHESIS
Market Independence Collapse proposes that the probability of a market-regime transition may increase when nominally independent participants become increasingly synchronized through common narratives, common economic exposures, common behavioral triggers, or combinations of all three — particularly when coupling is high and liquidity is limited.
This is currently a research hypothesis.
It is not a validated indicator, a current MIC reading, or a demonstrated trading edge.
The next step is empirical:
Measure it.
Control for simpler explanations.
Test it forward.
Show the false positives.
Reject it if it adds no information.
DISCLAIMER
This post is for educational and research purposes only. It does not constitute financial advice, investment advice, a recommendation to buy or sell any security, or a recommendation to engage in any investment strategy.
Market Independence Collapse (MIC) is an unvalidated research hypothesis and should not be used as a standalone basis for investment decisions. QQQ Weekly Outlook: 701 Support vs 725 Breakout | Aug. 24-28QQQ Weekly Outlook: 701 Support vs 725 Breakout | Aug. 24-28
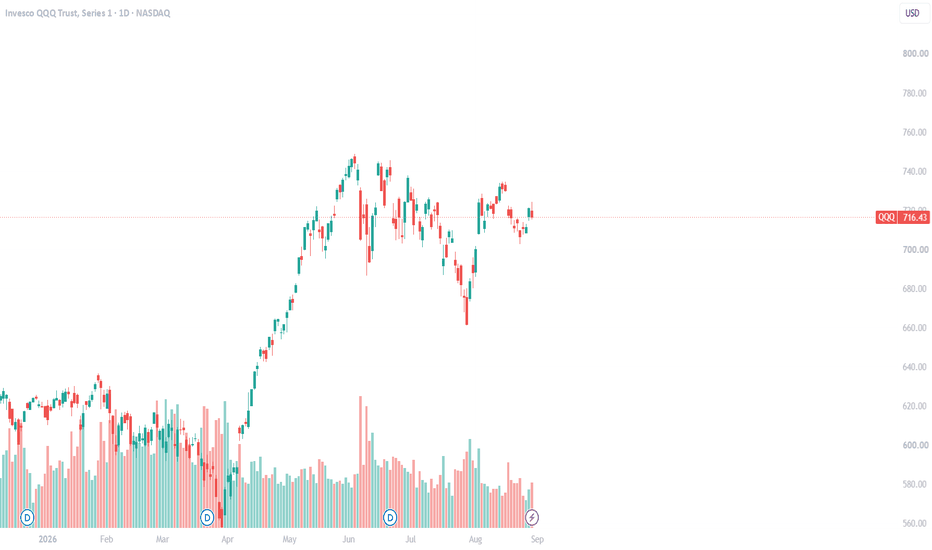
BCBA:QQQ QQQ closed Friday at 713.44 with the larger Weekly and Monthly trend still bullish, while the Daily chart has shifted into a mixed/pullback state.
That combination matters. I am not treating the current weakness as a confirmed trend reversal, but I am also not interested in chasing upside while Daily momentum is soft and price remains below the first major resistance cluster.
There are also three short-term caution signals worth keeping in mind. QQQ recently tested the developing shadow trendline and rejected lower from that area, a Buying Exhaustion signal formed near the recent highs, and an open gap remains below current price. None of those conditions guarantees further downside, but together they strengthen the case for patience while the Daily chart works through this pullback.
The cleanest way to approach this week is as a decision zone between roughly 701 and 725 .
The levels I am watching
Immediate resistance is near 725.39 . Above that, the next upside reference levels are approximately 736.10 and 745.74 .
On the downside, the first important support is near 701.86 . Below that, I am watching 686.19 , followed by the 662-664 area .
There is also an unfilled gap below current price. I am keeping that on the map because continued Daily weakness could pull price back toward that unfinished area before the larger bullish trend attempts another continuation. I do not assume that every gap must fill, but it is an additional downside reference while price remains beneath resistance.
The chart currently also contains competing measured-move references from confirmed Double Bottom and Double Top structures. The bullish DB projection is near 766.02 , while the bearish DT projection is near 664.20 . I do not view either target as a prediction by itself. They become more relevant only if price confirms the corresponding side of the structure.
Bullish scenario
As long as QQQ continues to defend the 701.86 support area , the larger bullish Weekly/Monthly backdrop remains intact.
The first thing bulls need to prove is a clean reclaim of 725.39 . If price can regain that level and hold above it, I would then look toward 736.10 , followed by 745.74 .
A sustained breakout through the upper resistance zone would make the 766 area increasingly relevant as a larger measured-move objective.
A reclaim would also help neutralize two of the current caution signals: the recent rejection from the shadow trendline and the Buying Exhaustion signal near the highs. If buyers can absorb those warnings and push back through resistance, that would be meaningful evidence that the pullback is losing control.
Until 725 is reclaimed, however, I consider the upside case unfinished rather than confirmed.
Bearish scenario
The bearish case becomes more interesting if QQQ loses 701.86 on a closing basis and cannot quickly reclaim it.
The recent interaction with the developing shadow trendline is important here. Price reached that projected trend reference and then rotated lower instead of breaking through it. Combined with the recent Buying Exhaustion signal, that rejection gives sellers a short-term technical argument even though the larger Weekly and Monthly trends remain bullish.
That would put 686.19 into focus as the next important support area. If sellers can also break that level, the chart opens toward the 662-664 zone , where the third support cluster and the current Double Top measured target are closely aligned.
The open gap below price is another area I would monitor during any downside move. If QQQ begins rotating toward that gap, how buyers respond there could help determine whether this remains a normal bullish-market pullback or develops into something larger.
That confluence makes the low-660s an important downside reference if the Daily pullback develops into a larger correction.
The neutral scenario may matter first
QQQ is currently in a low-expansion environment with relatively light participation. That makes a period of back-and-forth trade between 701.86 and 725.39 completely reasonable.
The shadow-trendline rejection, Buying Exhaustion and open gap argue against assuming that the next move must immediately be higher. At the same time, the bullish Weekly and Monthly structure argues against automatically treating those warnings as the beginning of a major bearish trend.
If price remains trapped inside that range, I would rather let the market reveal direction than force a bullish or bearish opinion in the middle.
For me, the simple map is:
Above 725.39: bulls begin regaining control.
Between 701.86 and 725.39: decision/chop zone.
Below 701.86: downside risk increases materially.
This is also a major catalyst week
Wednesday is particularly important. The U.S. Bureau of Economic Analysis is scheduled to release both the second estimate of Q2 GDP and J uly Personal Income and Outlays/PCE data at 8:30 a.m. ET . NVIDIA is also scheduled to report fiscal Q2 results Wednesday after the market closes, with its conference call at 5:00 p.m. ET.
Friday brings another major macro event when Fed Chair Kevin Warsh is scheduled to speak at Jackson Hole at 10:00 a.m. ET .
With QQQ heavily exposed to large-cap technology and AI leadership, the combination of inflation/growth data, NVIDIA earnings and Fed communication could easily be the catalyst that pushes price out of the current decision range.
My read entering Monday
The higher-timeframe trend remains bullish, but the Daily chart is still working through a pullback with mixed structure.
The shadow trendline has already produced a visible rejection, Buying Exhaustion remains part of the current technical picture, and an open gap below gives the market unfinished downside business if sellers continue pressing. Those are caution signals, not predictions, and I want price itself to confirm whether they matter.
So I am starting the week patient rather than directional .
I want to see how QQQ behaves around 701 support and whether buyers can eventually reclaim 725 resistance . Whichever side proves itself first will tell us much more than trying to predict the move before it happens.
The levels are already on the chart. Now price has to choose. Long 
Seasons of Life.Sharing a chapter from my learning about Jim Rohn.
In **Chapter 11**, he talks about the **Seasons of Life**.
Jim Rohn used the cycle of nature as a metaphor for life: **Spring, Summer, Fall, and Winter.**
No matter how much we want to, we cannot eliminate winter. But we can learn how to operate during every season.
🌱 **SPRING — OPPORTUNITIES**
There are periods when everything seems to come together. The market gives us clear setups, scenarios play out, confidence increases, and there is a feeling that everything is flowing.
Spring is not only a time to enjoy the results — it is also the time to **plant the seeds.**
Learn. Document your trades — in the spirit of Mark Douglas. Study what works and what doesn’t. Work on your psychology and build capital while maintaining proper risk management.
☀️ **SUMMER — WORK**
This is the stage where you have to work.
Repeat the same process over and over again. Follow the same strategy. Don’t constantly change things just because the market gives you a few losing trades.
Risk management and the trading plan remain consistent.
This is the stage where we **cultivate what we planted in the spring.**
🍂 **FALL — HARVEST**
After a period of work, the results begin to show.
Profits. Progress. Confidence. Experience.
But this is exactly where we need to be careful.
A good period can create the feeling that **“I’m unstoppable.”**
That’s when overconfidence can become dangerous.
❄️ **WINTER — DIFFICULT PERIODS**
There will be periods when nothing works the way we want it to.
Losses come — sometimes repeatedly. A losing streak can last for days or even weeks. Every setup seems to fail. Every scenario falls apart.
**But winter is not a sign that we have failed.**
Winter is part of the game.
The question is not: *How do I prevent winter?*
The question is: **How do I operate during winter?**
A good trader doesn’t need to win in every season.
He needs to be able to **survive the winter**, so he is still in the game when the next spring arrives.
And this is where **risk management** becomes everything.
If I risk too much during difficult periods, I may reach the next spring with no capital and no ability to participate in it.
Protect the capital. Document everything. Improve. Stay disciplined. Don’t let emotions take control.
That is how I give myself the opportunity to enter the next season stronger than before.
At the end of the day, the market is always changing.
There are periods when we need to **attack**, and there are periods when we need to **defend.**
🌱 **Spring — Plant**
☀️ **Summer — Work**
🍂 **Fall — Harvest**
❄️ **Winter — Survive & Prepare**
**Don’t let the season you are currently in convince you that it will last forever.**
Have a great week everyone! 🙏
 Long
Long
Long 
 Long
Long


