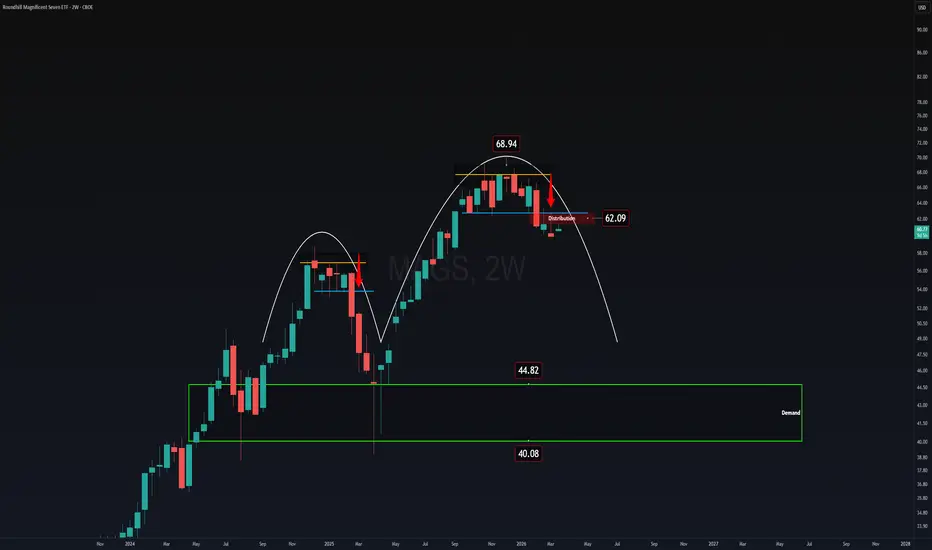
$MAGS, this is how these market patterns typically play out.CBOE:MAGS , this is how these market patterns typically play out.
The next major market inflection point, from bull market to bear market, could be a once-in-a-few-years opportunity.
No one knows exactly when the trend will turn.
I’ll analyze the stock market hour by hour, day by day and week by
Compare with Roundhill Magnificent Seven ETF
Key stats
Fund info
Home page
Inception date
Apr 11, 2023
Structure
Open-Ended Fund
Replication method
Physical
Dividend treatment
Distributes
Distribution tax treatment
Qualified dividends
Income tax type
Capital Gains
Max ST capital gains rate
39.60%
Max LT capital gains rate
20.00%
Primary advisor
Roundhill Financial, Inc.
Distributor
Foreside Fund Services LLC
ISIN
US53656G4982
CUSIP
53656G498
FIGI
BBG01G5ZXR40
Identifiers
ISIN US53656G4982
MAGS, at the time of launch, is the first-ever FAAMG ETF in the US market space. The fund targets a narrow portfolio of 5-10 stocks publicly known as tech giants, aiming to capture the largest companies in social media, e-commerce, consumer discretionary, cloud computing, tech hardware, and software. On an annual basis, the adviser reviews the US tech universe to select the largest companies based on market cap, trading volume, and sector relevance. Holdings are equally weighted in the portfolio and rebalanced quarterly. As an actively managed fund, the adviser has full discretion in managing the portfolio. From time to time, 100% of the funds assets may be invested in US treasury securities, money market funds, and/or short-term bond ETFs. Holdings may include common stocks and ADRs, though the fund primarily gains exposure through the use of swaps and forward contracts. Prior to Nov. 9, 2023, the fund was called Roundhill BIG Tech ETF, trading under the ticker BIGT.
Classification
What's in the fund
Exposure type
Technology Services
Government
Breakdown by region
Top 10 holdings
Stock Market Forecast | BTC TSLA NVDA AAPL AMZN META MSFT0:00 - Weekly Stock Market Update & Sector Rotation Analysis
1:08 - Market Sentiment Data: Extreme Bearishness & Fear Gauge Disconnect
2:47 - Dark Pool Insights: MAG7 ETF ($MEGX) Short Squeeze Potential
3:26 - QQQ & Semiconductors (SMH): Rally Drivers vs. Tech Underperformance
5:40 - SpaceX Dark Poo
MAGS LONG — 4H ALMA Avg | 08.06.2026Roundhill Magnificent Seven ETF · 4H · long only.
ALMA Averaging Strategy: ALMA 3 / σ2, SD band 2, min diff 1 bar to add / 4 bars to exit, 25% per bar, up to 4 adds, hard stop −10% from average entry.
Strategy Tester (Apr 2023 – May 2026):
117 trades · win rate 85.5% · profit factor 2.68 · net
MAGS Looking Weak - Double Top PatternOver the weekends, war has re-escalated. This comes in tangent with last Friday's market decline - forming a nice looking Double Top on MAGS.
To validate this pattern, we should wait for a retest of the neckline at $68.
Then continue lower to the measured move target towards $65-$66.
In the immedi
MAGS Long 5/13/2026 Breakout and confirmation . MAGS is breaking out of a multi month but relatively comparatively "cleaner/tighter" base with nice price action . I took a position today will asses risk versus the breakout line.
best case scenario would be a longer term multi month cyclical hold period and worst would be a small loss under the
MAGS7 | 2027 BottomSeeing that MAGS7 is peaked tells me that markets are for sure topped out.
I'm expecting to see low 40s towards the demand zone as price looks to distribute.
In terms of looking for a bottom we can see some action in the June - July months of this year but cant say for sure if we will expect the
MAGS at Support? After a prolonged and aggressive corrective phase that began in October 2025, the MAG 7 stocks have displayed sharply divergent performance. Names such as Microsoft and Netflix experienced significant drawdowns, while Alphabet and Nvidia managed to maintain relative strength throughout the correctio
MAGS About To CRACK!Magnificent 7 are about to start cracking down here, out of the bear flag.
We have a big ars topping M pattern in place.
Their current Market Cap is about $18.9 trillion. This can evaporate very quickly. CAUTION!
THANK YOU for helping me hit 5,000 followers! 🙏🔥
Let’s keep going.
If you find valu
See all ideas
Summarizing what the indicators are suggesting.
Oscillators
Neutral
SellBuy
Strong sellStrong buy
Strong sellSellNeutralBuyStrong buy
Oscillators
Neutral
SellBuy
Strong sellStrong buy
Strong sellSellNeutralBuyStrong buy
Summary
Neutral
SellBuy
Strong sellStrong buy
Strong sellSellNeutralBuyStrong buy
Summary
Neutral
SellBuy
Strong sellStrong buy
Strong sellSellNeutralBuyStrong buy
Summary
Neutral
SellBuy
Strong sellStrong buy
Strong sellSellNeutralBuyStrong buy
Moving Averages
Neutral
SellBuy
Strong sellStrong buy
Strong sellSellNeutralBuyStrong buy
Moving Averages
Neutral
SellBuy
Strong sellStrong buy
Strong sellSellNeutralBuyStrong buy
Displays a symbol's price movements over previous years to identify recurring trends.
Frequently asked questions
An exchange-traded fund (ETF) is a collection of assets (stocks, bonds, commodities, etc.) that track an underlying index and can be bought on an exchange like individual stocks.
MAGS trades at 68.23 USD today, its price has fallen −0.74% in the past 24 hours. Track more dynamics on MAGS price chart.
MAGS net asset value is 68.75 today — it's risen 9.15% over the past month. NAV represents the total value of the fund's assets less liabilities and serves as a gauge of the fund's performance.
MAGS assets under management is 4.29 B USD. AUM is an important metric as it reflects the fund's size and can serve as a gauge of how successful the fund is in attracting investors, which, in its turn, can influence decision-making.
MAGS price has risen by 5.62% over the last month, and its yearly performance shows a 12.97% increase. See more dynamics on MAGS price chart.
NAV returns, another gauge of an ETF dynamics, have risen by 9.15% over the last month, showed a −2.33% decrease in three-month performance and has increased by 15.44% in a year.
MAGS fund flows account for 1.11 B USD (1 year). Many traders use this metric to get insight into investors' sentiment and evaluate whether it's time to buy or sell the fund.
Since ETFs work like an individual stock, they can be bought and sold on exchanges (e.g. NASDAQ, NYSE, EURONEXT). As it happens with stocks, you need to select a brokerage to access trading. Explore our list of available brokers to find the one to help execute your strategies. Don't forget to do your research before getting to trading. Explore ETFs metrics in our ETF screener to find a reliable opportunity.
MAGS invests in bonds. See more details in our Profile section.
MAGS expense ratio is 0.30%. It's an important metric for helping traders understand the fund's operating costs relative to assets and how expensive it would be to hold the fund.
No, MAGS isn't leveraged, meaning it doesn't use borrowings or financial derivatives to magnify the performance of the underlying assets or index it follows.
In some ways, ETFs are safe investments, but in a broader sense, they're not safer than any other asset, so it's crucial to analyze a fund before investing. But if your research gives a vague answer, you can always refer to technical analysis.
Today, MAGS technical analysis shows the buy rating and its 1-week rating is buy. Since market conditions are prone to changes, it's worth looking a bit further into the future — according to the 1-month rating MAGS shows the buy signal. See more of MAGS technicals for a more comprehensive analysis.
Yes, MAGS pays dividends to its holders with the dividend yield of 1.43%.
MAGS trades at a premium (0.02%).
Premium/discount to NAV expresses the difference between the ETF’s price and its NAV value. A positive percentage indicates a premium, meaning the ETF trades at a higher price than the calculated NAV. Conversely, a negative percentage indicates a discount, suggesting the ETF trades at a lower price than NAV.
MAGS shares are issued by Roundhill Financial, Inc.
MAGS follows the No Underlying Index. ETFs usually track some benchmark seeking to replicate its performance and guide asset selection and objectives.
The fund started trading on Apr 11, 2023.
The fund's management style is active, aiming to outperform its benchmark index by actively selecting and adjusting assets. The goal is to achieve returns that exceed those of the index the fund tracks.