Long SPGIGood morning traders,
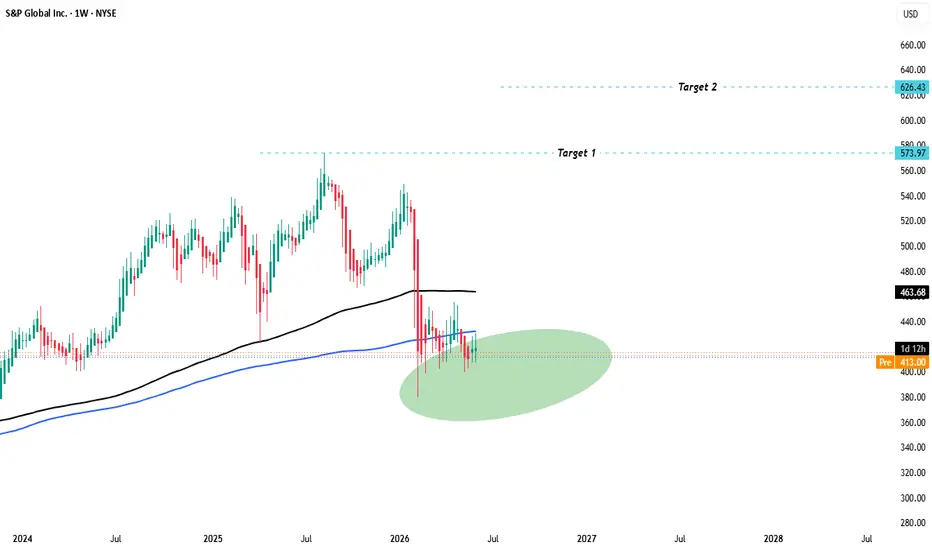
SPGI emerged bullish after closing above 200MA on daily timeframe. Below it would invalidate the scenario.
However the fundamentals look strong, the biggest reason to own SPGI remains S&P Global Ratings.
The business benefits from an extraordinary moat:
Regulatory recognition.
Reputation built over decades.
Deep relationships with issuers and investors.
Very high barriers to entry.
Global network effects.
Extremely attractive incremental margins.
In 2025, Ratings generated approximately $4.7 billion in revenue and $3.0 billion in segment operating profit, implying an exceptional operating margin.
The bullish scenario is that the market is still underestimating the duration of the global debt issuance cycle.
Potential drivers include:
Continued refinancing of existing corporate debt.
Growth in private credit.
Infrastructure financing.
Sovereign borrowing.
Structured finance.
Emerging-market capital formation.
AI and data-center infrastructure financing.
A world with structurally higher debt levels can actually be very attractive for SPGI: every new bond, refinancing, securitization or structured product potentially expands the addressable ratings opportunity.
However the growth opportunity could be precisely in uncharted territory > Private credit
One of the most interesting bullish arguments is that SPGI does not need traditional public bond markets alone to grow.
Private credit has become a major source of corporate financing, and institutional investors increasingly require:
Independent risk assessment.
Data.
Benchmarking.
Portfolio analytics.
Transparency.
Valuation infrastructure.
If private markets continue institutionalizing, SPGI can increasingly become part of the infrastructure layer of private capital markets.
This is important because the company is not simply selling information. It is positioning itself closer to the workflow where financial decisions are made.
This position is part of a diversified portfolio and my track record is public.
Follow the rules and you will never blow up any account
1. Never add risk to a losing position
Do not average down or martingale. Adding more capital to a trade that is already in the red only increases your exposure to a failing setup. If the market proves your original thesis wrong, accept the small loss and move on rather than digging a deeper hole.
2. Don't be the first one in or the last one out
Avoid trying to catch the exact top or bottom. Trying to predict the perfect reversal point is highly risky. It is far more profitable to wait for price confirmation before entering, and to take your profits before the trend completely exhausts itself.
3. Think like a fundamentalist, trade like a technician
Use macro context for direction, but the chart for execution. Economic news and data tell you why the market is moving and where general sentiment lies. However, structural technical analysis (price action, key levels) must dictate when to act—giving you your exact entry, stop-loss, and take-profit coordinates.
4. Keep your analysis simple
Avoid analysis paralysis. Overcomplicating your charts with dozens of conflicting technical indicators only breeds hesitation and confusion. Clean, minimalist charts that focus on basic market structure, liquidity zones, and clear candle breaks are much easier to execute consistently under pressure.
5. Position size
Start small and increase if trend confirms.
6. Pay attention to the close, not the noise
Let candles print completely before making a decision. Mid-candle price movements are filled with volatile fakeouts and algorithmic noise designed to trigger retail FOMO (fear of missing out). To maintain an edge, make your analytical judgments based on closed higher-timeframe candles (like the daily close).
In-depth trading ideas
S&P Global: Wide Moat Meets a Technical TurnaroundSPGI is seeing buying interest following a retracement as its turnaround continues. The stock has regained its upward momentum and now trades above the 20 and 50 EMAs, indicating improving technical strength.
S&P Global, Inc. is a $133bn market cap company that provides transparent and independent ratings, benchmarks, analytics, and data to the capital and commodity markets worldwide. It operates through four segments: Ratings, Indices, Energy, and Market Intelligence. Its services include credit ratings and research, investment benchmarks, energy and commodity pricing information, and multi-asset data and analytics integrated with workflow solutions.
SPGI has a wide economic moat and has grown revenue and EPS for the last three quarters, with the most recent growth rates of 11% and 18%, respectively. Operating and net margins stand at 47% and 29%, while ROE and ROIC are 15% and 11%. The company has a current ratio of 1.0x and a debt-to-equity ratio of 0.5x.
Revenue is forecast to decline over the next three quarters. EPS is forecast to grow 6% in the first quarter, decline in the second, and increase again in the third. The average analyst target price is approximately $519.27, implying about 16% upside.
S&P Global IncS&P Global Inc. occupies a unique position within the global financial ecosystem through its activities in credit ratings, market intelligence, financial data services, index management, and analytical solutions. The company's business model benefits from the ongoing demand for financial information, risk assessment, and capital market transparency, making it an important infrastructure provider to institutional investors worldwide.
The longer-term technical picture continues to suggest that the broader trend remains constructive. Nevertheless, a favorable higher-timeframe structure does not automatically translate into an optimal entry point. Market participants may prefer to see evidence that buyers are actively regaining control on lower timeframes before increasing exposure.
One practical method of monitoring this transition is observing whether price can establish itself above the 200-period moving average on lower timeframes, allowing the moving average to gradually shift beneath price action. Such behavior may indicate improving trend quality and growing participation from buyers.
Beyond technical considerations, investors may find additional value in examining:
• Revenue stability across market cycles
• Growth in subscription-based information services
• Free cash flow generation and capital allocation efficiency
• Competitive advantages in ratings, indices, and financial data businesses
• Intrinsic value estimates derived from cash-flow-based valuation methods
As always, technical signals are most effective when evaluated alongside fundamental quality and disciplined portfolio management. Position sizing, risk limits, and independent research remain critical components of a sustainable investment process.
This commentary reflects a personal market interpretation based on publicly available information and technical observations. It is provided for educational purposes only and should not be considered financial advice or a recommendation to buy or sell any security.
S&P Global Inc. short position Hi traders,
The price is approaching the previous all time high and we believe that it´s area where we can expect the profit taking therefore it can be the entry for a short position.
If we get rejection at the previous all time high, the pullback will be likely before any further uptrend continuation .
The target and the stop loss are shown on the chart.
Good luck!
SPGI - WeeklySPGI- currently down 28% from the ATH, and still in its downtrend.
Has reached and held support at 327. Might see another touch of 327 before attempt to change the trend by gaining yellow (360.55)
Targets in orange if 360.55 is gained as support.
If support is lost then targeting below in cyan.
SPGI. LONG IDEA.2ND stock trading idea!!
Open = 360.00
Target/TP = 390.00
SL= 350.00
Opening level = 360.00 Marks the Beginning for a possible bullish trend (primary/starting level)
Closing level = 390.00 A key level in the overall trend.
(THIS IDEA IS MAINLY BASED ON TECHNICALS)
(this is a personal idea based on what i am seeing MY CHART.)
SPGIit is an H&S with incorrect volumes but it is visible on weekly, I don't know if the volumes are important, maybe they are on the head but they are obscured by the enormous subsequent volumes and on the left shoulder they arrived a little late for the euphoria of the covid
perhaps in June there was a great build-up of sales
I'm interested in entering
SnP Global for further drops. SPGIA new fractal in formation post that rally on the daily. We are awaiting a revisit on the 0.618 level at first and for a divergence for an exit signal post. There is plenty of time for this to happen if Fibtime is to be believed.
We are not in the business of getting every prediction right, no one ever does and that is not the aim of the game. The Fibonacci targets are highlighted in purple with invalidation in red. Confirmation level, where relevant, is a pink dotted, finite line. Fibonacci goals, it is prudent to suggest, are nothing more than mere fractally evident and therefore statistically likely levels that the market will go to. Having said that, the market will always do what it wants and always has a mind of its own. Therefore, none of this is financial advice, so do your own research and rely only on your own analysis. Trading is a true one man sport. Good luck out there and stay safe.
SPGI - Longer Term Trend Line SPGI has formed an ascending broadening formation or a megaphone pattern in two situations with a common uptrend line
In the first situation price dipped to the longer term (green) Trend line once the pattern completed
As the second situation is completing now, price should result in the same position on the longer term trend line (indicated by the curvy arrow)