S&P Global Inc.S&P Global Inc.S&P Global Inc.

S&P Global Inc.

No trades
No trades

Compare with S&P Global Inc.


Market capitalization
‪130.75 B‬USD
16.43USD
‪4.47 B‬USD
‪15.34 B‬USD
‪293.95 M‬
Beta (1Y)
0.55
Next report date
Report period
EPS estimate
Revenue estimate
Employees (FY)
‪44.5 K‬
Change (1Y)
‪+2.15 K‬+5.08%
Revenue / Employee (1Y)
‪344.63 K‬USD
Net income / Employee (1Y)
‪100.47 K‬USD

Company info


CEO
PikLing Martina Cheung
Headquarters
New York
Founded
1917
IPO date
Feb 14, 1929
ISIN
US78409V1044
CUSIP
78409V104
FIGI
BBG000BP1Q11
Identifiers
ISIN US78409V1044
CFI code
ESVUFR
S&P Global, Inc. engages in the provision of transparent and independent ratings, benchmarks, analytics, and data to the capital and commodity markets worldwide. It operates through the following segments: Ratings, Indices, Energy, and Market Intelligence. The Ratings segment provides credit ratings, research, and analytics. The Indices segment maintains a wide variety of valuation and index benchmarks for investment advisors, wealth managers, and institutional investors. The Energy segment is involved in information and benchmark prices for the energy and commodity markets. The Market Intelligence segment covers multi-asset-class data and analytics integrated with purpose-built workflow solutions. The company was founded by James H. McGraw and John A. Hill in 1917 and is headquartered in New York, NY.
Performance
Revenue to profit conversion
Debt level and coverage
Earnings
Next:

See all ideas 

Summarizing what the indicators are suggesting.
Neutral
SellBuy
Strong sellStrong buy
Strong sellSellNeutralBuyStrong buy
Neutral
SellBuy
Strong sellStrong buy
Strong sellSellNeutralBuyStrong buy
Neutral
SellBuy
Strong sellStrong buy
Strong sellSellNeutralBuyStrong buy
An aggregate view of professional's ratings.
Neutral
SellBuy
Strong sellStrong buy
Strong sellSellNeutralBuyStrong buy
Neutral
SellBuy
Strong sellStrong buy
Strong sellSellNeutralBuyStrong buy
Neutral
SellBuy
Strong sellStrong buy
Strong sellSellNeutralBuyStrong buy
Displays a symbol's price movements over previous years to identify recurring trends.
Maturity dateAug 1, 2028
Coupon4.75% (Fixed)
Maturity dateMay 1, 2029
Coupon4.25% (Fixed)
Maturity dateAug 15, 2060
Coupon2.30% (Fixed)
Maturity dateDec 1, 2049
Coupon3.25% (Fixed)
Maturity dateNov 15, 2037
Coupon6.55% (Fixed)
Maturity dateDec 4, 2035
Coupon4.80% (Fixed)
Maturity dateSep 15, 2033
Coupon5.25% (Fixed)
Maturity dateJan 15, 2031
Coupon4.25% (Fixed)
Maturity dateAug 15, 2030
Coupon1.25% (Fixed)
Maturity dateDec 1, 2029
Coupon2.50% (Fixed)
Maturity dateMay 1, 2029
Coupon4.25% (Fixed)

See all SPGI bonds 

Weight0.16%
Market value‪3.78 B‬
Weight0.19%
Market value‪3.28 B‬
Weight0.20%
Market value‪1.76 B‬
Weight0.20%
Market value‪1.67 B‬
Weight0.44%
Market value‪1.13 B‬
Weight1.65%
Market value‪916.58 M‬
Weight0.54%
Market value‪706.66 M‬
Weight0.20%
Market value‪348.91 M‬
Weight0.52%
Market value‪332.14 M‬
Weight0.20%
Market value‪323.08 M‬
Weight0.20%
Market value‪323.08 M‬

Explore more ETFs 

Frequently asked questions


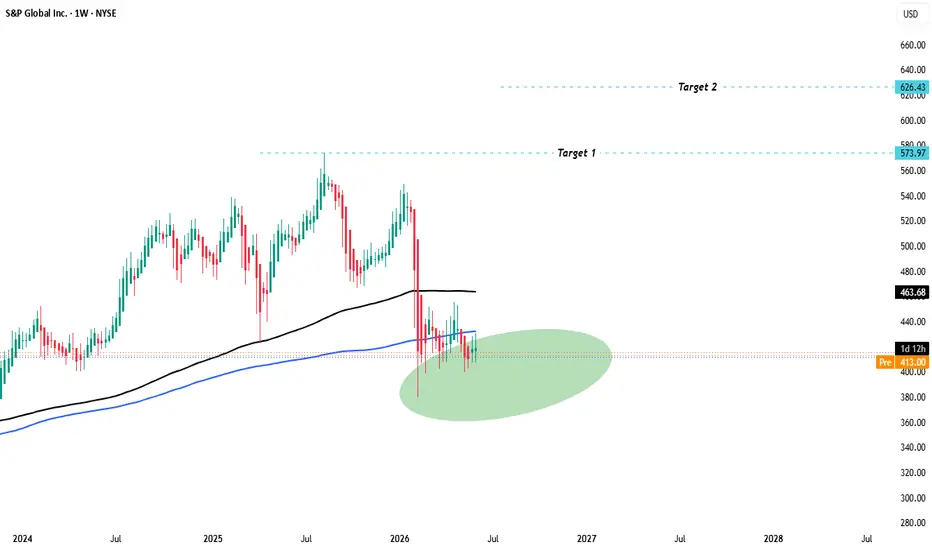
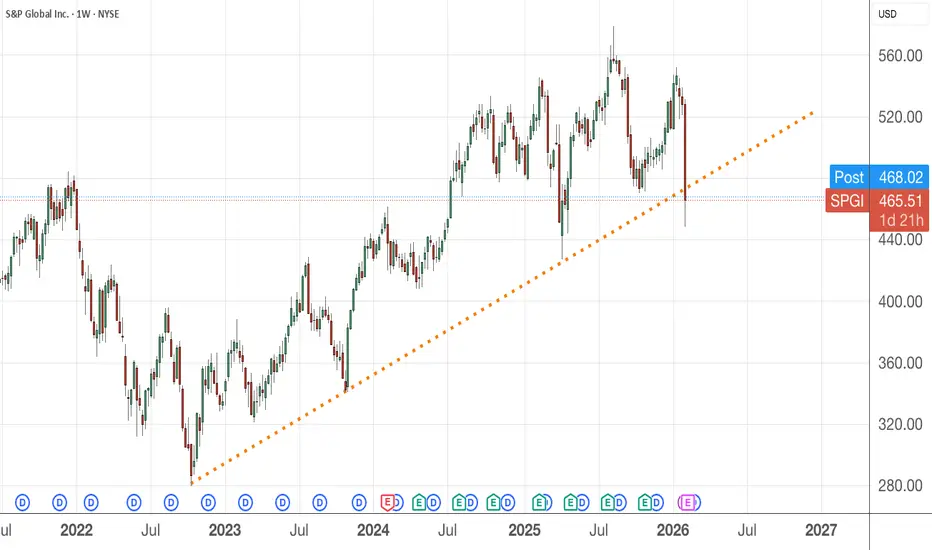
The current price of SPGI is 443.51 USD — it has decreased by −1.57% in the past 24 hours. Watch S&P Global Inc. stock price performance more closely on the chart.
Depending on the exchange, the stock ticker may vary. For instance, on NYSE exchange S&P Global Inc. stocks are traded under the ticker SPGI.
SPGI stock has risen by 1.72% compared to the previous week, the month change is a 5.94% rise, over the last year S&P Global Inc. has showed a −13.48% decrease.
We've gathered analysts' opinions on S&P Global Inc. future price: according to them, SPGI price has a max estimate of 553.00 USD and a min estimate of 485.00 USD. Watch SPGI chart and read a more detailed S&P Global Inc. stock forecast: see what analysts think of S&P Global Inc. and suggest that you do with its stocks.
SPGI reached its all-time high on Aug 14, 2025 with the price of 547.70 USD, and its all-time low was 0.32 USD and was reached on Dec 5, 1974. View more price dynamics on SPGI chart.
See other stocks reaching their highest and lowest prices.
SPGI stock is 2.89% volatile and has beta coefficient of 0.55. Track S&P Global Inc. stock price on the chart and check out the list of the most volatile stocks — is S&P Global Inc. there?
Today S&P Global Inc. has the market capitalization of ‪130.75 B‬, it has increased by 0.85% over the last week.
Yes, you can track S&P Global Inc. financials in yearly and quarterly reports right on TradingView.
S&P Global Inc. is going to release the next earnings report on Oct 22, 2026. Keep track of upcoming events with our Earnings Calendar.
SPGI earnings for the last quarter are 4.83 USD per share, whereas the estimation was 4.81 USD resulting in a 0.43% surprise. The estimated earnings for the next quarter are 4.43 USD per share. See more details about S&P Global Inc. earnings.
S&P Global Inc. revenue for the last quarter amounts to ‪3.68 B‬ USD, despite the estimated figure of ‪4.09 B‬ USD. In the next quarter, revenue is expected to reach ‪3.64 B‬ USD.
SPGI net income for the last quarter is ‪1.22 B‬ USD, while the quarter before that showed ‪1.40 B‬ USD of net income which accounts for 0.00% change. Track more S&P Global Inc. financial stats to get the full picture.
Yes, SPGI dividends are paid quarterly. The last dividend per share was 0.97 USD. As of today, Dividend Yield (TTM)% is 0.87%. Tracking S&P Global Inc. dividends might help you take more informed decisions.
S&P Global Inc. dividend yield was 0.73% in 2025, and payout ratio reached 26.20%. The year before the numbers were 0.73% and 29.47% correspondingly. See high-dividend stocks and find more opportunities for your portfolio.
As of Sep 6, 2026, the company has ‪44.5 K‬ employees. See our rating of the largest employees — is S&P Global Inc. on this list?
EBITDA measures a company's operating performance, its growth signifies an improvement in the efficiency of a company. S&P Global Inc. EBITDA is ‪8.39 B‬ USD, and current EBITDA margin is 49.62%. See more stats in S&P Global Inc. financial statements.
Like other stocks, SPGI shares are traded on stock exchanges, e.g. Nasdaq, Nyse, Euronext, and the easiest way to buy them is through an online stock broker. To do this, you need to open an account and follow a broker's procedures, then start trading. You can trade S&P Global Inc. stock right from TradingView charts — choose your broker and connect to your account.
Investing in stocks requires a comprehensive research: you should carefully study all the available data, e.g. company's financials, related news, and its technical analysis. So S&P Global Inc. technincal analysis shows the strong buy rating today, and its 1 week rating is strong buy. Since market conditions are prone to changes, it's worth looking a bit further into the future — according to the 1 month rating S&P Global Inc. stock shows the buy signal. See more of S&P Global Inc. technicals for a more comprehensive analysis.