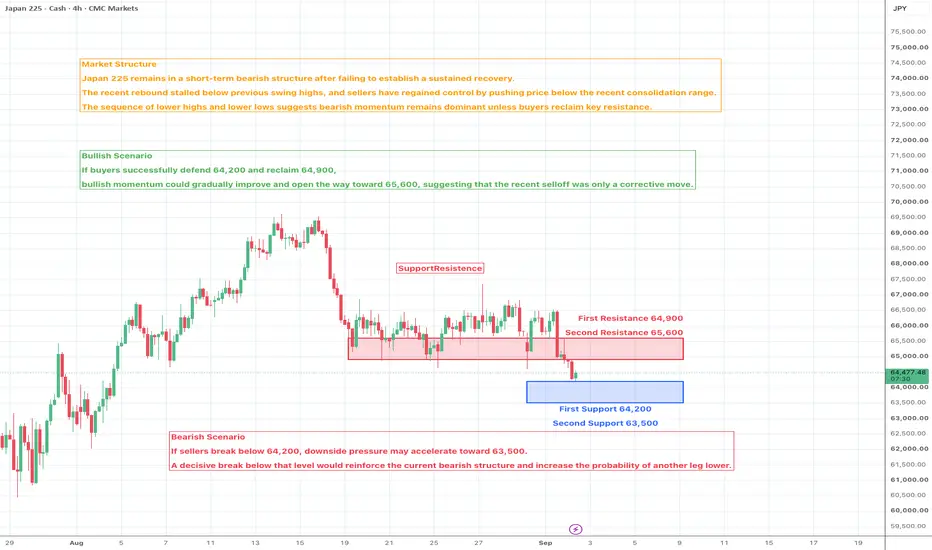
Japan 225 — Is the Correction Finally Losing Momentum?Market Structure
Japan 225 remains in a medium-term bullish structure despite the sharp decline from its recent swing high. The latest selloff interrupted the previous series of higher highs, but price has started to stabilize above a key demand zone. The recent rebound suggests sellers are losing momentum, although the index still needs to reclaim nearby resistance before confirming a stronger recovery.
Market Sentiment - Neutral to Moderately Bullish
Selling pressure has eased noticeably after the recent correction. Buyers are gradually returning, but confidence remains cautious until price breaks above the nearest resistance.
Bullish Scenario
If price continues holding above the first support and breaks through the first resistance, bullish momentum could strengthen, opening the way toward the second resistance and confirming that the correction has likely ended.
Bearish Scenario
If sellers regain control and push price below the first support, the recovery could fail, exposing the second support and increasing the probability of another leg lower.
────────────────────
Market Outlook
The recent correction has significantly cooled the previous bullish momentum, but price is beginning to establish a short-term base. This type of price action often represents the transition from distribution into accumulation. The next directional move will largely depend on whether buyers can reclaim the nearby resistance zone with stronger participation.
────────────────────
Key Levels
First Resistance 66,600
Second Resistance 67,200
First Support 65,800
Second Support 65,200
────────────────────
Future Scenarios
A sustained move above 66,600 would suggest buyers are regaining control and could extend the recovery toward 67,200 while improving the broader technical outlook.
However, if price falls below 65,800, bearish pressure may return and expose 65,200 as the next important support area.
────────────────────
Please share your view below:
Do you think Japan 225 has already completed its correction, or is another wave of selling still ahead?
More market structure and key level updates will be shared regularly.
In-depth trading ideas
JAP225📈 Japan 225 (JAP225) | Daily Timeframe — Bullish Trade Idea
Japan 225 is showing a potential bullish continuation setup after breaking above a previously established descending trendline.
🔍 Technical Analysis
The daily chart shows a strong overall bullish structure, followed by a corrective phase. Price recently broke above the descending trendline, suggesting that the previous corrective move may be losing momentum.
Key observations:
📈 Overall market structure remains bullish
🔓 Price has broken above the descending trendline
🔄 The breakout is being followed by a pullback/retest
🎯 Current price is around 65,038
Buyers could potentially target the previous resistance area and higher levels
🎯 Trade Plan
Direction: BUY 🟢
Entry: Around 65,000–65,100
Stop Loss: 60,545
Take Profit: 69,511
Risk-to-Reward: Approximately 1:1
The idea is to participate in a potential continuation after the trendline breakout rather than chasing the initial move.
For me, the key level to watch is the 65,000 area. If buyers continue to defend this region and price starts building bullish momentum, the next major objective is around 69,500.
#JAP225 #Japan225 #Nikkei225 #IndexTrading #TradingView #TechnicalAnalysis #PriceAction #MarketStructure #TrendlineBreakout #RiskManagement #Trading #ForexTrading #Indices #SwingTrading
Nikkei 225 Eyes 66k as Wall Street ReboundsThe daily chart shows a potential tweezer bottom at 63,733 - and a double bottom at the same level on the 4-hour chart. A potential falling wedge pattern is also forming, which can be a bullish continuation pattern which projects a target near its cycle highs, just below 70k. Also note support was found around the 100-day EMA and the RSI (2) reached oversold recently and is now moving higher to suggest a swing low may have formed.
While I am not fully convinced yet that a direct rally to 70k is on the cards, I do see potential for a rally over the near-term.
Wall Street rallied overnight, the the KOSPI 100 - which shares a stronger correlation with the Nikkei - is holding above support. If the KOSPI can take Wall Street's lead, the Nikkei could follow.
MS
Japanese Stocks Fall Amid Rising Bond Yields and Oil PricesIG:NIKKEI
The benchmark Nikkei 225 index tumbled 2.5%, dropping below the 64,600 mark (hitting a four-week low), while the broader Topix index fell 1.6% to 4,115. This snapped a period of gains as the market faced two major headwinds: a surge in domestic and global bond yields and escalating oil prices.
Japanese Bond Yields (10-Yr JGB) Hit 3.0% & BOJ Rate Hike Expectations
The primary catalyst driving the equity valuation adjustment originated in Tokyo's debt market:
- ⚡Bond Market Milestone: The yield on the 10-year Japanese Government Bond (10-Yr JGB) officially hit 3.0%—its highest level since 1996—after investors acknowledged the Bank of Japan's (BOJ) move toward monetary policy normalization.
- ⚡BOJ Rate Hike Expectations: Speculation regarding a BOJ rate hike this September triggered a massive de-risking move away from high-multiple equities (such as high P/E tech stocks), as the discount rate applied to future cash flow valuations surged.
---------------------------------------------------------------------------------------------------------------
✅ Crude Oil Rallies for 3 Consecutive Sessions Following US-Iran Conflict in Hormuz
- Escalating Energy Conflict: Air and naval clashes between the US and Iran in the Persian Gulf kept Brent crude prices firmly above $96 per barrel, driving the energy risk premium to its highest level of the third quarter of 2026.
- Import-Driven Inflationary Pressure: For net energy-importing nations like Japan, a surge in crude oil prices—coupled with rising bond yields—creates a "double squeeze" on the net profit margins of the manufacturing sector.
---------------------------------------------------------------------------------------------------------------
✅ Price Action Analysis (H4 Timeframe)
The H4 structure confirms the continuation of the Bearish Expansion phase. After stalling within a consolidation range (indicated by the middle gray box), the latest H4 candle decisively dropped, executing a Break of Structure (BOS) by breaching the green Pivot Level line at 64,925.9.
At the 64,647.2 price level, the H4 candle movement demonstrates total dominance by the sellers (bearish momentum).
The candle has closed below the 64,925.9 SBR horizontal line and is beginning to penetrate the lower gray box (historical Demand Zone). There are currently no signs of valid bullish rejection on the active candle.
---------------------------------------------------------------------------------------------------------------
✅ Key Zones:
- ⚡Resistance / Supply Zone (SBR): The 64,925.9 range (the green horizontal line that has now officially become the primary Support-Become-Resistance/SBR level) and the 66,852.1 range (the upper boundary of the previous consolidation resistance).
- ⚡Support / Demand Zone: The 62,054.8 range (the next green Major Demand Zone line) and the 60,833.1 range (the lowest historical Demand floor).
Japan 225 Breaks Support — Is Another Leg Lower Beginning?Market Structure
Japan 225 remains in a short-term bearish structure after failing to establish a sustained recovery. The recent rebound stalled below previous swing highs, and sellers have regained control by pushing price below the recent consolidation range. The sequence of lower highs and lower lows suggests bearish momentum remains dominant unless buyers reclaim key resistance.
Market Sentiment - Moderately Bearish
Market sentiment has weakened as repeated selling pressure continues to limit upside attempts. Buyers are beginning to defend nearby support, but stronger confirmation is still required before a meaningful recovery can develop.
────────────────────
Market Outlook
The broader trend has shifted into a corrective phase following the sharp decline from the August highs. Price is now testing an important demand area where buyers may attempt to stabilize the market. Whether this becomes a temporary bounce or the beginning of a larger recovery will depend on price behavior around nearby resistance.
────────────────────
Key Levels
First Resistance 64,900
Second Resistance 65,600
First Support 64,200
Second Support 63,500
────────────────────
Future Scenarios
Bullish Scenario
If buyers successfully defend 64,200 and reclaim 64,900, bullish momentum could gradually improve and open the way toward 65,600, suggesting that the recent selloff was only a corrective move.
Bearish Scenario
If sellers break below 64,200, downside pressure may accelerate toward 63,500. A decisive break below that level would reinforce the current bearish structure and increase the probability of another leg lower.
────────────────────
Event Risk
Japan 225 remains highly sensitive to both domestic and global macroeconomic developments.
Investors continue to monitor Bank of Japan policy expectations, the U.S. Federal Reserve interest-rate outlook, Treasury yields, USD/JPY movements, global technology stocks, and overall risk sentiment. As many major Japanese exporters benefit from currency weakness, fluctuations in the Japanese yen remain an important driver of index performance.
The next confirmed major macro event is the Federal Reserve meeting on September 15–16, 2026. Any shift in interest-rate expectations could influence global equity markets and Japanese stocks through changes in risk appetite and currency movements.
Ultimately, price reaction matters more than the headlines. If positive news cannot lift Japan 225 back above 64,900–65,600, sellers are likely to remain in control. Conversely, if negative news fails to break 64,200–63,500, the market may begin forming a stronger base for recovery.
────────────────────
Please share your view below:
Do you expect Japan 225 to recover above 64,900 and regain bullish momentum, or will sellers extend the correction toward lower support?
More market structure and key level updates will be shared regularly.
JP225 1H Long Setup — Breakout Continuation Toward 67,300Ticker: JP225 / Japan 225 CFD
Timeframe: 1H
Bias: Bullish / Long
Setup:
JP225 has shown a strong recovery from the 63,750–64,000 support zone and has broken above the short-term resistance area. After the breakout, price is holding above the Alligator lines, showing improving bullish momentum.
Entry:
Around 65,125
Take Profit:
67,300
Stop Loss:
64,031
Risk / Reward:
Approximately 1:1.99
Reason for the trade:
1. Price formed support near the 63,750–64,000 zone.
2. Strong bullish recovery after the support hold.
3. Breakout above short-term resistance.
4. Price is trading above the Alligator lines.
5. RSI is around 66, showing bullish momentum but not yet extremely overbought.
6. The setup offers nearly 1:2 risk/reward.
Invalidation:
The setup becomes weak if price falls back below the breakout area and closes below 65,125. A deeper breakdown below 64,031 would invalidate the long setup.
Important note:
This is an active breakout-continuation idea. Since price has already moved above the entry area, fresh entries should be considered only on a valid retest or a clean continuation breakout. This is not financial advice; trade should be managed according to personal risk management rules.
JPN225 H4 | Bulls Ready for Another Push HigherBased on the H4 chart analysis, we could see the price fall to our buy entry level at 65,231.56, which is an overlap support.
Our stop loss is set at 63,690.18, which is a pullback support.
Our take profit is set at 67,575.86, which is a pullback resistance.
High Risk Investment Warning
65% of retail investor accounts lose money when trading CFDs with this provider. You should consider whether you understand how CFDs work and whether you can afford to take the high risk of losing your money.
JP225 1D: 4 Rejections at EMA 50
EMA Structure: A Death Cross (EMA 20/50) occurred on Sept 2nd. Currently, the EMAs are parallel, indicating we are in the "setup" phase before a potential acceleration.
The Ceiling: Since Aug 27th, the market has attempted to break above the Daily EMA 50 four separate times, failing to close above it every single time. This persistent rejection highlights significant overhead supply.
Price Targets: If the EMAs begin to slope downward and diverge, the primary macro target is the EMA 200 (approx. 60,425.85).
The daily chart confirms that the macro structure is leaning bearish but lacks the "slope" to confirm immediate momentum. This aligns perfectly with my 4H "Neutral" stance. I am waiting for the daily EMAs to curl down as a confluence signal for my 4H short criteria.
The 1D chart is building a bearish case, but the trigger hasn't been pulled. By adhering to my strict 4H entry rules, I am positioned to capture the potential start of a macro downward acceleration while avoiding the current noise.
JP225 4H: Short Setup Only If 3 Criteria Are Met
EMA Structure: The EMA 20/50 Death Cross remains intact. However, both EMAs are currently curling upward, and the spread is narrowing. This indicates strong counter-trend momentum, making premature shorting risky.
Price Action: Closed at 65,789. Price is currently testing a critical resistance zone where the EMA 50 and the VPSR POC (approx. 65,808) converge.
Standing aside for now. No exceptions. I am waiting for the following three conditions to be met on the 4H closing basis:
Price must close clearly below the POC (65,808) and EMA 50.
The recent swing high (66,523.44) must hold. (The scenario is invalidated if the 4H candle closes above this level).
EMA 20 slope must flatten, and the narrowing of the EMA 20/50 spread must stop (confirming momentum exhaustion).
The first 4H candle of the week is for "confirmation," not for entry. We are seeing a collision between the macro bearish structure (Death Cross) and the short-term bullish rebound.
"Staying out of the market is currently the biggest edge."
#JP225 #Nikkei225
JPN225: 3% yields, a descending triangle,Here Is the Trade!The video has a detailed analysis of the Japan 225 and the trade setup that I have created as of 3 September 2026, the day when Japan's 10 year bond yield topped 3% for the first time since 1996 as US-Iran airstrikes increase oil prices, global inflation expectations rise, yen strengthens amid BOJ rate hike check speculation and the index falls 2.85% to four-week lows at 64,325. Nikkei index currently trades 12% down from its June peak of 73,007. Descending triangle has been developing quietly since August highs, with flat support at 63,500 and a series of lower highs. The MACD histogram is decreasing from deeply negative levels – the exact same exhaustion signal that the Hang Seng produced on the chart in July right before providing its strongest week since March 2025. I go through the details of the triangle, the trading setup, three possible target levels and finally the level which signals the triangle breakdown;62,000. This video should be interesting both to those who trade indices and want to learn about the relationship between bond yields and chart patterns.
Nikkei 225: The Decision Is Priced, the Guidance Is NotJP225 Ahead of the BOJ: When the Rate Hike Is Already in the Price
Fundamental Analysis
1. The Nikkei recently pulled back from 67,461 to 64,214 before a slight rebound. However, because it remains up 32% year-to-date, this is just a normal correction within a strong ongoing uptrend.
2. The BOJ's Sept 17–18 meeting is the primary market catalyst, with an 82% probability of a rate hike to 1.25% already priced in. Since the hike is expected, the index will react to the central bank's tone rather than the decision itself.
3. The yen has strengthened recently (moving from 160.20 to 156.71). This acts as a double-edged sword: it helps lower imported inflation but cuts into the profits of major Japanese exporters.
4. 10-year JGB yields hitting 30-year highs near 3% are pressuring growth valuations while boosting bank margins. This has triggered a clear sector rotation out of tech and into financials and domestic stocks.
5. Oil prices nearing $95 due to geopolitical risks directly increase costs for energy-dependent Japan. This hurts corporate margins and pressures the BOJ to tighten policy faster, creating a dangerous combination for the index.
Technical Analysis
6. JP225 is trading sideways within a symmetrical triangle, holding its level after posting a new high above 72,000. The price has pulled back and is now hovering close to the EMA20, indicating a consolidation phase.
7. However, looking at the broader picture prior to this sideways move, the price had been building higher swings consistently, while the EMA stack diverged and continues to signal an uptrend.
8. In summary, JP225 is moving sideways to build momentum for a further advance, as the bullish momentum may have temporarily weakened.
9. If the price breaks out of the range in either direction, it would serve as a trend-following signal in that direction, with an upside bias.
Analysis by: Krisada Yoonaisil, Financial Markets Strategist at Exness
JPN225:Descending triangle developing here is the tradeThe Jappan 225 lost 2.85%, closing at 64,325 on Wednesday, to reach its lowest level in four weeks due to changes in the macroeconomic environment. The yield on Japan’s 10-year government bonds touched above 3% for the first time since 1996 due to increasing oil prices and expectations of additional tight monetary policy moves from the Bank of Japan. Stronger Japanese yen has put pressure on Japanese companies like Toyota, Sony, and Softbank. The index is still 53.76% higher year-to-date.
The daily chart depicts a broken trend structure. In the current case, TEMA 9 (64,618) serves as resistance, and the 50 EMA (66,718) and 200 EMA (58,910) form a wide and indecisive channel. The formation of a descending triangle since the high at about 69,000 in August reveals declining highs against a flat support at 63,500. The RSI (40.92) lags behind its signal (48.91), suggesting weak momentum. On the other hand, the MACD (−208.47 against −288.79 signal) shows a narrowing negative histogram (−80.32). This could point to the possible
Trade recommendation
Direction : Long
Entry horizon : 63,000 – 64,274
Primary target : 66,718
Secondary target : 68,000
Stop loss : Daily close below 62,000
Technical scenarios
BOJ hiatus and oil retreat, descending triangle breaches higher : Trump's comment that the US strikes in Iran would be short-lived temporarily reduced oil prices and JGB yields. Should de-escalation continue, the BOJ halts tightening, leading to a weak yen of around 150 and positive export performance. The MACD narrows, RSI returns above 50, and the descending triangle breaches higher towards 66,718 (50 EMA).
Sideways Compression, The BOJ Waiting Game: The Descending Triangle squeezes between support at 63,500 and lower peaks as the Bank of Japan’s meeting approaches in October. The market struggles sideways in indecision with an RSI ranging from 38 to 48 and MACD close to zero.
Triangle breakdown ,3% yield shock accelerates : Japan's 10-year yield exceeds 3.2% as oil stays above $95, forcing BOJ rate hike signals. The 63,500 support breaks, RSI drops below 35, and MACD widens negatively, targeting the 200 EMA at 58,910.
Japanese Stocks Under Pressure from Yen StrengtheningNikkei Update: Japanese Stocks Under Pressure from Yen Strengthening IG:NIKKEI
The benchmark Nikkei 225 index edged down 0.2% to hover around the 64,200 level, while the broader Topix index surged 0.7% to land at 4,110, reflecting a massive equity rotation amidst currency intervention dynamics and geopolitical factors.
------------------------------------------------------------------------------------------------------------
✅ Speculation of BOJ Currency Rate Check Drives Sharp Yen Appreciation
The primary catalyst weighing on exporters stems from Tokyo's monetary policy landscape:
- Signals of Direct FX Intervention: Rumors of a "rate check" by Japanese monetary authorities—aimed at stemming the Yen's slide—mechanically triggered massive Yen short-covering.
- Margin Pressure on Exporters: The sudden strengthening of the Yen eroded projected foreign-currency-derived profits (repatriated earnings) for major exporters, prompting daily de-risking in the Nikkei 225 index.
------------------------------------------------------------------------------------------------------------
✅ Price Action Analysis (H4 Timeframe)
⚡Market Structure & Break of Structure (BOS):
On the H4 macro timeframe, the market structure remains in a Bearish Trend phase. A prior sharp decline broke the upper consolidation range and executed a Break of Structure (BOS) below the green line at 64,925.9.
⚡Current Price Action:
At the 64,562.4 level, the price accelerated downward, piercing the consolidation floor and touching a local low of 63,705.0. However, the most recent H4 candle immediately responded to this breach by forming a long lower wick (indicating bullish rejection). The price is currently attempting to creep back up to test the Support-Turned-Resistance (SBR) area at the green line of 64,925.9.
------------------------------------------------------------------------------------------------------------
✅ Key Zones:
- ⚡Resistance / Supply Zone (SBR): The 64,925.9 green line range (nearest key Support-Turned-Resistance/SBR area) and the 66,852.1 green line range (upper gray box / Major Supply Zone).
- ⚡Support / Demand Zone: The 63,705.0 – 64,000.0 range (middle gray box where a liquidity sweep occurred) and the 62,054.8 green line range (lowest Major Demand floor).
------------------------------------------------------------------------------------------------------------
✅ Elliott Wave Analysis
Mapping wave cycle movements on the H4 timeframe:
⚡Wave Structure:
The impulsive decline from the ~69,600 peak toward the consolidation floor is counted as Wave 1 (or Wave A). The sideways consolidation that recently concluded is identified as Wave 2 (or Wave B).
⚡Projection:
Price action is projected to complete this micro-corrective rebound toward the 64,925.9 SBR range before reversing downward to resume the major Wave 3 expansion, targeting the 62,054.8 Major Demand green line.
Nikkei 225 LONG — 12H ALMA Setup (WR 86% · avg RR 1.5)SPREADEX:NIKKEI · 12H · long only.
(Context: Nikkei 225 — Japan equity beta via yen, BOJ path, and Asia risk appetite — not a discretionary “buy Japan” call.)
═
█ RESEARCH HUB
Category: Indices sentiment 32.4 (Fear) — built from 74 locked notes (11 constructive / 48 risk-off / 15 mixed); ticker verdicts +28 / −27. Category fear is broad (USD / mega-cap stress); Nikkei’s own verdict window stays constructive inside that gauge.
Sector: same bucket as category (indices) — no separate GICS sleeve.
Asset: positive. Living thesis: Japan holds ~$7T abroad and faces repatriation pressure so aging ALM can match liabilities at home — yen/Nikkei two-way, not a one-way equity bid.
Tape:
- 2026-08-20 · positive · Japan exports +23% on China shipments / AI demand — supports Japan equity beta and Asia supply-chain demand.
- Recent · mixed · Japan CPI beat hardens mid-Sep BOJ hike odds — yen/JP equities two-way into the meeting window.
- Recent · negative · Japan spent ~$96.5B defending the yen; USDJPY back toward 160 after a brief dip — intervention failed to stick; watch Nikkei into BOJ.
- 2026-07-29 · negative / mixed · ~$7T abroad + repatriation / ALM framing — yen weakness as ALM repatriation, not only carry unwind; Nikkei gains can look hollow vs gold.
- 2026-07-29 · negative · China Q2 4.3% GDP miss / domestic deflation — Asia demand headwind for Japan exporters.
Calendar:
- 2026-09-17 · BOJ September meeting / hike decision window · direct · cb
- 2026-09-02 · ADP Nonfarm + Fed Beige Book · indirect (global risk) · macro / cb
- 2026-09-04 · US August jobs / NFP · indirect · macro
- 2026-09-16 · FOMC · indirect (USD/JPY cross-beta) · cb
Hub verdict: Indices fear vs a positive Nikkei window with BOJ 17 Sep as the hard date — Hub is two-way : export/AI support vs yen intervention + hike odds. Averaging fades the 12H wash; it does not forecast the BOJ print.
═
█ MARKET EDGE
Long Edge 41.3 · Short Edge −31.3 ( 02 Sep ~ 64112 ).
Built from: TOTAL_BEAR phase · ALMA overheat below · deviation · price action — discount board into the arm.
Positive factors
- ALMA — 4H SHORT OVERHEAT-S · S:7 vs SAvg:3.3 — validation clock stretched below the band
- ALMA — 1D SHORT OVERHEAT-S · S:4 vs SAvg:2.9 — daily band stretched below
- ALMA — 3D SHORT OVERHEAT-S · S:5 vs SAvg:3.0 — slow clock stretched below
- SMC — 4H FVG Enter Bull ~ 64438 ( 02 Sep ) · bounce up B 53.0% · break down Br47.0% (n=762) — mild demand near the latest add
- SMC — 1D FVG Enter Bull ~ 64836 ( 31 Aug ) · bounce up B 58.1% · break down Br41.9% (n=248) — daily demand under the wash
- SMC — 1W FVG Enter Bull ~ 65796 ( 23 Aug ) · bounce up B 73.1% · break down Br26.9% (n=26) — weekly hold skew above the pocket
- PA — Fractal Low Formed / Broken — local low housekeeping into the arm
- Score skew long ~41.3 vs short ~−31.3 — board tilts repair
Negative factors
- EMA — 1W Above · Cur L:67 · Dev −10.2% — weekly still deeply stretched above; slow giveback risk if USDJPY / BOJ bites
- ALMA — 1W SHORT · S:2 vs SAvg:3.0 — weekly below-band not fully stretched
- TL — Head & Shoulders (Classic) ( 31 Aug ) · bounce B 60% · break Br40% (n=15) — thin-sample pattern ceiling into the mid-65ks
- SMC — 1D FVG Raid Bear ~ 66116 ( 26 Aug ) · reject down B46.2% · break up Br53.8% (n=208) — prior daily supply still overhead
- Pyramid already 3 of 4 — limited add room; thin cushion if BOJ week gaps before lot 4 / exit
- Yen intervention failure + hike odds can reprice Nikkei faster than the ~93-bar sample hold
═
█ DESK
Hub is two-way (positive Nikkei thesis · Indices fear · BOJ 17 Sep direct). Edge is a discount long (Long 41.3 vs Short −31.3) from 4H–3D ALMA OVERHEAT-S. Alignment: fade the 12H wash on Averaging into the BOJ window — not a hike forecast. Twin 12H template stays desk-only.
Three 12H lots from 01–02 Sep (~64970 / 64820 / 63882) into the mid-64ks after the late-Aug slide from the mid-65ks.
Takeaway: the 12H ALMA strategy and 86% WR / 1.5 avg RR support a disciplined three-lot arm ~64560 after the Japan equity wash, with 4H–3D ALMA below-band overheat, 1D/1W bull FVG bounce-up skew (~58–73%), and Edge long tilt framing repair fuel — but Hub stays two-way into BOJ 17 Sep, weekly EMA is still −10% stretched above, Head & Shoulders caps a clean breakout, and a 3/4 pyramid leaves thin add room if yen/BOJ headlines gap; nominal risk stays on the −10% hard stop / Pine exit path.
Base case: follow 12H ALMA Averaging · hold/add only if lot 4 qualifies on a lower close · digest the ~63880–64970 ladder toward the ~64800–65800 FVG shelves if yen beta stabilizes without a gap through the stop.
Bear case: lose the ~63880 add · BOJ/yen headlines gap Nikkei lower · template posts −10% toward ~58102 from the working average · wait for the next bar-close arm.
═
█ STRATEGY
ALMA Averaging Strategy: ALMA 3 / σ2, SD band 2, min diff 1/4, 25% per bar, up to 4 adds, hard stop −10% from the working average.
Lots (3 of 4):
- Lot 1 — 01 Sep 10:00 UTC ~ 64970
- Lot 2 — 01 Sep 22:00 UTC ~ 64820
- Lot 3 — 02 Sep 10:00 UTC ~ 63882
Working average ~ 64557 . Hard stop −10% from that average ~ 58101 .
Lot 4 stays 25% per bar if a lower 12H close qualifies.
Strategy Tester (NIKKEI 12H):
Win rate 86% · profit factor 4.8 · max drawdown 27%
Avg winning trade +10.3% · avg losing trade −7.0%
Typical hold ~93×12H bars on winners — Japan equity mean-reversion grid on the 12H Averaging template · 110-trade sample
Exits follow Pine ALMA flip + min diff or the −10% hard stop from the working average.
Chart: SPREADEX:NIKKEI 12H — ALMA Averaging Strategy.
Educational idea. Live position — past backtest ≠ future results. NFA.
JP225 4H: Tactical Relief Rally or Bearish Trend Continuation?Strategic Outlook — Navigating the Corrective Triangle
■ Market Sentiment
In contrast to the resilience of the US500, the JP225’s 4H EMA structure remains decidedly bearish. The index has failed to form a Golden Cross, and the EMA slope has turned downward following the Jackson Hole symposium, confirming heavy overhead resistance. Currently, the market is navigating a high-volatility corrective phase within a broader downtrend.
■ Technical Landscape (Key Levels)
Critical Support (Bold Green Zone): 65,619.38 / 65,423.98 / 65,371.76. This cluster represents the final "Line in the Sand" for the current bullish corrective structure.
Major Resistance (Bold Red Zone): 67,342.01 / 67,566.36. This is a significant supply zone where recent swing highs converge, acting as the primary barrier to recovery.
Structural Targets (Thin Green Lines): 62,302.37 / 60,425.85. These are the primary medium-term downside objectives if the support cluster fails to hold.
■ Trading Strategy
Bullish Thesis (Tactical Long):
I anticipate a corrective leg higher (Wave C) targeting a move above 67,342.01, provided the Aug 28 low at 65,371.76 remains intact.
Advice: Due to the ongoing triangle formation, expect significant noise and choppy price action. Entering near support requires patience; a "position and hold" approach is recommended to avoid getting stopped out by intraday volatility.
Bearish Thesis (Trend Continuation):
Unless the Aug 14 high is decisively reclaimed, the structural bias remains "Sell-on-Rally." A rejection from the overhead resistance zone will likely trigger a shift back to the macro downtrend, targeting the 62,302 / 60,425 levels.
■ Conclusion
Short-term Bias: Bullish (Seeking a corrective bounce above 65,371).
Medium-term Bias: Bearish (Trend remains down unless the Aug 14 high is breached).
Watch the EMA slope and price action at the 67,500 handle closely. Manage risk accordingly.
#JP225 #Nikkei225
Nikkei: Japanese Stocks Rise Following Nvidia's Earnings ReportNikkei: IG:NIKKEI Japanese Stocks Rise Following Nvidia's Earnings Report
The benchmark Nikkei 225 index surged 0.3% to break past the 66,400 level, while the broader Topix index climbed 0.25% to reach 4,121. This rally was driven by a surge in market optimism following the release of record-breaking "blowout" earnings and sales guidance from global AI giant Nvidia.
"Smart money" in Asia-Pacific absorbed the US inflation data (July PCE)—which remained elevated above the Fed's target—by focusing on the far more powerful fundamental momentum within the physical computing supply chain.
Nvidia's success in posting blowout Q2 earnings—with revenue soaring over 100% year-on-year and Q3 sales guidance exceeding even the highest estimates—demonstrated that the market is fully absorbing the 15%+ price hikes for AI servers.
This triggered a massive buying spree for Japanese manufacturers of fiber-optic cables, memory chips, and passive components—the backbone of global data center construction: Kioxia Holdings surged 5.0%, Fujikura rose 2.6%, Murata Manufacturing gained 2.6%, Ibiden Co. climbed 2.3%, and Tokyo Electron rose 1.0%.
------------------------------------------------------------------
✅ Price Action Analysis (H4 Timeframe)
⚡Market Structure & Channel Breakout:
The H4 structure shows that the previous ascending channel was broken decisively to the downside from the peak of 69,611.4. Following that vertical drop, the price entered a consolidation or range-bound phase within the central gray box.
⚡Current Price Action:
At the 66,193.1 price level, the latest H4 candle shows sharp rejection after briefly triggering a false breakout (fakeout/upthrust) above the green line at 66,852.1. The appearance of a large-bodied bearish candle re-entering the consolidation range confirms a "stop hunt" (sweeping of buy-stop liquidity) by institutional market participants before driving the price back down.
⚡Key Zones:
- Resistance / Supply Zone: The 66,852.1 range (green line: nearest Upthrust Level / SBR) and the 67,600.0 – 69,611.4 range (upper Major Supply Zone area).
- Support / Demand Zone: The 64,925.9 range (green line: nearest Pivot Level / consolidation floor) and the 62,003.9 range (green line: lower Major Demand Area).
------------------------------------------------------------------
✅ Elliott Wave Analysis
Mapping wave cycle movements on the H4 timeframe:
⚡Wave Structure:
The sharp decline from the 69,611.4 peak toward the consolidation area is calculated as the initial impulsive move of a large-scale corrective Wave A or Wave 1.
⚡Current Status:
Sideways consolidation with a "fakeout" to 66,852.1 is identified as the completion of Wave B (a micro expanded flat correction) that has just swept liquidity at the upper boundary.
⚡Projection:
Rejection from this Upthrust area triggers the start of a downward expansion in Wave C / micro Wave 3. The primary downside targets for this wave are testing the Pivot Level floor (64,925.9) and subsequently sliding toward the lowest Demand Area (62,003.9).
Japanese Shares Fall as Tech Stocks WeighOn a macro level, looking at the H4 timeframe, the market structure is currently in a Bearish Transition phase (Pullback Phase). IG:NIKKEI
Following an impulsive rally from the lows that broke through to a local peak around 69,611.4, a sharp rejection occurred (double top rejection). The subsequent impulsive decline broke the minor Higher Low structure, placing the price in a medium-scale correction phase.
At the 65,554.3 price level, H4 candle movements indicate a sideways consolidation phase, trading below the nearest local green Resistance line at approximately 66,852.1. Consecutive lower and upper wicks on recent candles signal a tight battle between buyers and sellers, though short-term control remains slightly dominated by selling pressure.
----------------------------------------------------------------------------------------------------------
✅ Key Zones:
- Resistance / Supply Zone: The 66,852.1 range (nearest green Resistance / SBR line) and the 67,600.0 – 69,611.4 range (upper boundary of the Major Supply Zone).
- Support / Demand Zone: The 64,800.0 – 65,000.0 range (nearest local consolidation support area) and the 64,202.5 level (lower major green Demand line).
----------------------------------------------------------------------------------------------------------
✅ Orderflow / Volume Profile (VPVR) Analysis
The Volume Profile histogram on the right side of the chart provides a highly precise map of institutional liquidity:
- 🔸Local High Volume Node (HVN) / Point of Control (POC):
A significant volume accumulation is visible right around the current price range of 65,750.0 – 66,250.0 (indicated by the longest histogram protrusion). Since the current price (65,554.3) has slipped below this volume bulge, this HVN area is acting as Orderflow Resistance, capping upward movement.
- 🔸Low Volume Node (LVN) / Downward Acceleration Zone:
Below the 65,250.0 range, heading toward the green line at 64,202.5, the volume histogram appears thin (a "volume vacuum"). If sellers successfully break below the consolidation floor (below 65,000.0), the price is projected to slide rapidly across this LVN area toward the next significant volume cluster around 64,202.5.
----------------------------------------------------------------------------------------------------------
✅ Elliott Wave Analysis
Mapping wave cycle movements on the H4 timeframe:
- 🔸Wave Structure: The sharp decline from the 69,611.4 peak toward the 65,000 level is calculated as the initial impulsive move of a large-scale corrective Wave A or Wave 1.
- 🔸Current Status: The sideways consolidation at the 65,554.3 level is identified as the formation of Wave B (a micro flat or triangle correction) currently completing its supply-balancing phase.
- 🔸Projection: Price action is projected to retain some remaining corrective downward momentum (Wave C / micro Wave 3) to test the green Support/Demand line at 64,202.5 before this H4 correction cycle reaches its exhaustion point (selling exhaustion).
Japanese Stocks Fall Amid High Yields and Middle East TensionsJapanese Stocks IG:NIKKEI Fall Amid High Yields and Middle East Tensions
The benchmark Nikkei 225 index edged down 0.2%, slipping below the 65,900 level and extending the previous session's correction as investors remained cautious regarding high global bond yields and impending new US sanctions on Iran.
"Smart money" in the Asia-Pacific region has defensively positioned itself ahead of Washington's announcement of new economic sanctions against Tehran, even as Iranian leaders remain defiant.
This situation is compounded by persistently high global bond yields—following the failure of initial US Treasury intervention efforts—and anxiety over a surge in Nvidia AI server prices (up over 15%) driven by HBM memory component inflation. These factors have triggered profit-taking and cash-preservation moves ahead of Nvidia's earnings report this week.
-----------------------------------------------------------------------------------------------------------
✅ New US Sanctions on Iran & Brent Oil Holding Above $94
The primary catalyst for this de-risking activity stems from geopolitical tensions in the Persian Gulf:
- Escalation of Washington's Sanctions: Markets are anticipating the announcement of new US economic sanctions on Iran today; Tehran has responded by asserting that such measures will not cripple its economy.
- Sustained Energy Risk Premium: These tensions have kept Brent crude oil prices firmly in the $94–$95 per barrel range, reigniting concerns about secondary inflationary risks across global manufacturing supply chains.
-----------------------------------------------------------------------------------------------------------
✅ Price Action Analysis (H4 Timeframe)
- Market Structure: On a macro level within the H4 timeframe, the primary trend structure of the Japan 225 has undergone a shift (Shift in Market Structure / ChoCh). This follows a massive rally from the lows (~61,000) to a peak of 69,612.2 that failed to sustain momentum, resulting in the formation of a sharp double-top pattern around the 69,600 level. The subsequent vertical drop broke the minor Higher Low.
- Current Price Action: At a price of 65,726.2, H4 candle movements indicate a sideways consolidation phase following a sharp bearish sell-off. Upper and lower wicks on the recent candles signal market indecision; however, the price is holding just above the nearest local green Support line in the 64,668.3 range.
⚡ Key Zones:
- Resistance / Supply Zone: The 67,600.0 – 68,000.0 range (Support-turned-Resistance/SBR area and nearest Supply Zone) and the 69,600.0 – 69,612.2 range (topmost green box / Major Supply).
- Support / Demand Zone: The 64,668.3 range (nearest green Support line) and the 62,056.0 range (lower green Major Demand line).
-----------------------------------------------------------------------------------------------------------
✅ Orderflow / Volume Profile (VPVR) Analysis
The Volume Profile histogram on the right side of the chart provides a highly precise map of institutional liquidity:
- High Volume Node (HVN) / Local Point of Control (POC): There is a significant volume concentration right at the current price area—specifically between 65,600.0 and 66,200.0 (indicated by the longest histogram protrusion). This suggests that the 65,700 level acts as the current equilibrium zone (Fair Value Area) where large-scale transactions are consolidating.
- Low Volume Node (LVN) / Acceleration Zone: Below the 65,200.0 level, extending down to the 64,668.3 green line, volume distribution appears thin (a volume vacuum). If sellers manage to break below the current HVN floor (below 65,400), the price is projected to slide rapidly across the LVN toward the green line at 64,668.3.
-----------------------------------------------------------------------------------------------------------
✅ Elliott Wave Analysis
Mapping the wave cycle movements on the H4 timeframe:
- Wave Structure: The sharp decline from the double-top peak at 69,612.2 is calculated as the initial impulsive move of a large-scale corrective Wave A or Wave 1.
- Projection: The price trajectory is projected to include one more downward push (Wave C / micro Wave 3) to test the green support line at 64,668.3 before this H4 correction cycle reaches exhaustion (selling exhaustion).
JP225 : Potential H&S Formation – Sit Out Until Key Events PassJP225 4H Analysis: Potential Large Head & Shoulders and Pre-Event Patience
■ Current Situation
Following the 4-hour EMA dead cross on August 19, upside remains heavy. Structurally, the three highs since June (68,774 / 73,622 / 69,605) raise the possibility of a large Head & Shoulders top forming. A scenario of continued decline toward the thick yellow neckline, interrupted by intermittent rebounds, should be kept in view.
■ Strategy
A short-term rebound from oversold conditions is possible, but the yellow circle zone (EMA20/50/200 confluence) stands as a strong resistance cluster. Downside levels to watch are the nearest support at 65,423.98 and the final defense line at 64,852.34.
Next week brings a cluster of high-impact events — NVIDIA earnings, PCE Deflator, and Jackson Hole (including the Warsh speech) — that have the potential to fundamentally shift the market narrative. Relying solely on technicals in this environment carries elevated risk.
■ Conclusion
The broader bias remains sell-the-rally after any rebound. However, the base stance until these key events pass is to sit out. Avoiding low risk-reward entries that expose positions to sharp two-way volatility is the top priority. Whether 64,852.34 holds or the structure breaks (neckline failure) will be assessed calmly through the post-event shift in trend and structure.
#JP225 #Nikkei225
Wyckoff Accumulation Process?
The Nikkei is known for moving in harmony with the U.S. indices. It will be very interesting to see whether the accumulation process taking place here holds and whether buyers will take control of this area.
If sellers are still strong and remain present, then this entire process is invalidated, and we are simply looking at a battle zone where liquidity is building up at both ends until one side eventually takes control.
Considering how the rest of the indices are looking, I wouldn’t be surprised to see the Nikkei move higher eventually. We are currently sitting in an interesting demand zone, the overall trend is still bullish, and the market looks very healthy for further upside.
JP225 4H: Bearish Shift Below 200EMAJP225 4H: Bearish Shift Below 200EMA
■ Current Status
A 4H EMA dead cross occurred on Aug 19, and the EMA cluster is now sloping downward. Crucially, the price has broken below the 200EMA (thick red line), our long-term line of defense. This shifts the technical landscape into a "sell the rally" environment.
■ Strategy
While we are currently seeing a relief bounce from oversold conditions, I expect the yellow circle area (confluence of EMA 20/50 and the 200EMA) to act as heavy resistance. Selling near the Aug 19 swing high (~66,864) remains the primary setup. Monitor the 65,423.98 support closely; a clean break here would signal a structural breakdown and further downside.
■ Conclusion
"Sell the rally" is the main scenario. If rejection is confirmed near the yellow circle, I am targeting the 65,400–64,800 zone. JP225 shows significant relative weakness compared to US500, suggesting limited upside on any bounces.
#JP225 #Nikkei225