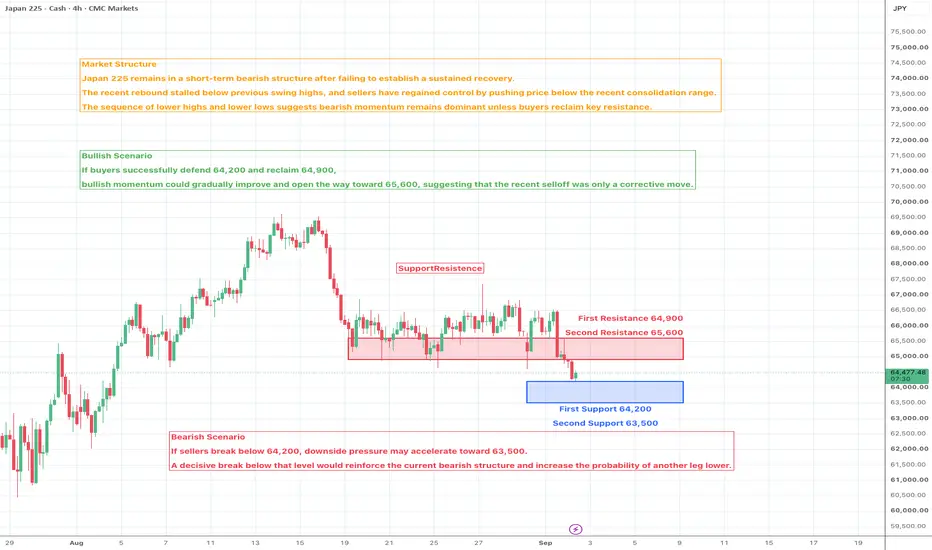
Japan 225 — Is the Correction Finally Losing Momentum?Market Structure
Japan 225 remains in a medium-term bullish structure despite the sharp decline from its recent swing high. The latest selloff interrupted the previous series of higher highs, but price has started to stabilize above a key demand zone. The recent rebound suggests sellers are losing
Index info
JPN225 is a popular financial derivative based on the leading and most-respected Japanese stocks. This price-weighted index, valued in yen, has been calculated daily by the Nihon Keizai Shimbun (Nikkei) newspaper since the Index's inception in 1950. It comprises Japan's top 225 blue-chip companies traded on the Tokyo Stock Exchange.
JAP225📈 Japan 225 (JAP225) | Daily Timeframe — Bullish Trade Idea
Japan 225 is showing a potential bullish continuation setup after breaking above a previously established descending trendline.
🔍 Technical Analysis
The daily chart shows a strong overall bullish structure, followed by a corrective phase
Nikkei 225 Eyes 66k as Wall Street ReboundsThe daily chart shows a potential tweezer bottom at 63,733 - and a double bottom at the same level on the 4-hour chart. A potential falling wedge pattern is also forming, which can be a bullish continuation pattern which projects a target near its cycle highs, just below 70k. Also note support was f
Japan 225 Breaks Support — Is Another Leg Lower Beginning?Market Structure
Japan 225 remains in a short-term bearish structure after failing to establish a sustained recovery. The recent rebound stalled below previous swing highs, and sellers have regained control by pushing price below the recent consolidation range. The sequence of lower highs and lowe
Japanese Stocks Fall Amid Rising Bond Yields and Oil PricesIG:NIKKEI
The benchmark Nikkei 225 index tumbled 2.5%, dropping below the 64,600 mark (hitting a four-week low), while the broader Topix index fell 1.6% to 4,115. This snapped a period of gains as the market faced two major headwinds: a surge in domestic and global bond yields and escalating oil
JP225 1H Long Setup — Breakout Continuation Toward 67,300Ticker: JP225 / Japan 225 CFD
Timeframe: 1H
Bias: Bullish / Long
Setup:
JP225 has shown a strong recovery from the 63,750–64,000 support zone and has broken above the short-term resistance area. After the breakout, price is holding above the Alligator lines, showing improving bullish momentum.
Ent
JPN225 H4 | Bulls Ready for Another Push HigherBased on the H4 chart analysis, we could see the price fall to our buy entry level at 65,231.56, which is an overlap support.
Our stop loss is set at 63,690.18, which is a pullback support.
Our take profit is set at 67,575.86, which is a pullback resistance.
High Risk Investment Warning
65% of r
JP225 1D: 4 Rejections at EMA 50
EMA Structure: A Death Cross (EMA 20/50) occurred on Sept 2nd. Currently, the EMAs are parallel, indicating we are in the "setup" phase before a potential acceleration.
The Ceiling: Since Aug 27th, the market has attempted to break above the Daily EMA 50 four separate times, failing to close above
JP225 4H: Short Setup Only If 3 Criteria Are Met
EMA Structure: The EMA 20/50 Death Cross remains intact. However, both EMAs are currently curling upward, and the spread is narrowing. This indicates strong counter-trend momentum, making premature shorting risky.
Price Action: Closed at 65,789. Price is currently testing a critical resistance zone
See all ideas
Displays a symbol's value movements over previous years to identify recurring trends.
Frequently asked questions
Japan 225 Index reached its highest quote on Jun 22, 2026 — 73,717.49 JPY. See more data on the Japan 225 Index chart.
The lowest ever quote of Japan 225 Index is 1,929.64 JPY. It was reached on May 28, 1970. See more data on the Japan 225 Index chart.
Japan 225 Index is just a number that lets you track performance of the instruments comprising the index, so you can't invest in it directly. But you can buy Japan 225 Index futures or funds or invest in its components.