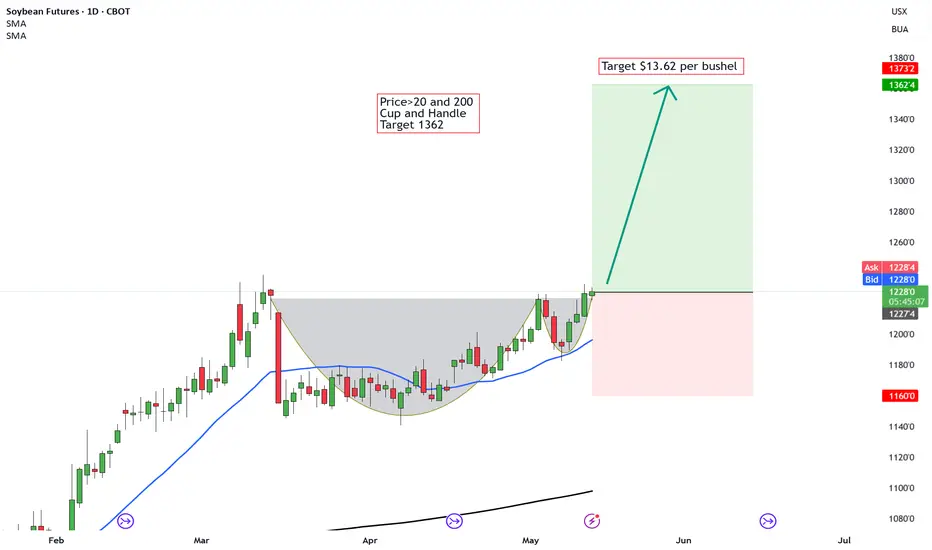
Soybeans — Producer hedging caps this. What if it doesn't?Producer hedges in soybeans are sitting above 600K contracts right now. That level usually tracks price down.
But if it doesn't this time — price just keeps grinding to fresh highs anyway.
Back in 2020 something similar happened. Hedging was heavy, and price broke higher regardless. What was actua
Soybean Futures
No trades
No trades
Compare with Soybean
Will Super El Niño Reshape Soybean Futures?Global weather concerns and insatiable Chinese demand rapidly spike corn, wheat, and soybean prices. Meteorologists from DW News confirm that a historically strong El Niño pattern will disrupt global agriculture. The United Nations warns that climate change exacerbates these erratic weather events.
SOYBEANS Short SignalSoybeans MTF Conf2.0 Short Idea. I don't trade soybeans, so I will not be trading this, but I thought I would share the TDA
Technicals:
Price inside Monthly supply + Daly confirmation 2.0.
Fundamentals/Sentiment:
COT short correlation by banks/insitutions adding into shorts and closing longs.
No i
SOYBEAN FUTURES DXY & REAL YIELD IMPLICATIONS
DXY 100.90, real yield 2.255% — both still restrictive for the broader commodity complex (BCOM 125.72). Hawkish Warsh Fed is a structural headwind, but soybean's demand-side story (crush/biodiesel) is currently strong enough to decouple from the DXY-driven bearish macro
SOYBEAN Futures ...Up dateCommercials became materially more bullish.
Funds became materially more bearish.
Price stopped falling.
That divergence is often seen near important turning points.
The 1102–1117 zone now looks increasingly like a potential Wyckoff Spring/Test area, while 1170 remains the key BOS level. A daily a
SOYBEAN FUTURES ....SOYBEAN FUTURES –
Price: 1117.0
Weekly 55 EMA: 1116.0
Weekly 200 EMA: 1152.0
DXY: 99.87
US 10Y Real Yield: 2.198%
Bloomberg Commodity Index: 130.48
The macro environment has become significantly less supportive for grains than a month ago:
Headwinds
DXY approaching 100.00
Real Yield back near 2.20%
#soybeans #zs1! #commoditytrading #cme #wasde I. COT Structure & Fund Flows: Paper Speculation vs. Commercial Accumulation
To understand why CBOT Soybeans (ZS) futures have trended lower despite structural physical tightness, one must analyze the divergence between paper positioning and physical commercial behavior (Data as of June 2, 2026):
•
Soybean Oil in 2026: When Energy Policy Meets a Supply ShockSoybean oil is up 62.6% year-to-date in 2026. Soybean oil is an agricultural commodity derived from soybeans. It is widely used in cooking, food processing, and as an industrial input. But the Soybean Oil story is now dominated by biodiesel as increasing quantities of the edible oil are redirected
SOYBEANS - The unspoken market that is set to soarSoybeans are beginning to show renewed bullish momentum as weather risks, global food demand and biofuel trends continue supporting agricultural commodities.
Technically, the market is breaking higher from a strong continuation structure while remaining above key moving averages.
Agricultural ma
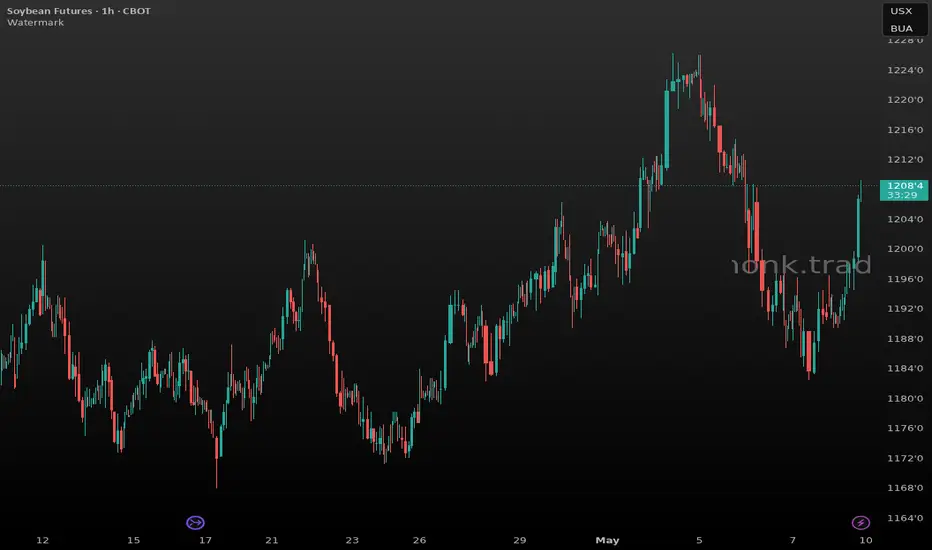
ZS Long — $ZSN26 pullback into 1200-1202 support after flushing Setup: The 4h chart shows ZS bottomed near 1165 in mid-March and carved a higher-low structure through April, culminating in a sharp impulse leg from 1175 to 1226 into May 4. After that peak the contract sold off hard over May 5-6 with elevated volume — a distribution flush that ran from 1226 down t
See all ideas
Summarizing what the indicators are suggesting.
Neutral
SellBuy
Strong sellStrong buy
Strong sellSellNeutralBuyStrong buy
Neutral
SellBuy
Strong sellStrong buy
Strong sellSellNeutralBuyStrong buy
Neutral
SellBuy
Strong sellStrong buy
Strong sellSellNeutralBuyStrong buy
A representation of what an asset is worth today and what the market thinks it will be worth in the future.
Displays a symbol's price movements over previous years to identify recurring trends.
Frequently asked questions
The current price of Soybean Futures is 64,000 JPY — it hasn't changed in the past 24 hours. Watch Soybean Futures price in more detail on the chart.
Track more important stats on the Soybean Futures chart.
Open interest is the number of contracts held by traders in active positions — they're not closed or expired. For Soybean Futures this number is 0.00. You can use it to track a prevailing market trend and adjust your own strategy: declining open interest for Soybean Futures shows that traders are closing their positions, which means a weakening trend.
Buying or selling futures contracts depends on many factors: season, underlying commodity, your own trading strategy. So mostly it's up to you, but if you look for some certain calculations to take into account, you can study technical analysis for Soybean Futures. Today its technical rating is neutral, but remember that market conditions change all the time, so it's always crucial to do your own research. See more of Soybean Futures technicals for a more comprehensive analysis.