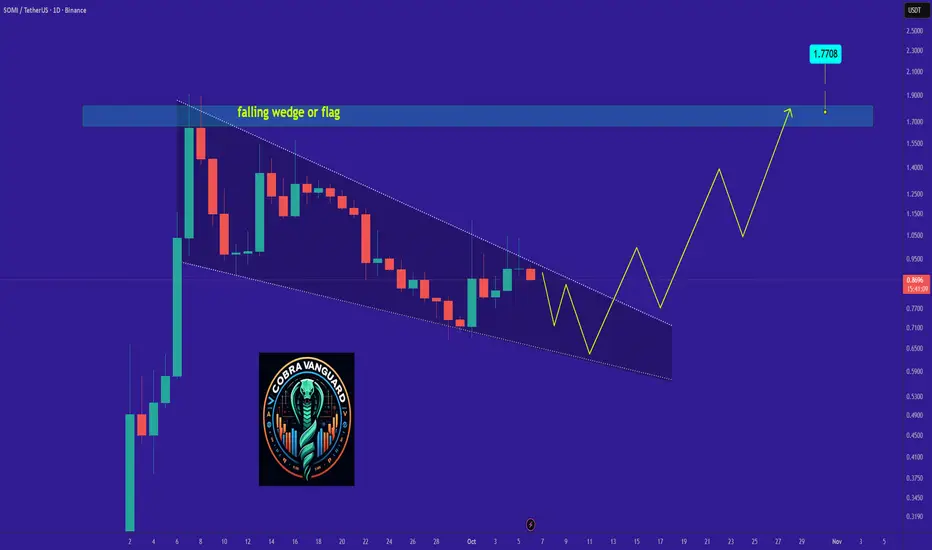
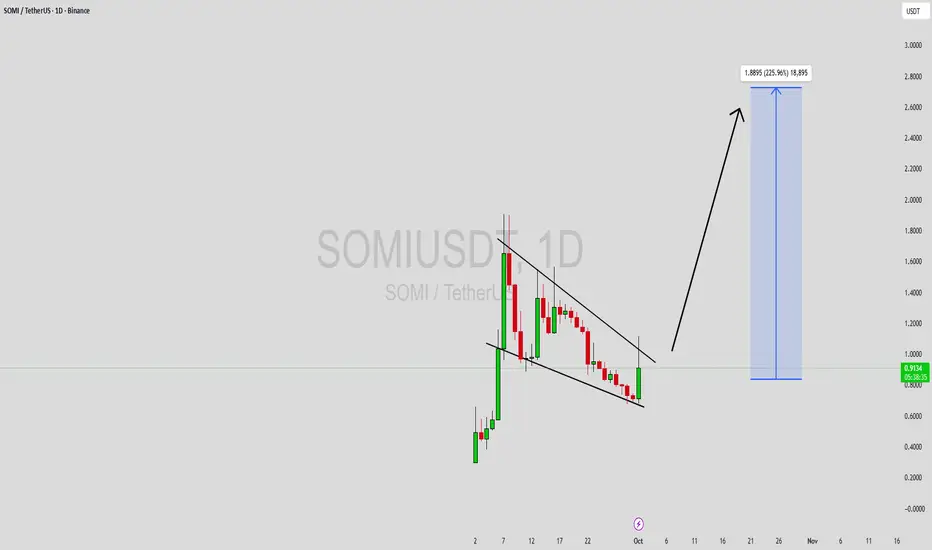
SOMIUSDT Forming Bullish MomentumSOMIUSDT is forming a clear bullish momentum pattern, a classic bullish reversal signal that often indicates an upcoming breakout. The price has been consolidating within a narrowing range, suggesting that selling pressure is weakening while buyers are beginning to regain control. With consistent volume confirming accumulation at lower levels, the setup hints at a potential bullish breakout soon. The projected move could lead to an impressive gain of around 50% to 60% once the price breaks above the wedge resistance.
This bullish momentum pattern is typically seen at the end of downtrends or corrective phases, and it represents a potential shift in market sentiment from bearish to bullish. Traders closely watching SOMIUSDT are noting the strengthening momentum as it nears a breakout zone. The good trading volume adds confidence to this pattern, showing that market participants are positioning early in anticipation of a reversal.
Investors’ growing interest in SOMIUSDT reflects rising confidence in the project’s long-term fundamentals and current technical strength. If the breakout confirms with sustained volume, this could mark the start of a fresh bullish leg. Traders might find this a valuable setup for medium-term gains, especially as the wedge pattern completes and buying momentum accelerates.
✅ Show your support by hitting the like button and
✅ Leaving a comment below! (What is You opinion about this Coin)
Your feedback and engagement keep me inspired to share more insightful market analysis with you!
In-depth trading ideas
The bottom formation has been completedThe upward journey, as you can see from the chart, began today with the shift to an upward trend. This is just a prediction, however, because the IPO price was 30 cents, and now we are significantly below that price. The first wave targeted the first Fibonacci retracement level. Will there be a second wave to the second Fibonacci retracement level? We are waiting to see.
Somnia (SOMI) turns bullish after a double-bottom (PP: 1,569%) The 6-February low has been confirmed as the market bottom. Somnia (SOMIUSDT) is turning green after briefly challenging this support. So we have a double-bottom followed by four consecutive green days, today being the fourth.
SOMIUSDT has a full green candle today. The session started red and all selling is now being bought with bullish momentum increasing. The action is happening at the top of the session giving us a desirable situation. Volume is rising.
When putting all these together a picture starts to form. This can be the start of a new market phase.
Notice the strong downtrend on the left side of the chart. It leaves no room for doubt, that's Crypto. When the market is going down, there is no way to not realize this. When the market is going up, it is the same.
The lack of a downtrend reveals the market is in a period of indecision, accumulation or transition. The question that remains will always be about the direction the market takes after the period of rest, sideways. This is the part where we invoke the rest of the market.
All the charts, pairs and projects with the same sequence; a downtrend followed by sideways, are now breaking bullish. Either a continuation of the sideways period or a bullish breakout. There are no new bearish impulses developing from these all-time lows.
We do see double-bottoms and shy lower lows, but no new bearish trend. This reveals the market preparing for a massive bullish wave. Watch how Somnia grows.
Thank you for reading.
Namaste.
SLong
somiusdt 25-02-26Looking at the chart, it appears that the price is currently rallying and has not yet shown any reversal pattern. This is supported by the emergence of compression, indicating that the price is seeking liquidity in areas of stronger supply. Increased trading volume and open interest also support opening a long position.
Somnia —No longer bearish, bargain prices across CryptoEven the new projects are showing a lack of bearish momentum. In this case, Somnia, the downtrend has been broken more than two months ago, 7-December 2025.
"Somnia (SOMI), a EVM-compatible L1 blockchain with a focus on mass consumer applications such as games and entertainment products."
These past two months, December and January, we see a bottom being established. We can clearly see and appreciate a lower low, but there was also a bullish breakout late January before this recent lower low. Which shows that these are general price swings, market noise.
If the action was happening down, down and more down only; but no, it goes up and down, up and down within a range, sideways. This is the transition period.
The downtrend ends, the market goes sideways with the usual swings and then the start of a new trend, the uptrend.
So all looks good and here we have additional proof.
This chart is young and it can be said that a new downtrend is as likely as an uptrend, but, when we take into consideration the entire market, and the fact that it has been crashing for years with trading volume being very low, we know that sellers ran out of ammunition.
The RSI hit extreme oversold conditions on thousands of trading pairs, the MACD the same. These are the signals that reveal that lower is not likely nor possible, we are going up next.
New projects or old projects, we are going up. I will continue to show you many altcoins with huge potential for growth.
"Buy when the action is happening at support." "Buy when prices are low."
This is another signal based on common wisdom, it is not very attractive to buy today. And that's how it always goes.
Doesn't it feel very tempting to jump in strong when prices are up? What is the mood now?
Something like, "stay away." This is the signal that lower is no longer possible.
This feeling of a depressed market is because the market is depressed, the market only becomes depressed at bottom prices, never at all-time highs.
When there is excitement, euphoria, greed and maximum growth, that's the time to be cautious. When the market is quiet, shy, slow and trading low, that's the time to be an optimist and load up. Buy as much as you want because the bottom will only last a few months.
Once the bottom is gone, it won't be revisited for years to come. Sometimes, the bottom is never visited again. Think about it. The Cryptocurrency market is offering great bargain prices.
Thank you for reading.
Namaste.
SOMI/USDT — Macro Bottom ConfirmedSOMI/USDT has already completed its macro bottoming process, followed by a powerful first impulsive leg exceeding +100%, clearly signaling a trend shift from accumulation to expansion.
This kind of move is rarely a one-off. After strong first legs, markets typically enter a healthy corrective phase to reset momentum, absorb supply, and prepare for the next continuation leg.
SOMIUSDT Forming Falling WedgeSOMIUSDT is forming a clear falling wedge pattern, a classic bullish reversal signal that often indicates an upcoming breakout. The price has been consolidating within a narrowing range after the recent down move, suggesting that selling pressure is gradually weakening while buyers are starting to regain control. With consistent volume confirming accumulation at these lower levels, the setup is hinting at a potential bullish breakout soon. If the price breaks decisively above the wedge resistance, the projected move could lead to an impressive gain of around 90% to 100% from the breakout point.
This falling wedge pattern is typically seen at the end of downtrends or during corrective phases, and it represents a potential shift in market sentiment from bearish to bullish. Traders closely watching SOMIUSDT are noting the strengthening momentum as it nears a breakout zone. The good trading volume adds confidence to this pattern, showing that market participants are positioning early in anticipation of a reversal.
Investors’ growing interest in SOMIUSDT reflects rising confidence in the project’s long-term fundamentals and current technical strength. If the breakout confirms with sustained volume, this could mark the start of a fresh bullish leg. Traders might find this a valuable setup for medium-term gains, especially as the wedge pattern completes and buying momentum accelerates.
✅ Show your support by hitting the like button and
✅ Leaving a comment below! (What is your opinion about this Coin)
Your feedback and engagement keep me inspired to share more insightful market analysis with you!
SOMIBINANCE:SOMIUSDT
SOMI/ USDT
Entry range (0.24- 0.26)
SL 4H close below 0.23
T1 0.29
T2 0.35
T3 0.38
T4 0.45
T5 0.50
3 optional extra targets on the chart
_______________________________________________________
Golden Advices.
********************
* collect the coin slowly in the entry range.
* Please calculate your losses before the entry.
* Do not enter any trade you find it not suitable for you.
* No FOMO - No Rush , it is a long journey.
SOMIUSDT RSI Divergence Hints at Trend ShiftSOMIUSDT continues its downward decline, with price now approaching a major support zone after reacting from the dynamic trendline. The current structure suggests the potential for a final retest of the trendline, which would complete a bullish divergence against RSI, as outlined on the chart. The highlighted accumulation zone represents a high probability area for strategic buying, with upside targets already mapped toward the key supply zone. Patience is required as confirmation at support remains critical.
Somi and two zones of interest! Which one we will hold? After the listing, we work with areas of interest! Initiation accumulation distribution phases
BITGET:SOMIUSDT
Now we are trading within the range of the first zone of interest! If we hold, the road will be open until the first block order on D tf and test 100 ema D tf
So far, according to the structure in mid-December, there was only a choch change of character, but not a full-fledged breakdown of the structure!
The negative scenario is going to the second zone of interest! Invalidation of the whole idea is a drop below 9 cents! I personally lean towards the first scenario
SOMIUSDT 1DKeep an eye on the #SOMI daily chart. It appears to have found its bottom and bounced upward, suggesting it may be entering a growth phase. Volume has increased, and it is now facing the daily SMA50. In case of a breakout above it, the potential targets are:
🎯 $0.3762
🎯 $0.4782
🎯 $0.5607
🎯 $0.6431
🎯 $0.7604
🎯 $0.9099
⚠️ Always remember to use a tight stop-loss and maintain proper risk management.
SOMI Sell/Short Signal (30M)Considering that the structure has turned bearish with the recent CH, and the short-term trendline has been broken, short sell positions can be considered on SOMI
At the first target, close half of the position and then move the stop loss to breakeven (entry point)
Do not enter the position without capital management and stop setting
Comment if you have any questions
thank you
SOMIUSDT Forming Bullish ContinuationSOMIUSDT is forming a clear bullish continuation pattern, a classic bullish reversal signal that often indicates an upcoming breakout. The price has been consolidating within a narrowing range, suggesting that selling pressure is weakening while buyers are beginning to regain control. With consistent volume confirming accumulation at lower levels, the setup hints at a potential bullish breakout soon. The projected move could lead to an impressive gain of around 390% to 400% once the price breaks above the wedge resistance.
This falling wedge pattern is typically seen at the end of downtrends or corrective phases, and it represents a potential shift in market sentiment from bearish to bullish. Traders closely watching SOMIUSDT are noting the strengthening momentum as it nears a breakout zone. The good trading volume adds confidence to this pattern, showing that market participants are positioning early in anticipation of a reversal.
Investors’ growing interest in SOMIUSDT reflects rising confidence in the project’s long-term fundamentals and current technical strength. If the breakout confirms with sustained volume, this could mark the start of a fresh bullish leg. Traders might find this a valuable setup for medium-term gains, especially as the wedge pattern completes and buying momentum accelerates.
✅ Show your support by hitting the like button and
✅ Leaving a comment below! (What is your opinion about this Coin?)
Your feedback and engagement keep me inspired to share more insightful market analysis with you!
SOMI (SPOT)BINANCE:SOMIUSDT
#SOMI/ USDT
Entry range (0.2630- 0.2830)
SL4H close below 0.250
T1 0.310
T2 0.390
T3 0.460
2 Extra Target is optional 0.490 , 0.590
_______________________________________________________
Golden Advices.
********************
* collect the coin slowly in the entry range.
* Please calculate your losses before the entry.
* Do not enter any trade you find it not suitable for you.
* No FOMO - No Rush , it is a long journey.
SOMIUSDT Forming Falling WedgeSOMIUSDT is currently displaying a strong bullish outlook as it forms a falling wedge pattern, a well-known reversal structure in technical analysis. This pattern often signals a potential breakout to the upside after a period of consolidation and price compression. With solid trading volume supporting the structure, the setup is showing increasing confidence from market participants, positioning SOMIUSDT for a powerful move ahead.
The falling wedge pattern suggests that sellers are losing control while buyers are gradually stepping in at key levels. Once the breakout confirms, the momentum can accelerate quickly, leading to sharp upward price action. Based on the technical outlook, the expected gain projection stands between 190% to 200%+, which reflects a major growth opportunity for traders and investors closely monitoring this pair.
Investor interest in SOMIUSDT has been gaining traction, supported by the improving chart structure and positive sentiment around altcoins. The combination of high-volume activity, bullish technical indicators, and a strong reversal setup makes this pair highly attractive for both short-term traders and long-term holders. If the breakout unfolds as projected, SOMIUSDT could deliver significant returns and emerge as one of the strong movers in the market.
✅ Show your support by hitting the like button and
✅ Leaving a comment below! (What is You opinion about this Coin)
Your feedback and engagement keep me inspired to share more insightful market analysis with you!
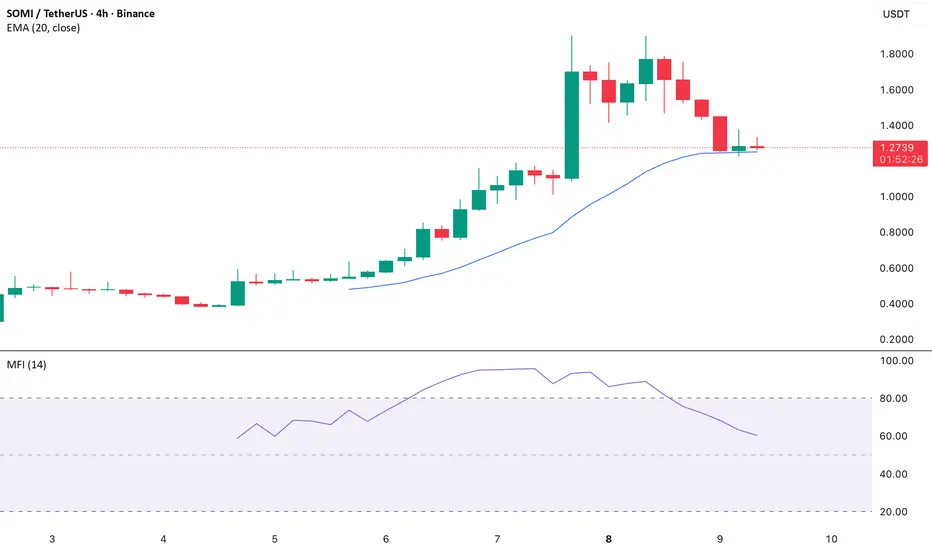
Money Flow Index Points to Selling Pressure
On the SOMI/USD four-hour chart, the Money Flow Index (MFI) has been trending downward, indicating a rise in selloffs. Since the MFI accounts for both price and volume, a decline confirms that sellers are steadily gaining control while buyers lose momentum.
SOMI’s recent price action has brought it closer to the 20-day Exponential Moving Average (EMA), underscoring fading buy-side strength. The EMA serves as a key gauge of short-term market sentiment—trading above it signals sustained bullishness, while a breakdown below suggests a bearish shift.
If SOMI closes decisively below the 20-day EMA, it would signal a move away from the token’s early post-launch optimism toward a more bearish phase. Such a breakdown could invite heavier selling pressure, paving the way for deeper losses ahead.