In-depth trading ideas
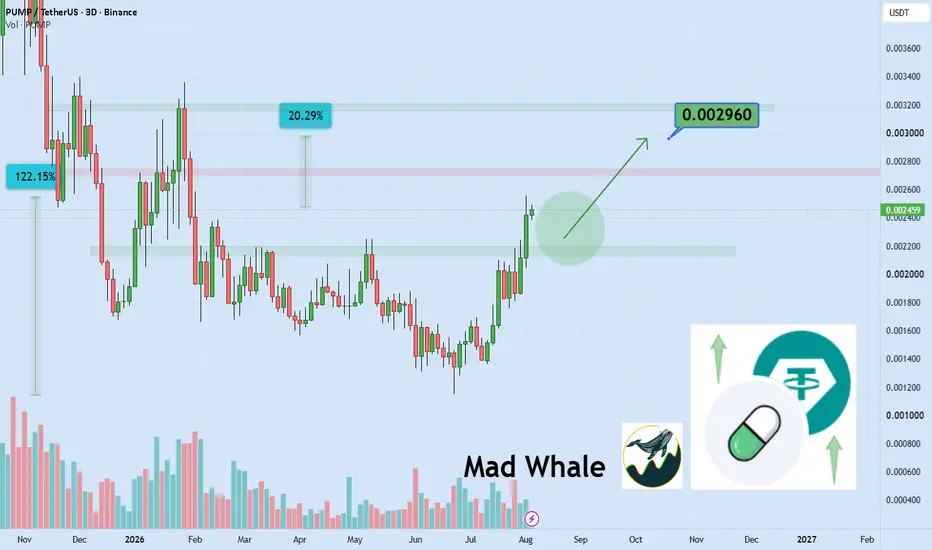
PUMPUSDT Forming Bullish MomentumPUMPUSDT is forming a clear bullish Momentum pattern, a classic bullish reversal signal that often indicates an upcoming breakout. The price has been consolidating within a narrowing range, suggesting that selling pressure is weakening while buyers are beginning to regain control. With consistent volume confirming accumulation at lower levels, the setup hints at a potential bullish breakout soon. The projected move could lead to an impressive gain of around 50% to 60% once the price breaks above the wedge resistance.
This bullish momentum pattern is typically seen at the end of downtrends or corrective phases, and it represents a potential shift in market sentiment from bearish to bullish. Traders closely watching PUMPUSDT are noting the strengthening momentum as it nears a breakout zone. The good trading volume adds confidence to this pattern, showing that market participants are positioning early in anticipation of a reversal.
Investors’ growing interest in PUMPUSDT reflects rising confidence in the project’s long-term fundamentals and current technical strength. If the breakout confirms with sustained volume, this could mark the start of a fresh bullish leg. Traders might find this a valuable setup for medium-term gains, especially as the wedge pattern completes and buying momentum accelerates.
✅ Show your support by hitting the like button and
✅ Leaving a comment below! (What is You opinion about this Coin)
Your feedback and engagement keep me inspired to share more insightful market analysis with you!
PUMP Price Analysis: Testing Resistance Above EMA SupportPUMP price action is currently trading above its EMA ribbon, with the indicator continuing to provide a layer of dynamic support. On the daily timeframe, price has established a support region following a recent bounce and is now moving toward higher-timeframe resistance near the current swing high.
A break above this swing high could potentially indicate a continuation of the prevailing trend and open the possibility of further upside. However, the quality of the breakout would be important to monitor. Sustained bullish volume and stronger buying participation could provide greater confirmation that the move has broader market support.
If price breaks above resistance without a meaningful increase in bullish volume, the breakout could remain vulnerable to rejection and a return to a rotational trading environment. In that scenario, price could continue consolidating within the existing range rather than establishing a sustained trend.
The daily support level remains an important part of the current structure. A loss of this support could weaken the bullish setup and increase the probability of a move toward lower weekly support.
Overall, PUMP remains at a technically important area, with the interaction between the EMA ribbon, daily support, volume, and higher-timeframe resistance likely to shape the next phase of price action.
----------------------------------------------------------------------------------------------
Don't invest unless you're prepared to lose all the money you invest. This is a high-risk investment and you should not expect to be protected if something goes wrong. Take 2 mins to learn more: coinjar.com/uk/risk-summary
The article is an opinion expressed by the author at a point in time and does not represent the views of CoinJar UK Limited or CoinJar Australia Pty Ltd. Take care to consider the date of this article and be aware that this opinion is based on circumstances at the time of publishing. No responsibility or liability is accepted for any errors of fact or omission expressed therein. Past performance is not a reliable indicator of future results.
This above article is not to be read as investment, legal or tax advice and it takes no account of particular personal or market circumstances; all readers should seek independent investment advice before investing in cryptocurrencies.
We recommend you obtain financial advice before making a decision to use your credit card to purchase cryptoassets or to invest in cryptoassets.In the UK, it's legal to buy, hold, and trade crypto, however cryptocurrency is not regulated in the UK. It's vital to understand that once your money is in the crypto ecosystem, there are no rules to protect it, unlike with regular investments.
You should not expect to be protected if something goes wrong. So, if you make any crypto-related investments, you're unlikely to have recourse to the Financial Services Compensation Scheme (FSCS) or the Financial Ombudsman Service (FOS) if something goes wrong.
----------------------------------------------------------------------------------------------
Warning: If you invest in this product, you may lose some, or all, of the money you invest. The value of crypto-assets may rise or fall rapidly. Past performance is not indicative of future results. To learn more see our Risk Disclosures.
CoinJar Europe Limited is authorised by the Central Bank of Ireland as a crypto-asset service provider (registration number C496731)
----------------------------------------------------------------------------------------------
Satoshi Frame | PUMP Key Resistance Watch🦉 Welcome To SatoshiFrame Tradingview Channel.
⛳️ Lets dive into a PUMPFUN analysis.
📉 PUMP on the 4H timeframe has completed a correction down to the 61.8% Fibonacci retracement level, where it found support around $0.003824.
⛏️ Following the recent correction, PUMP has been trading inside a descending channel. After breaking above the channel’s midline, the price formed a higher low compared to its key support zone.
↗️ If the price successfully breaks the 4H resistance at $0.004538, while also breaking above the upper boundary of the descending channel with increasing buying volume, it could continue toward the next major resistance level, which is a weekly resistance zone.
🎯 The confirmations we can look for before activating the current setup include an increase in buying volume, an RSI breakout above the 64.36 level, and the structure and strength of the breakout candle.
🧲 On the other hand, if the price gets rejected from the current resistance and selling pressure pushes it back toward the weekly support at $0.003824, losing this support could trigger a deeper correction for PUMP.
⚠️ Risk management and capital management are essential in trading. Always trade based on your own strategy and risk tolerance. Every trading decision and its outcome are entirely your own responsibility.
PUMP/USDT | H2 | SPECULATIVE BOUNCE AT RANGE BOUNDARY🎯 TP1: $0.003961 (+3.73%) │ TP2: $0.004104 (+7.46%)
🛑 SL: $0.003560 (-6.78%) │ R/R: 1 : 1.1
⚠️ SL placed beyond the nearest candle wicks to reduce the risk of accidental stop-out
FUNDAMENTAL BACKGROUND
PUMP moves in the absence of its own strong project catalysts, reacting to the general sentiment in the alt-segment and meme tokens of the Solana ecosystem. Discussion of the upcoming token unlock around September 12 creates supply pressure, but Pump.fun's buyback mechanics partially balance the risks. The Fear and Greed Index remains in the greed zone, supporting demand for high-risk assets, but the market has already recorded local pullbacks, making the momentum vulnerable. No significant macro releases directly affecting crypto risk appetite are expected in the coming days.
TECHNICAL PICTURE
The price is in the lower 20% of the last 100 candles' range, consolidating near the recent low of $0.003749. The Williams %R indicator at -96.0 indicates extreme oversold conditions, which historically often precedes a technical bounce. The Keltner Width at 15.19% confirms high volatility, sufficient for a move of more than 1.5% from the current price. Key resistance lies near the upper boundary of the local range at $0.003850–0.003900, a breakout of which would open the path to $0.004000.
PROBABILITY MODEL
The market is in a bearish mode with a 47% probability of a bearish reversal and a 43% probability of a bullish continuation. The model records an extremely low probability of a sideways move (10%), indicating an inevitable sharp movement. Given the extreme oversold condition on Williams %R and the price's proximity to the range low, the scenario of a technical bounce from support appears preferable, although the overall bearish backdrop retains risks.
DIRECTION
🟢 BUY
Extreme oversold on Williams %R at the lower range boundary creates conditions for a technical bounce.
Is PUMP starting its biggest run?The pump.fun token, which looked dead for a long time, suddenly pumped more than 300% on the back of team buybacks and ecosystem growth.
But after such a strong move, there is usually potential for a big correction.
Is that also the case with NYSE:PUMP ?
1️⃣ Right now, price has dropped into the gap zone at $0.00464–$0.00389. Just below this level, diagonal support begins.
This lines up perfectly with a simple thesis: price closes the FVG, tests support, and bounces back. But there are risks.
2️⃣ Right now, at the end of the second FVG, the first major cluster of buyer liquidity has formed, which could become the next target.
3️⃣ In general, there is more buyer liquidity in NYSE:PUMP than seller liquidity. And as we know, price usually moves toward where there is more liquidity.
4️⃣ At the same time, directly above us, at $0.00509, there is a strong order block, a tight zone with almost $600B in short liquidity.
So right now, there are two working theses:
📈 Price squeezes the order block above, collects liquidity, and then moves lower toward $0.00376, where the first long positions can be accumulated.
📉 Or price goes straight to $0.00376, and if we get a bounce, short-term trades can be opened toward the order block at $0.00509.
Trade 1 $PUMP Long (4 Hourly) - $1,000 - $10,000Trade 1 - $1,000 to $10,000 challenge. This first one is a push from the current bull flag to a previous resistance area. Stop Loss is at the mid range of the flag and entry is upon break of the flag. My trading strategy involved swing trading and typically strictly candle patterns. I like to trade the basic way. Each trade will be adjusted so that my stoploss loses 0.5% of my portfolio. This challenge may take a year or more, lets see. Trade will be invalid if the price does not stick to the bull flag pattern
PUMP - AnalysisPUMP - Analysis
After a crazy run, PUMP seems to be coming to an end.
PUMP has broke down from its bullish trendline that has held price for the past 2 months.
Soon, we'll see the support zone gets broken through too.
Watch out, it's going to be quite painful, as the rally is just as big.
PUMP USDT SHORT SIGNAL83. PUMP/USDT – Trade Setup (SHORT)
📈 Position Type: SHORT
🕒 Timeframe: 1H
📊 Market: Futures
💰 Entry Zone:
0.004885
0.005050
🛑 Stop-Loss:
0.005161
🎯 Take-Profit Targets:
• TP1: 0.004689
• TP2: 0.004440
• TP3: 0.004181
• TP4. 0.003889
Tp5.
⚙️ Leverage:
5*10
▫️ After TP1, move SL to Entry + 0.2%.
▪️ Exit Plan:
• 40% at TP1
• 20% at TP2
• 20% at TP3
20% at TP4
📌 Risk Management:
Risk only 1–2% of your capital per trade.
⚠️ Always check and confirm the setup on your chart before entering the trade.
PumpFun Changed Character. Now The Market Needs To Prove It.The market rarely rewards impulse, but it consistently pays those who have the patience to wait for structure to complete itself.
Why PumpFun Is Catching Attention
Behind the speculative nature of meme platforms, PumpFun has built one of the most profitable fee-generating revenue models in the Solana ecosystem. Unlike protocols that rely purely on narrative, PumpFun operates as a cash-flow machine through token creation and trading fees. When a protocol with a real revenue footprint finishes a long accumulation phase, technical traders take notice.
Technical Structure
After a prolonged downtrend and months of quiet accumulation, price finally broke out of its macro trendline from the July lows.
Following the initial expansion above 0.0029, the market is now cooling off. We don't predict whether price will retest the 0.0027 – 0.0029 level directly or consolidate higher. We simply mark the key structural boundaries and observe.
We don't need to chase green candles. We wait to see if the market accepts these higher levels as a new baseline.
The Plan & Levels
Potential Reaction Zone: 0.0029 – 0.0027
First Target: 0.0040
Main Target: 0.0050
Invalidation Level: 0.0023
Key Observation
If price holds above the key zone and confirms a higher low on the daily timeframe, the path toward 0.0040 opens naturally.
However, if price breaks and closes below 0.0023, the bullish thesis is invalidated, and there is no reason to stay in the trade. We let price provide the confirmation before taking action.
Patience before execution.
Risk Warning:
Trading cryptocurrencies involves significant financial risk. This analysis represents a personal market view and structural perspective, not financial advice. Always define your risk before entering any trade and never risk capital you cannot afford to lose.
PUMPFUN Social Callouts LaunchNYSE:PUMP fun rolled out a "callouts" feature, allowing users to send real-time token alerts to followers, paired with zero-fee trading and cross-chain USDC integration. The update drove over $113 million in platform volume in 24 hours, signaling strong user adoption. This is neutral for PUMP because while it enhances platform utility and could increase fee revenue long-term, the token is not required to use the feature. The immediate price reaction was negative, highlighting a disconnect between product news and token valuation for utility tokens without direct fee accrual. On-chain analytics show Pump fun sold another 84,789 SOL (~$6.25 million) on August 7. This is part of its strategy to monetize protocol fees, bringing total sales to 4.82 million SOL (worth roughly $807 million). This is bearish for PUMP's ecosystem standing as it creates a persistent overhang of sell pressure on Solana, a core partner. It also underscores that the platform's revenue model is based on converting activity to cash rather than reinvesting in its own token's ecosystem. Pump fun is actively evolving its platform to boost engagement, but its native token remains weighed down by mechanical selling and a lack of direct utility. Will rising platform volume from new features eventually translate into sustainable demand for PUMP, or will dilution and sell pressure continue to dominate?
#PUMPUSDT 4H#PUMPUSDT 4H
#PUMP might experience a scenario like this.
Meaning, a move up from the current zone to the red zone, followed by a move down from the red zone to the blue zones.
We've marked the targets and stop loss for both trades.
For both the long and short positions, get your usual required confirmations before entering the trades.
Please also read the post about the different types of entry triggers.
NYSE:PUMP
PUMP.FUN / 4H — What happens when you tune VDS to the assetDefault settings work well across most assets. But VDS has another side — it's fully customizable per asset, timeframe, and exchange.
This chart is the result of that. Five signals. Every single one landed at a meaningful turning point — two SELL signals at local tops, two BUY signals at the lows, and a fresh SELL firing right now.
A full breakdown of how I approach custom tuning is coming soon.
Degens Aping, Platform Printing and The $PUMP Pumping The Meme Casino Just Hit the Nitro Button
Looks like the degens found the buy button again.. PUMP is absolutely sending it, and this time it's not just because someone posted a Pepe with laser eyes. After weeks of getting farmed by paper hands, the token finally caught a wave of fresh hype as traders started rotating back into Solana meme plays
The biggest fuel behind this pump is the growing optimism around Pump. fun's ecosystem
Despite the meme coin market cooling off earlier this year, the platform continues to dominate Solana's token launch scene, generating massive trading activity and protocol revenue. Investors are betting that if meme season returns, Pump .fun will be one of the biggest winners. Basically, people aren't buying the token they're buying a ticket to the degen casino before the crowd shows up
On top of that, crypto sentiment has improved across the board. Bitcoin holding strong and Solana gaining momentum have pushed traders further out on the risk curve. When blue chips stop moving fast enough, degens naturally migrate to high beta plays like PUMP, hoping to catch the next ridiculous candle before Crypto Twitter starts posting rocket emojis every five seconds
Of course, let's not forget the classic crypto recipe, low float momentum, leveraged longs piling in, influencers shilling "early entry," and shorts getting absolutely liquidated into oblivion
Whether this turns into a full blown giga pump or just another exit liquidity event depends on whether buyers can keep the volume flowing. Until then, the meme machine is alive, the casino is open, and someone's portfolio is either going to Valhalla..or straight to McDonald's🍟
$PUMP short-term outlook, considering distribution before leg upPUMP ripped from 0.0022 to a local high near 0.00305 in about a week, one of the strongest moves across alts while the rest of the market stays flat. Price has since pulled back to the 0.00275 area on lighter volume, sitting right above the prior breakout zone near 0.0026.
A +33% run this fast rarely goes in a straight line. Watching for a deeper pullback toward the 0.0024 to 0.0026 range to work off some of this move before the next leg. OBV isn't rolling over, but there's a bearish divergence building against volume worth tracking here.
Reading this as distribution before continuation, not a reversal. The reaction around 0.0026 support will tell the story.
#PUMPUSDT D#PUMPUSDT D
#PUMP
If the red zone at 0.0031–0.0034 gets engulfed and price consolidates above it, PUMP could continue its bullish move.
For now, if you get confirmation at any of the blue zones, you can enter a long position.
The target for now is the red zone.
How do you get confirmation?
Check out the “Types of Triggers” post in the channel.
NYSE:PUMP
PUMP: Parabolic Surge Validates Prior OutlookPUMP: Parabolic Surge Validates Prior Outlook – Chasing Warning and Dual Low-Risk Long Entry Zones
PUMP has logged an impressive vertical expansion wave, officially confirming its bullish trajectory in exact alignment with our previous technical outlook. A strong sequence of green candles has pushed price action cleanly above former accumulation resistance barriers, holding firmly above the dynamic MA100 trendline. However, this parabolic surge has stretched market structure, creating a wide gap above underlying support cushions.
Based on the visual data from the daily chart , current market behavior increases the probability of short-term profit-taking retracements. Initiating fresh buy orders (FOMO Long) at these extended levels introduces severe drawdown risks. Strict risk management protocol requires patience to wait for a technical pullback to optimize trade execution.
This technical framework presents two high-edge Long entry zones for traders:
Scenario 1: Patiently await a cooling-off pullback to retest the broken resistance cluster around the $0.00260 handle.
Scenario 2: Await a deeper dip retesting the primary ascending trendline support cushion near the $0.00240 level.
Both entry scenarios deliver an exceptionally tight stop-loss parameter with superior risk-to-reward metrics.
Disclaimer: This is not financial advice, DYOR.
PUMP USDT SHORT SIGNAL#47. PUMP/USDT – Trade Setup (SHORT)
📈 Position Type: SHORT
🕒 Timeframe: 1H
📊 Market: Futures
💰 Entry Zone:
0.002717
0.0028
🛑 Stop-Loss:
0.002952
🎯 Take-Profit Targets:
• TP1: 0.002650
• TP2: 0.002540
• TP3: 0.002444
• TP4. 0.002320
Tp5.
⚙️ Leverage:
5*
▫️ After TP1, move SL to Entry + 0.2%.
▪️ Exit Plan:
• 40% at TP1
• 20% at TP2
• 20% at TP3
20% at TP4
📌 Risk Management:
Risk only 1–2% of your capital per trade.
⚠️ Always check and confirm the setup on your chart before entering the trade.