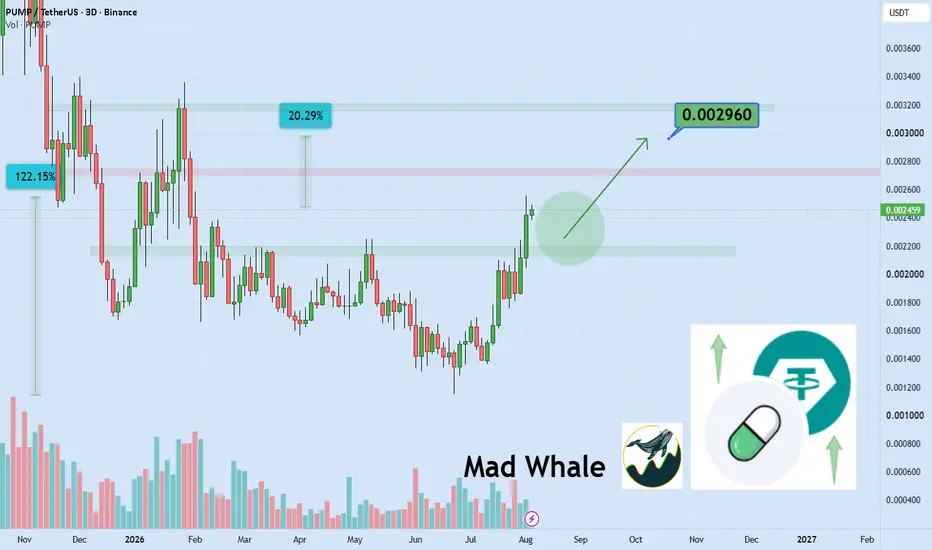
PUMPUSDT Forming Bullish MomentumPUMPUSDT is forming a clear bullish Momentum pattern, a classic bullish reversal signal that often indicates an upcoming breakout. The price has been consolidating within a narrowing range, suggesting that selling pressure is weakening while buyers are beginning to regain control. With consistent vo
PUMP Price Analysis: Testing Resistance Above EMA SupportPUMP price action is currently trading above its EMA ribbon, with the indicator continuing to provide a layer of dynamic support. On the daily timeframe, price has established a support region following a recent bounce and is now moving toward higher-timeframe resistance near the current swing high.
Satoshi Frame | PUMP Key Resistance Watch🦉 Welcome To SatoshiFrame Tradingview Channel.
⛳️ Lets dive into a PUMPFUN analysis.
📉 PUMP on the 4H timeframe has completed a correction down to the 61.8% Fibonacci retracement level, where it found support around $0.003824.
⛏️ Following the recent correction, PUMP has been trading inside a des
PUMP/USDT | H2 | SPECULATIVE BOUNCE AT RANGE BOUNDARY🎯 TP1: $0.003961 (+3.73%) │ TP2: $0.004104 (+7.46%)
🛑 SL: $0.003560 (-6.78%) │ R/R: 1 : 1.1
⚠️ SL placed beyond the nearest candle wicks to reduce the risk of accidental stop-out
FUNDAMENTAL BACKGROUND
PUMP moves in the absence of its own strong project catalysts, reacting to the general sentiment
Is PUMP starting its biggest run?The pump.fun token, which looked dead for a long time, suddenly pumped more than 300% on the back of team buybacks and ecosystem growth.
But after such a strong move, there is usually potential for a big correction.
Is that also the case with NYSE:PUMP ?
1️⃣ Right now, price has dropped into the
Trade 1 $PUMP Long (4 Hourly) - $1,000 - $10,000Trade 1 - $1,000 to $10,000 challenge. This first one is a push from the current bull flag to a previous resistance area. Stop Loss is at the mid range of the flag and entry is upon break of the flag. My trading strategy involved swing trading and typically strictly candle patterns. I like to trade
PUMP - AnalysisPUMP - Analysis
After a crazy run, PUMP seems to be coming to an end.
PUMP has broke down from its bullish trendline that has held price for the past 2 months.
Soon, we'll see the support zone gets broken through too.
Watch out, it's going to be quite painful, as the rally is just as big.
See all ideas
Summarizing what the indicators are suggesting.
Oscillators
Neutral
SellBuy
Strong sellStrong buy
Strong sellSellNeutralBuyStrong buy
Oscillators
Neutral
SellBuy
Strong sellStrong buy
Strong sellSellNeutralBuyStrong buy
Summary
Neutral
SellBuy
Strong sellStrong buy
Strong sellSellNeutralBuyStrong buy
Summary
Neutral
SellBuy
Strong sellStrong buy
Strong sellSellNeutralBuyStrong buy
Summary
Neutral
SellBuy
Strong sellStrong buy
Strong sellSellNeutralBuyStrong buy
Moving Averages
Neutral
SellBuy
Strong sellStrong buy
Strong sellSellNeutralBuyStrong buy
Moving Averages
Neutral
SellBuy
Strong sellStrong buy
Strong sellSellNeutralBuyStrong buy
Displays a symbol's price movements over previous years to identify recurring trends.