LYB - Resistance Retest and Cup & Handle Setup💡 Swing setup idea
Resistance retest / cup and handle breakout
🔎 Analysis summary:
The price just crossed above the 50 SMA and is now reaching resistance. We can also see a small cup and handle closing, which makes this setup worth watching.
👀 Levels to watch:
Entry trigger: Break above $64.90
Target: $77.90
Stop: Under the breakout level
💬 Will the price break through this area? Let me know in the comments! 👇
Good luck!
⚠️ Note: This is for educational purposes only and is not financial advice.
In-depth trading ideas
Parabolic Extension, Volume Deceleration Warning Extreme Bull Stack, Para Extension, Volume Deceleration Warning
LYB is trading at 80.45 with no futures market. Pure spot read with 596.8M in dollar volume. Chart structure shows a clean base through December and January off the Demand zone, BOS confirmed to the upside, price now pushing into old POI territory with supply visible above. The move from the POI lows has been sustained and structured. Bull Cascade is 4 bars into a confirmed pattern with 9.7% five-bar move and 5-bar acceleration logged.
51 green versus 5 red out of 112 — 89.01% bull at 17.2x ratio. C>T 13:1, EMA 10:0, Candle 13:1, Ichi TK 12:2 all dominant green. SS/DD balanced at 2:2. Pattern total 3:0 clean. Spread 89% Extreme. Squeeze None with BW at 34.98% Expanding — bands are opening outward, energy is being released into the current move rather than coiling for a future one. Momentum reading Bull ↑. Retrace at -1% Extreme BO with bounce target 48.2% at 48.4x Para — the system is flagging this as a fully extended parabolic breakout.
Spot Z at 0.67 Active, no futures. VolZ sequence reads 0.67:6.33:-5.66 with Deceleration — this is the critical data point. The composite VolZ is in steep decay, meaning the volume impulse that launched this move has already peaked. Current spot volume is average-to-active but not expanding with price. Spot momentum consolidating downward at 180.2% Normal. Bull:Bear Z at 1.47 vs -0.80 Bull Lean — directionally correct but not dominant enough for a move of this magnitude.
No leverage, no percentile, no AT Max or Min data. Retrace flagged at -1% meaning price has barely pulled back into the current leg. A 48.2% bounce target at 48.4x with Para classification means the system sees significant upside potential but rates it as an overextended parabolic projection, not a measured base target. Clarity at 50% reflects the tension between a dominant signal stack and a decelerating volume picture.
OBV Z at 0.41 Strong ↑ with Normal divergence — OBV is rising and not showing distribution. The structural accumulation base from November through January is visible on the chart and OBV has been confirming the trend. No Whale activity, no liquidation data. The Bull Lean on Bull:Bear Z is consistent with a real trend but lacks the force typically seen at 89% signal dominance.
The honest read: LYB is running one of the stronger equity bull stacks in the scan with legitimate structural confirmation from BOS, cascading demand zones, and clean OBV. The problem is the same as any parabolic extension — VolZ decelerating at 0.67:6.33:-5.66 means the fuel is fading. Bull:Bear Z at 1.47 should be running closer to 3 or 4 given the signal stack. Supply sits overhead at the old POI. The setup is not a fade, but it is not a chase either. Let price either pull to the -1% retrace zone with OBV Z holding above 0.3, or let Spot Z re-accelerate above 1.5 before adding. The 48.2% target remains valid as a trend projection, not an entry signal.
Is That Crypto Pump Real? Data Says No. Here's Why.
Stop Losing Money to Fake Volume. Find Real Moves Now.
Trade the REAL Crypto Volume. Stop Getting Faked Out.
Squeeze Fired, All-Time High. This Is the Top or the Breakout.Price is at 66.64 and the price percentile is 100%. All-time high is 66.64. This stock is printing a new all-time high right now, with the squeeze just fired. That combination demands a clear-eyed read because it cuts both ways.
Signal count is 47 green vs 2 red out of 112. That is the strongest signal stack in today's entire scan across every asset reviewed. EMA is 10:0 — a perfect clean sweep. Ichimoku 12:2, C>T 14:0, candles 8:0. SS/DD is 2:8 which is the only red cluster, reflecting supply overhead at all-time high prices — structurally expected and not a contradiction. Spread at 91.8% Extreme.
Futures not found. Pure equity. Every signal is real.
OBV Z is 2.55 Strong↑. That's the highest OBV reading in today's scan by a significant margin. Volume is confirming the all-time high with genuine accumulation, not distribution. 691 transactions at 46K volume — small float behavior with institutional-sized positioning.
The squeeze just fired with Bollinger Width at 20.55% expanding. The retrace is only -1.7% with a 38.8% parabolic bounce target at 22.9x. The system is projecting significant extension from a breakout that has barely started pulling back.
The one flag worth naming: momentum is -2.76 Deceleration — the strongest deceleration reading of the day. Spot momentum expanding downward at 493.7%. At an all-time high with a fired squeeze, deceleration is normal — the initial breakout energy dissipates before the next leg. But it's worth watching because if deceleration accelerates into a reversal, all-time highs with no price history above become air pockets.
The bull case is about as strong as the data produces. 47:2 signals, OBV 2.55, clean EMA sweep, squeeze fired, parabolic target — on a pure equity with no futures noise. The only question at 100% price percentile is always whether this is a breakout into new territory or a distribution top. OBV at 2.55 says accumulation, not distribution. That's the answer until it isn't.
LYB — 93% Bull Signals, Squeeze Building, Volume Confirms DirectPrice is at 61.92 with no futures market. The bias reads 93.9% bull against 6.1% bear across 112 signals. Clarity at 48% and phase is Extreme BO. Retrace is only -0.5% with a 17.1% bounce target at 35.5x Para — the highest multiplier of any setup in today's entire series. That 35.5x is not a typo. It reflects how minimal the current pullback is relative to the projected move, and how extended the Para phase has become.
MTF scoring is 50 green to 4 red. EMA at 9:0 — unanimous. Ichi TK at 13:1 — near-unanimous trend confirmation. Candle at 12:2 — the strongest candle reading of today's equity series. C>T at 14:0 — perfect cross-timeframe trend alignment, every timeframe confirming the same direction. Engulf at 1:0. Spread at 85.2% Extreme. The only counter-signals in the entire structure are SS/DD at 2:4 showing supply, Harami at 0:1, and Pat Tot at 1:1 near-flat. The bear side has almost nothing to work with against a 50:4 signal split.
The squeeze is Building at 3 bars with BW at 11.85% and momentum flipping bull. S.Mom is expanding at 137.9%. This is early-stage compression forming on top of an already extreme bull structure. Three bars in is just the beginning — if this follows the pattern of the other long-duration squeezes in today's series, the building phase has runway ahead before resolution.
Volume confirms the signal structure. Vol Z at 1.57 is Strong with 526M dollar volume. Direction is Bull Dom. Bull:Bear Z reads 2.1 against -0.86 — meaningful bull volume dominance with the bear Z fading. Momentum is Accelerating at 1.35, the cleanest acceleration reading of the equity setups. OBV Z at 0.02 is Strong with an ascending arrow — the transition from neutral to strong inflow with an upward confirmation is the volume signal that upgrades this setup above most of the others in today's series. VolZ 1:5 at 1.57 against 0.22 shows the recent volume spike is new, not a sustained baseline — meaning fresh money is entering, not recycled positioning.
Price percentile at 78.7% Upper between the 42.28 low and 67.22 high. LYB is in the upper portion of its range but not at the ceiling like ROST or MRNA. There is room between 61.92 and 67.22 for the bounce to develop before hitting historical resistance. The 35.5x Para multiplier reflects the trajectory of the current move, not a mean-reversion target — this is a trend continuation setup, not a recovery play.
Bull scenario: C>T 14:0 perfection holds, EMA 9:0 unanimity sustains, OBV Strong inflow continues to build, squeeze resolves upward from the 3-bar compression, and momentum acceleration carries price toward the 17.1% target and beyond into the 67.22 range high. The 35.5x multiplier reflects the Para phase momentum — trend continuation plays in this phase tend to overshoot initial targets when volume confirms direction.
Danger scenario: SS/DD supply at 2:4 is the only structural counter and it is thin, but supply zones at the 78.7% percentile carry more weight than the same reading at a floor. If price enters the supply layer and volume Z fades from 1.57 back toward average, the squeeze building phase aborts and the -0.5% retrace becomes a larger retracement. The C>T 14:0 reading unwinding would be the early warning — watch for any timeframe trend crosses turning red.
The combination of C>T 14:0, EMA 9:0, Ichi TK 13:1, candle 12:2, accelerating volume with OBV inflow rising, and a 3-bar squeeze building makes LYB the cleanest confirmed bull structure in today's equity series. The only question is whether the supply at 2:4 slows the momentum before the squeeze fires. At 3 bars in, there is time to watch how that supply layer handles the next push before committing to the full target.
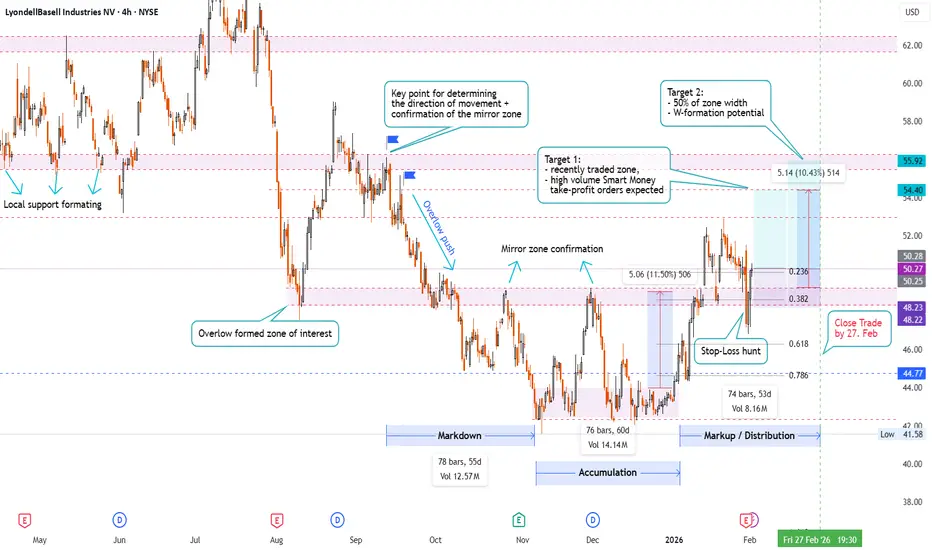
1-Month Long Trade on LyondellBasell Industries NV (Ticker LYB)NYSE:LYB
Technicals:
- price consolidated 60 days after new low formation, letting Smart Money accumulate position
- price diapason formed W-formation with peaks confirming ressistance
- after breaking out the ressistance it became mirror zone with currently proving if it can act as support, having shown resilience on recent retests (20 Jan., 30 Jan., 2 Feb.)
- due to Smart Money manipulations and HFT impact the stop-losses got hunted recently throwing out the early passengers and significantly bounced back to recent consolidation levels
- be aware that price double penetration on 30 Jan, 2 Feb show that the zone is still instable and further close below 20 Jan. may lead to short movement targeting the current Low retest
- scenario invalidated if 2 bars close below 48.35
Fundamentals:
- company held quarterly financial results during conference call on 30 Jan.. Despite there was a strong short candle on that day it is presumed to be the fault of whole market backstep
- the strong buyout on 2 Feb. speaks for at least "not dissapointing financial results"
- despite long-term market sentiment seems to be cloudy, their product remains (under circumstances) pretty demanded for consumer production, so the company may keep balacing on the edge at least for some time before falling under the bear
Conclusion:
- as the markdown and accumulation lasted around 60 days each it is assumed that both the markup and distribution phases may last equal time. Therefore it is recommended to close the trade by 27 Feb.
# - - - - -
⚠️ Signal - Buy ⬆️
✅ Entry Point - 50.25
🛑 SL - 48.22
🤑 TP 1 - 54.40
🤑 TP 2 - 55.92
⚙️ Risk/Reward - 1 : 2.8 👌
⌛️ Timeframe - 1 month 🗓
# - - - - -
Good Luck! ☺️
DISCLAIMER: Not financial advice. Everyone must make trading decisions at their own risk, guided only by their own criteria and strategy for opening or not opening a trade.
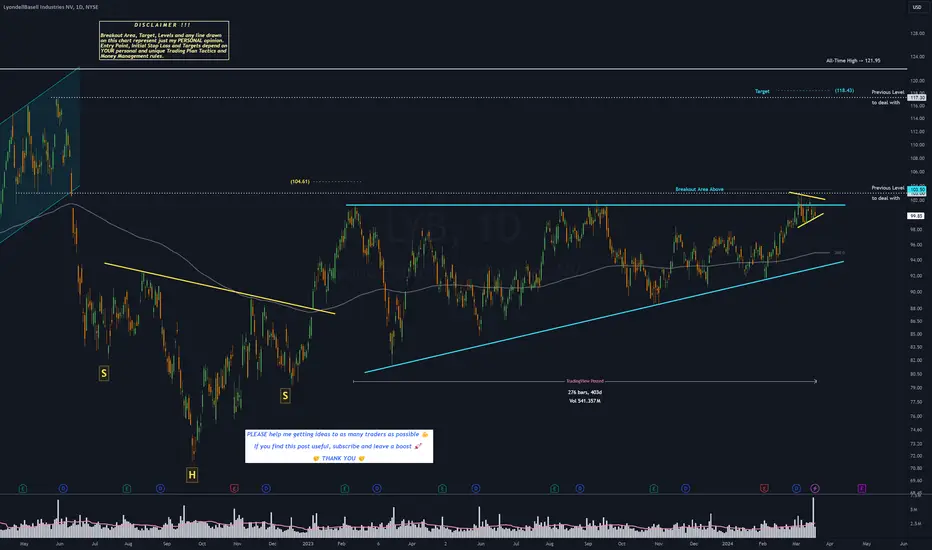
LYB - 13 months ASCENDING TRIANGLE══════════════════════════════
Since 2014, my markets approach is to spot
trading opportunities based solely on the
development of
CLASSICAL CHART PATTERNS
🤝Let’s learn and grow together 🤝
══════════════════════════════
Hello Traders ✌
After a careful consideration I came to the conclusion that:
- it is crucial to be quick in alerting you with all the opportunities I spot and often I don't post a good pattern because I don't have the opportunity to write down a proper didactical comment;
- since my parameters to identify a Classical Pattern and its scenario are very well defined, many of my comments were and would be redundant;
- the information that I think is important is very simple and can easily be understood just by looking at charts;
For these reasons and hoping to give you a better help, I decided to write comments only when something very specific or interesting shows up, otherwise all the information is shown on the chart.
Thank you all for your support
🔎🔎🔎 ALWAYS REMEMBER
"A pattern IS NOT a Pattern until the breakout is completed. Before that moment it is just a bunch of colorful candlesticks on a chart of your watchlist"
═════════════════════════════
⚠ DISCLAIMER ⚠
The content is The Art Of Charting's personal opinion and it is posted purely for educational purpose and therefore it must not be taken as a direct or indirect investing recommendations or advices. Any action taken upon these information is at your own risk.
Trading template for LYB | Full explanationToday, we will take a look at LYB . We can see the price has been moving inside a correction for the last 195 days, and the structure is clear enough to understand its more external limits.
The way I thought this scenario was like this. How many times in the past were similar situations like the current one, and the next question is can I observe a pattern so I can trade?
The answer is: This has happened several times in the past, and yes, there is a clear pattern that I can wait for. Let me show you:
The explanation here is: First we need a big structure (which we already have), then we want to see a breakout followed by a 15 days correction) IF that happens, we want to see the first breakout of that followed by a candlestick below that breakout movement, and at that moment, we set bullish pending orders on the new local high with the stop loss on the previous low. The expected risk to reward ratio on this is 2.5, and based on the previous examples, we had 2 profits and 1 break-even.
What happens if the filter is never fulfilled?: We don't trade ;)
What happens if the filter is fulfilled, your setup is executed, and then the price goes directly to the stop loss:? I lose 3% of my trading capital, and I keep executing as emotionless as possible :D
It's important to show that by doing this, I can eliminate all the emotions from this execution, and by doing that, I can follow my plan without changing things on my strategy. One of the main reasons people are not able to achieve consistency is not because they don't have a good system but because they are not able to follow it (trading psychology)
Thanks for reading! Feel free to share your view and thoughts in the comments.
LYB. Must be this tall to ride this rideBelow the 200 par sars showing in the sky and macd fall below the signal is a clear sign that LYB is a little short.
The $95 puts for 8-20 are still nice and cheap. Looking for a price Target of $92. I’ll be buying 3 contracts selling 1 at $95. The next one at $92. And I’ll let the other one ride to $91 if the stock gods are amicable