F Breakout Activated as Relative Strength Begins to ImproveFord ($F) has broken above its recent consolidation, activating the setup after several weeks of compression.
What makes this interesting is the relative strength picture. F has started to improve against AMEX:XLY even while Consumer Discretionary itself remains a laggard versus the broader market.
This makes F worth watching as a potential emerging leader rather than a sector-momentum story.
The breakout is now active. Risk remains defined by the invalidation level shown on the chart.
Sometimes the leader moves before the sector confirms.
Research only. Not financial advice.
In-depth trading ideas
Ford Might Be StallingFord Motor has stalled after racing higher in the spring, and now some traders may see downside risk.
The first pattern on today’s chart is the surge in late May, followed by a lower high in July. Those rallies, without follow-through, may reflect a lack of confidence in the upside.
Second, the automaker had a weekly low of $14.41 on July 31. It broke below that level the following week, and last week it bounced to stall near the same price. Has old support become new resistance?
Third, the 50-day simple moving average (SMA) has turned negative in August. F is also sitting near its 200-day SMA without much of a rally. That may reveal weakness in the intermediate and long terms.
Fourth, MACD is falling and the 8-day exponential moving average (EMA) is below the 21-day EMA. Those signals could reflect weakness in the short term.
Finally, F has made a slightly higher low this month versus July. If that support breaks, could traders eye support at the 52-week low near $11?
TradeStation has, for decades, advanced the trading industry, providing access to stocks, options and futures. If you're born to trade, we could be for you. Learn more here about TradingView’s Broker of the Year!
Past performance, whether actual or indicated by historical tests of strategies, is no guarantee of future performance or success. There is a possibility that you may sustain a loss equal to or greater than your entire investment regardless of which asset class you trade (equities, options or futures); therefore, you should not invest or risk money that you cannot afford to lose. Online trading is not suitable for all investors. View the document titled Characteristics and Risks of Standardized Options at www.TradeStation.com . Before trading any asset class, customers must read the relevant risk disclosure statements on www.TradeStation.com . System access and trade placement and execution may be delayed or fail due to market volatility and volume, quote delays, system and software errors, Internet traffic, outages and other factors.
Securities and futures trading is offered to self-directed customers by TradeStation Securities, Inc., a broker-dealer registered with the Securities and Exchange Commission and a futures commission merchant licensed with the Commodity Futures Trading Commission). TradeStation Securities is a member of the Financial Industry Regulatory Authority, the National Futures Association, and a number of exchanges.
TradeStation Securities, Inc. and TradeStation Technologies, Inc. are each wholly owned subsidiaries of TradeStation Group, Inc., both operating, and providing products and services, under the TradeStation brand and trademark. When applying for, or purchasing, accounts, subscriptions, products and services, it is important that you know which company you will be dealing with. Visit www.TradeStation.com for further important information explaining what this means.
Week 12 of 52 FORD (F) Opportunity or Trap?Is this a healthy pullback… or the beginning of a deeper correction?
From a structural perspective, price is now positioned in a mid-range decision zone, where risk/reward becomes more selective.
Market Context:
-Strong performance in commercial segment (Ford Pro)
-Continued pressure from EV losses and macro uncertainty
This creates a balanced narrative, often leading to range-bound price action before expansion.
Entry Strategy
$11.64 → 1
$10.70 → 2
$9.90/10 → 3
Upside Levels
$12.20 → first test of supply
$13.00 → continuation zone
$14.50+ → expansion scenario
-This content is for informational purposes only and not financial advice.
Ford - Looking for a buying opportunityPotential support at the lower parallel.
If it is broken to the downside, the only potential support remaining would be two lows, one at 8 and the other at 4.
I expect that if price trades near the lower parallel, it will bounce higher to confirm that there are buyers and allow me to trade in that direction.
F – Macro Long Setup: Liquidity Sweeps & Gap Holding Above TotalFord Motor Company (F) is showing a very strong long-term structural setup on the macro (3M) chart. The market has successfully executed multiple liquidity sweeps at the bottom, proving strong institutional accumulation.
Currently, the price is holding above the Total POC (11.67). The market is maintaining the gap and at the same time not finishing liquidity at 14.89, which indicates immense buying pressure and a refusal to let the price slide lower. With this solid foundation, I expect a strong long-term continuation move upwards.
My Entries / Entry Price: 10.00 - 12.00 USD (Accumulated directly at the Total POC level)
Current Price: 17.44 USD
First Target (TP1): 28.00 USD (Green circle area / Macro trendline resistance)
Main Target (TP2): Open (Macro trend continuation)
Stop Loss (SL): Manual Risk Management (Long-term spot investment)
F Ford the mainstream mobility play in America?
My thesis.
Ford becomes the “default American mass-production EV manufacturer.”
Ford and GM also can be the mainstream of mobility.
Not necessarily the most advanced.
Not necessarily the most profitable.
But the backbone industrial player.
Can the politicians change the risks ? Can Ford or GM be the next on-shore bet like Intel in chips.
Also added Ford $F yesterday, here is why:Cup and handle, range break. A major higher low vs 2022 higher high, this makes it a long term swing too.
Ford Energy seeks to turn batteries once destined for electric vehicles into stationary energy-storage systems for artificial-intelligence data centers, power utilities and large industrial customers. The move puts Ford in competition with other major battery-making companies such as Tesla and LG Energy Solution.
The plan:
Entry: $15.3
Stop: $11.5*
Target: $29
Risk/reward looks attractive. Target is like 4X the risk, meaning the trade is mathematically break-even even if the target is only reached 20% of the time. I believe the probability is significantly higher than that.
Getting it's motor started!Double positive news on Ford recently, a new Energy storage rollout and TR*MP mentioning using Ford factories for making military arms in future. Both could be NYSE:BN injections.
Ford is looking good on the weekly, could push short or long term to $20.... let's see if it's a false start or has a boost!
W pattern or Cup and handle forming too. Both positive.
Ford may no longer be trading as “just an automaker.”Today’s move felt less like a short squeeze and more like institutional repositioning. Something changed in perception with Ford entering the energy space.
The market added roughly $6.5B-$7B in market cap in a single session after the launch of Ford Energy and the emerging narrative around BESS, grid resilience, AI infrastructure, and domestic manufacturing capacity.
Ford already has what America may suddenly value again in a reshoring / defense-industrial cycle: factories, logistics, workforce, battery ecosystem, truck dominance, and manufacturing scale
The interesting question is no longer Ford’s current P/E (which is distorted anyway). The real question becomes how much of Ford’s future valuation comes from energy infrastructure rather than cars?
If Ford Energy successfully connects into hyperscaler demand, AI data center, backup/storage, military microgrids, utility-scale storage, Buy American industrial policy
…then Ford slowly stops trading like a cyclical OEM and starts trading more like an industrial-energy platform.
IMO that does NOT mean “next Tesla.”
But it could mean the market eventually reprices Ford closer to Eaton, Vertiv, Siemens Energy or other strategic infrastructure plays out there.
The key level now is psychological:
If Ford can consolidate above the low teens and hold volume after the initial excitement fades, the market may begin exploring a completely different valuation framework. Targeting $20 for now.
Not financial advice. Just watching the narrative shift in real time.
F Long — $F gaps 11% through key resistance on tariff relief catSetup: On the 4h chart, F collapsed from ~14.50 in late February to a low near 11.30 in early March, then built a base through April in the 11.50–12.80 range. The most recent 4h and 1h action shows a powerful gap-and-go candle on the current session — opening near 12.00 and surging to 13.35 on the highest volume bar visible on the 1h chart (30M+ shares), cleanly breaking above the prior April swing highs around 13.00 and the 12.75–13.05 consolidation zone. This is a volume-confirmed breakout through a meaningful resistance shelf, not a random gap.
Flow: The catalyst is credible — Trump China trip reducing auto tariff fears directly benefits Ford. Options flow is overwhelmingly call-sided with a 17x call/put volume ratio and $380K in bullish premium, with notable ask-side 13C and 13.5C buying across the May 22 and May 29 expirations. The single large 20K-contract bid-side 13C on May 29 introduces some hedging noise but is dwarfed by net call accumulation. Analyst targets (~13.23) are now below current price, which means the stock has re-rated — fast money is chasing, not fading. Insider net buying adds a slow-burn tailwind.
Plan: Stop is placed below the breakout shelf and the prior consolidation ceiling (~12.75–12.85 zone); a close back below that level invalidates the thesis entirely. The 30Y Bond Auction and Kashkari remarks add rate-sensitivity risk within the next hour, so position sizing should reflect that event overhang. Target is the February breakdown origin near 14.50, the last meaningful supply zone before the March collapse — a clean level with roughly 2.3R on the trade. TTL is short given price is already at the breakout level.
📍 Entry: 13.35
🛑 Stop: 12.85
🎯 Target: 14.50
⚖️ R:R: 2.30
Ford: BC Zone in PlayFord is sitting in a very important area on the weekly chart.
From an SK structure perspective, the larger bullish sequence is already validated:
Wave A pushed into the 2011 high
Wave B retraced deeply into the 2020 low
Wave C broke above A with strong displacement into the 2021–2022 high
That C break matters.
It means the higher-timeframe bullish sequence earned validity. Now price is trading back inside the BC reaction area, which is where continuation attempts often begin — but only if buyers actually defend the zone.
This is the key distinction:
Ford is not in a confirmed breakout yet.
It is in the opportunity zone.
The green BC area has acted like a long-term accumulation range. Price has spent years chopping around this zone, which tells me the market is still deciding whether Ford deserves another expansion leg or whether this is just dead money.
The upside target from the active bullish sequence sits around the $33–$40 region.
But that is not the first battle.
The first major test is the old WCL / supply zone around $19–$25. That area rejected price aggressively before, so any bullish continuation has to deal with that zone first before the higher ABC target becomes realistic.
Fundamentally, Ford is mixed.
The strongest part of the business is Ford Pro, which continues to carry real weight. But Model e remains a drag, and Ford is still a cyclical automaker with heavy capital spending, EV losses, tariff/commodity exposure, and execution risk.
So I am not treating this like a clean “buy and forget” compounder.
I see it as a higher-timeframe value/continuation setup that still needs confirmation.
What I would want to see:
Price holds the BC zone
Liquidity is swept below the range
Price reclaims the zone
Weekly structure breaks above the range
Acceptance develops above the $15–$16 area
If that happens, the next upside objective would be the $19–$25 supply zone.
Only after that zone is reclaimed would the $33–$40 ABC target become more serious.
Invalidation is also clear.
If Ford loses the BC area and accepts below the long-term support structure, the bullish continuation thesis weakens heavily.
For now, Ford is not giving a signal.
It is sitting at a decision point.
The chart is showing location.
The market still needs to show commitment.
Not financial advice.
Ford (F) looks undervalued as traders point to upside this weekCurrent Price: 12.87 (Analysis was generated on Monday Morning)
Direction: LONG
Confidence level: 48%(Professional trader snippets emphasize Ford appearing undervalued relative to the broader market due to its low P/E ratio. X sentiment shows some bullish lean but limited volume. With few explicit technical levels and limited data agreement, conviction is moderate‑low but still favors upside.)
Targets
Target 1: 13.20
Target 2: 13.60
Stop Levels
Stop 1: 12.50
Stop 2: 12.20
Key Insights:
Here’s what stands out right away. Several professional traders pointed out that Ford’s valuation looks unusually cheap compared with the broader market. While major indexes continue pushing toward highs, Ford’s price hasn’t moved in the same way. Traders often view this type of valuation gap as a setup for a catch‑up move if sentiment shifts even slightly.
Another thing traders highlighted is how perception matters. A few market experts explained that “cheap” stocks sometimes stay cheap if institutions rotate out of the sector. But if capital rotates back into traditional automakers or value stocks, Ford could benefit quickly. That possibility is why many traders see upside potential rather than downside risk at current levels.
Recent Performance:
Ford has been trading around the $12–$13 range recently, showing relatively tight consolidation compared with higher‑volatility tech stocks. The price sitting near $12.87 puts it in the middle of that range. When a stock holds steady like this while the market remains strong, traders often start looking for a directional break.
Expert Analysis:
Traders following the stock repeatedly mentioned the valuation angle — specifically that Ford’s P/E ratio appears low relative to the broader market rally. Several professional traders view this as a potential catalyst for a short‑term rebound if buyers step in.
At the same time, the trader community is aware of sector‑rotation risk. Some traders are watching closely to see whether institutional money flows back into legacy automakers. If that happens, Ford could move quickly because sentiment around the stock has been muted for a while.
News Impact:
There hasn’t been a major breaking news catalyst around Ford in the immediate term, which actually matters here. Without negative headlines, the focus shifts back to valuation and positioning. In quiet news cycles, undervalued stocks sometimes get attention from traders hunting for relative value opportunities.
Trading Recommendation:
Putting it all together, I’m leaning LONG on Ford this week. The trader consensus around undervaluation combined with stable price action suggests the risk‑reward favors a bounce rather than a breakdown. I’d look for a move toward $13.20 first, with a stretch target near $13.60 if momentum builds. Risk management matters here because conviction across sources isn’t extremely strong — that’s why the stop zone sits around $12.50–$12.20. A smaller position size makes sense given the moderate confidence.
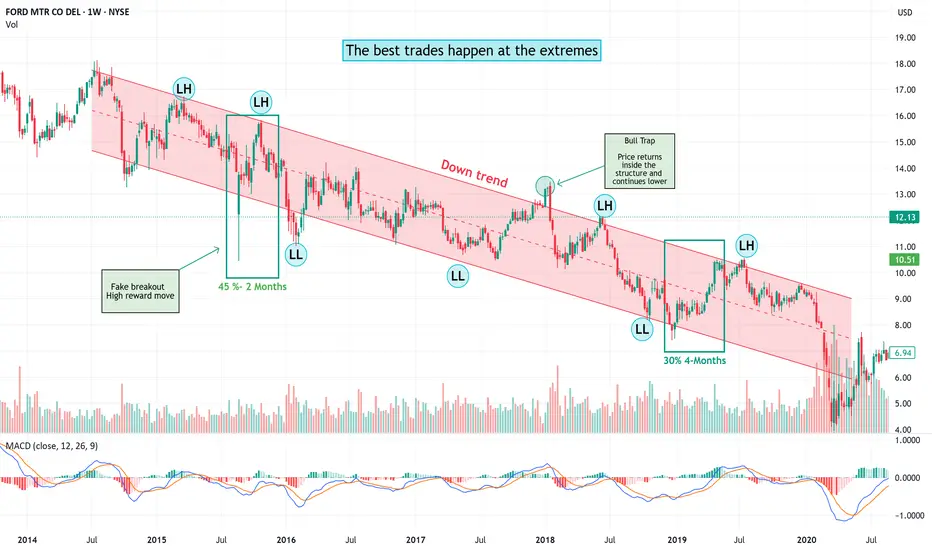
Week 15 of 52 How to read and trade a bearish channel Ford caseCase Study #1 — Ford (Bearish Channel Structure)
This chart shows a classic bearish channel structure.
A bearish trend is defined by two key elements:
-Lower highs (LH)
-Lower lows (LL).
As long as price continues to respect this pattern, the trend remains intact.
How to approach this structure:
First, identify the channel boundaries.
The upper line acts as resistance (selling pressure), while the lower line acts as support (potential reaction zone).
Avoid trading in the middle.
Most losses happen when traders enter without a clear location.
Focus on the extremes:
Near resistance → look for rejection or weakness
Near support → watch for reactions or failed breakdowns
Important concept:
Not every breakout leads to a new trend.
A breakout that fails and returns inside the structure is known as a bull trap.
A breakdown that fails can lead to a strong bounce.
Key takeaway:
The trend provides context
The extremes provide opportunity
The reaction provides confirmation
This behavior repeats across markets and timeframes.
Study the structure, not just the outcome.
—
Not financial advice.
Ford Pro AI: Becoming the Automaker's New Cash CowFord Motor Company is making a significant leap into the high-margin world of software-as-a-service with the rollout of a new, sophisticated AI assistant designed specifically for its commercial customers. Unveiled this week at the Work Truck Week conference in Indianapolis, the Ford Pro AI assistant is now available to all U.S.-based subscribers of the company's Ford Pro telematics service. This move underscores a broader industry-wide bet—shared by most major automakers—that the future of profitability lies not just in manufacturing vehicles, but in the recurring revenue generated by software and data-driven services.
Beyond the Chatbot: Actionable Intelligence for Fleet Managers
Ford is keen to distinguish this new tool from the generic chatbots that have become ubiquitous in the tech world. The company emphasizes that Ford Pro AI is a proprietary, purpose-built system designed to ingest and analyze millions of telemetry data points, transforming raw information into actionable business intelligence. Instead of simply relaying a cryptic diagnostic error code, the AI provides fleet managers with clear, contextual insights about their vehicles.
For instance, the system can monitor and report on critical safety metrics like seatbelt usage across an entire fleet, helping owners enforce safety protocols and reduce liability. It goes far beyond safety, offering detailed analytics on fuel consumption to optimize routes and reduce costs, providing real-time updates on vehicle health to prevent breakdowns, and aggregating driver behavior data such as idle times, instances of speeding, and hard acceleration events. This comprehensive view allows commercial customers to improve efficiency, reduce wear and tear, and ultimately boost their bottom line.
The technology is built on Google's Cloud infrastructure and utilizes a network of specialized AI agents. According to Ford, the "secret sauce" that prevents the common problem of AI hallucinations—where the model generates incorrect or nonsensical information—is its deep integration with each customer's proprietary fleet data. By grounding the AI in specific, internal datasets, the insights it generates are highly accurate and relevant to that particular business's operations.
The Strategic Importance of Ford Pro
The launch of this AI assistant is a direct effort to add value for the customers of Ford Pro, a business division that has become a financial powerhouse for the automaker. Ford Pro encompasses the sale of Super Duty trucks and other commercial vehicles to businesses, government entities, and rental fleets. In 2025 alone, the division generated a staggering $66.3 billion in revenue and reported a net income of $6.8 billion, making it a critical pillar of the company's profitability.
The AI tool is included in the existing subscription for Ford Pro's telematics customers. While Ford does not disclose the exact number of U.S. subscribers, it has confirmed having more than 840,000 subscribers globally. The move to embed AI into the service is a strategic play to not only retain these customers but also to drive further growth in its high-margin software business. The strategy appears to be working; the company reported that paid software subscriptions for Ford Pro grew by an impressive 30% in 2025.
Expanding the AI Footprint to Consumer Vehicles
The commercial sector is just the first beachhead for Ford's AI ambitions. The company announced earlier this year at the CES 2026 tech show that it is concurrently developing a similar AI assistant tailored for owners of its passenger cars and trucks. This consumer-facing AI is slated to debut within Ford's smartphone app before being integrated directly into the vehicle's infotainment system in 2027. This dual-pronged approach signals that Ford views AI not as a one-off feature, but as a foundational layer of the future driving experience for all its customers.
The Human Cost of the AI Revolution
Even as Ford rolls out these advanced tools to enhance its customer offerings, the company's leadership has been remarkably transparent about the disruptive impact this technology will have on its own workforce. This forward march of automation carries a significant human cost. Last year, CEO Jim Farley made a striking prediction, stating that AI would eventually cut the number of white-collar jobs at the company in half. In a more recent statement from January, Farley elaborated on this vision, emphasizing that while AI will displace certain roles, it also creates a critical need for "essential workers" to build and support the physical and digital infrastructure required to achieve what he termed the company's "AI moonshot goals." This duality—creating new value for customers and new efficiencies for the business, while simultaneously rendering certain jobs obsolete—encapsulates the transformative and often painful nature of the technological revolution sweeping through the automotive industry.
$F — Trendline Break, odds increase that price rotates back $F — Trendline Break
The trendline of Ford Motors has now broken.
When a trendline fails, odds increase that price rotates back toward the midpoint of the prior structure — often transitioning from trend into range.
That suggests we may be moving into a broader trading range rather than immediate continuation.
Ford Motor CompanyFord Motor Company: Quality-Driven Turnaround Fuels Record Bonus Payouts Amidst Operational Headwinds
Ford Motor Company is executing a strategic pivot centered on product quality and operational excellence, yielding tangible financial rewards for its salaried workforce even as the broader business contends with significant near-term headwinds. CEO Jim Farley, during a global town hall on February 11, revealed that the company's 2025 performance against key corporate metrics has triggered a 130% bonus multiplier for eligible salaried employees—the highest payout factor in several years and a dramatic improvement from the 69% multiplier recorded for 2024 and 84% for 2023.
This announcement carries profound significance, not merely as a human resources matter, but as a transparent, quantifiable signal that Ford's multi-year campaign to rehabilitate its quality reputation is gaining measurable traction.
The Bonus Mechanics: Transparency and Accountability
Ford's global salaried workforce of approximately 75,000 employees participates in a bonus program calibrated to a transparent, metric-driven scorecard. Each year, the company establishes specific performance targets across several domains:
Adjusted Earnings Before Interest and Taxes (EBIT)
Vehicle Initial Quality Improvement
Global Electric Vehicle Sales
Connected Services Revenue
If Ford meets these targets, the bonus multiplier settles at 100%. Exceeding targets drives the multiplier above 100%; falling short results in a reduction. The 130% multiplier for 2025 thus represents a clear, unambiguous signal that management believes the organization has not merely met but substantially exceeded its strategic objectives.
Spokesman David Tovar explicitly identified initial quality improvement as the single largest contributor to this outperformance:
"The quality metric was one of the biggest factors in achieving it because it's initial quality. We've been saying our initial quality scores have been improving."
The Quality Turnaround: From Recall Leader to Segment Winner
Ford's quality narrative has undergone a pronounced transformation over the past eighteen months. The company set an industry record in 2025 with 153 recalls, a statistic that, viewed in isolation, suggests persistent quality control challenges. However, as Farley articulated to the Detroit Free Press in October 2025, recalls predominantly affect vehicles already on the road—often representing legacy issues or proactive campaigns on aging platforms. The more forward-looking metric, in his view, is initial quality: the customer's experience during the first 90 days of ownership.
By this measure, Ford's progress is demonstrable and accelerating. The J.D. Power 2025 U.S. Initial Quality Study recognized four Ford nameplates—F-150, F-Series Super Duty, Mustang, and Escape—as best-in-segment for initial quality. This represents a material achievement in an industry where customer satisfaction and warranty expense are directly correlated with early ownership experiences.
Complementing this external validation, CFO Sherry House disclosed to reporters on February 10 that Ford recorded zero production losses due to defects during its 2025 vehicle launch cadence. For a manufacturer that has historically struggled with launch execution, this milestone signals that process discipline and engineering rigor are taking root across the organization.
CEO Compensation: Performance-Aligned Accountability
Farley himself stands to benefit substantially from this quality-driven turnaround. His compensation package is heavily weighted toward performance metrics established by Ford's board of directors, with quality improvement featuring prominently. In 2024, Farley's total compensation declined to $25 million from $27 million in 2023, a reduction directly attributable to missed quality goals.
Ford will disclose Farley's 2025 compensation in a regulatory filing scheduled for March, concurrent with the bonus payout cycle. Based on the disclosed 130% multiplier and the company's broader performance trajectory, a significant year-over-year increase appears probable.
The Contrast: Salaried Bonuses Versus UAW Profit-Sharing
Ford's bonus announcement creates an instructive contrast with the profit-sharing checks payable to its unionized hourly workforce. On March 12, approximately 56,300 active UAW-represented employees and 1,490 retirees will receive profit-sharing distributions of up to $6,780—a steep decline from the $10,208 paid for 2024 results.
This divergence is structural, not discretionary. UAW profit-sharing is formulaically determined by the union's national agreement: qualified employees receive $1,000 per every $1 billion in annual North American pre-tax profit. Ford's North America EBIT declined to $6.78 billion in 2025 from $10.2 billion in 2024, driven by two discrete but powerful headwinds:
Supply Chain Disruption: A fire at a critical aluminum supplier in New York disrupted production of Ford's most profitable full-size pickups and SUVs, directly impairing both volume and margin.
Tariff Costs: The company absorbed approximately $2 billion in incremental costs attributable to tariffs imposed by the Trump administration.
These pressures, while severe, are viewed by management as transitory rather than structural. The quality-driven improvement in bonus multipliers suggests confidence that the underlying business is strengthening even as external headwinds temporarily suppress reported profitability.
Industry Context: GM's Parallel Compression
Ford's compensation dynamics are not occurring in isolation. Cross-town rival General Motors reported its fourth-quarter and full-year 2025 results in January, revealing a similarly challenging profit environment. Eligible GM UAW workers are projected to receive profit-sharing checks of approximately $10,500—the lowest in years—while the company's salaried workforce faces dramatic bonus compression, with the corporate multiplier sliding to 114% from 144% in the prior year.
This parallel compression underscores that the tariff and supply chain disruptions affecting Ford are industry-wide phenomena. However, Ford's ability to deliver a 130% salaried bonus multiplier—significantly above target—while reporting diminished EBIT suggests that its internal performance metrics, particularly quality, are improving independently of the external profit environment.
Technical Framework: Price Levels and Strategic Positioning
For investors monitoring Ford's equity, the technical landscape provides defined parameters for risk management and profit-taking:
Target Zones:
$15.00 – Primary near-term resistance and logical initial profit-taking level.
$15.50 – Secondary target representing a re-test of prior consolidation highs.
$16.00 – Extended target zone that would signal full recovery of the post-earnings drawdown and validation of the quality-driven investment thesis.
Support Zones (Fibonacci Retracement Levels):
$13.07 – Corresponding to the 0.236 Fibonacci retracement. A hold above this level would indicate healthy pullback dynamics within a constructive uptrend.
$12.19 – Aligning with the 0.382 Fibonacci retracement. This zone represents a more significant correction but would remain within normal technical parameters.
$11.47 – The 0.5 Fibonacci retracement level. A pullback to this zone would represent a deeper retracement but could offer a compelling risk-reward entry point for long-term investors.
Conclusion: A Turnaround Measured in Quality, Not Just Profit
Ford's 130% bonus multiplier is more than a payroll line item; it is a quantifiable, externally validated signal that the company's multi-year quality transformation is producing measurable results. While near-term profitability remains suppressed by transitory supply chain and tariff pressures, the improvement in initial quality, launch execution, and customer satisfaction metrics suggests a more durable, structurally improved business is emerging.
For investors, the path forward requires distinguishing between cyclical profit headwinds and structural quality tailwinds. The former will recover as aluminum supply normalizes and trade policy stabilizes; the latter, once embedded in organizational culture and customer perception, tends to persist and compound. Ford's compensation disclosures—both the salaried bonus multiplier and Farley's forthcoming 2025 pay package—offer rare, high-fidelity visibility into this transition.
The defined technical levels provide a disciplined framework for position management. A sustained hold above the $13.07 support zone would reinforce the constructive thesis; a move through the $15.00-$16.00 target zone would validate that the market is beginning to price Ford not merely as a cyclical industrial recovery story, but as a structurally improved franchise with durable competitive advantages in quality and customer satisfaction.
Ford (F) — Trend Channel Still in ControlHello Everyone, followers,
Ford is the last one from my side for this week.
Let's drill down:
📊 Technical Overview
Ford continues to trade inside a well-defined ascending channel.
Price is holding above key moving averages, showing stability despite recent consolidation.
Earnings are scheduled for February 10, which could act as a catalyst.
🔹 Key Levels
Support
13.60–13.65 → Channel mid-support
13.15–13.20 → Trend support
12.60 - 12.70 → Major support
Resistance / Targets
14.00–14.05 → Range resistance
14.40–14.50 → 0.618 Fib
14.95–15.00 → Upper channel resistance
🔮 Outlook
The structure remains constructive as long as price stays inside the channel.
🎯 What I Expect
A controlled grind higher toward channel resistance is my base case, unless earnings introduce a volatility break.
If you enjoy and like clean, simple analysis — follow me for more.
This is just my thinking and it is not invesment suggestion , please do not make any decision with my anaylsis.
Have a lovely Sunday to all and hopefully green trade day for next Week.
#SPX500 #NASDAQ #F #Trendanalysis
Going for a drive with F -- long at 13.81Ford has been in a strong uptrend really since the beginning of 2025. Until it proves me wrong, I have to respect that. Add in 5 consecutive down days and my signals screaming BUY at me for the last 2 days, and I just can't resist.
Ford has paid me much better than you'd expect from a cyclical stock over the last year and shows no signs of slowing down as of now, trading well above its trend line. It's also paying around a 4% dividend here, so if there's a market meltdown and I have to hold it a while, I get paid a little to do so. My goal is to be out within a week though, with a better than market average daily return.
As always - this is intended as "edutainment" and my perspective on what I am or would be doing, not a recommendation for you to buy or sell. Act accordingly and invest at your own risk. DYOR and only make investments that make good financial sense for you in your current situation.
$F - Ford Motor Company's (NYSE: F) Based on a confluence of recent bullish catalysts, including a significant analyst upgrade and strong fundamental performance, Ford Motor Company's (NYSE: F) stock has broken out to a new 52-week high. This move signals a potential shift in market sentiment and establishes clear technical and fundamental parameters for the investment thesis, with a defined profit-taking target at $15.00 per share.
Fundamental Rationale for the Upside Target:
The $15.00 target is supported by a multi-faceted array of positive developments:
Analyst Conviction and Re-rating: The upgrade from Piper Sandler to "Overweight" and the dramatic price target increase to $16.00 (from $11.00) is a primary driver. This reflects a major institutional reassessment of Ford's growth trajectory, profitability, and execution under its "power of choice" strategy. The subsequent price target raise by Evercore ISI to $14 further reinforces this trend of upward revisions.
Demonstrated Operational Strength: Ford's recent financial performance provides a solid foundation for the re-rating. The company has consistently exceeded earnings and revenue expectations, as seen in its Q3 2025 report, showcasing improving operating margins (up to 3.1%) and robust free cash flow generation (10.4% margin). The full-year 2025 sales increase of 6% and market share gain to 13.2% demonstrate competitive strength.
Product Leadership and Strategic Execution: Ford's core franchises are not merely stable but are growing. The F-Series' 49-year truck leadership and record hybrid sales (up 21.7% to 228,072 units) prove the company is successfully navigating the market transition. Strong SUV sales (Explorer, Bronco) and growth in high-margin software services (Ford Pro subscriptions up 30%) highlight a diversified path to profitability beyond vehicle sales alone.
Future Growth Catalysts: The roadmap for 2026 and 2027, including new vehicle launches (Explorer Tremor, F-150 Lobo) and the planned midsize electric pickup, coupled with advanced investments like the "eyes-off" self-driving system, provide tangible future growth narratives that support a higher valuation.
Technical and Market Context:
The stock's 4.8% surge on the upgrade news, a significant move for a typically low-volatility stock, indicates the market views this as a meaningful inflection point. Breaking through previous resistance to set a new 52-week high near $14.38 suggests a breakout from prior trading ranges. The $15.00 profit target represents the next logical psychological and technical resistance level following this confirmed breakout. Achieving this price would validate the renewed institutional confidence and likely attract further momentum.
Risk Management Considerations:
While the outlook is positive, investors should consider that the automotive sector remains cyclical and competitive. The profit-taking level at $15.00 also serves as a benchmark to evaluate ongoing momentum. A failure to approach or sustain levels near this target amidst generally positive market conditions could signal that the positive news is fully priced in or that execution challenges are emerging.
Conclusion:
In summary, Ford's stock is being propelled by a powerful combination of upward analyst revisions, proven financial and sales execution, and a clear product-led growth strategy. The profit-taking target of $15.00 is a strategically identified level that aligns with the next round-number resistance following a confirmed technical breakout. Reaching this target would represent a materialization of the current bullish thesis, rewarding investors who recognized the company's operational turnaround and strategic repositioning in the evolving automotive landscape.
TIME to sell fordbearish divergence
stop buying
nvestors typically sell a stock instead of buying when they anticipate its value will decrease, often due to technical signals (like breaking a support level on a chart), fundamental reasons (company performance decline), or to manage risk and protect capital
F | Possible 3 Year Long Consolidation Over | LONGFord Motor Co. engages in the manufacture, distribution, and sale of automobiles. It operates through the following segments: Ford Blue, Ford Model E, Ford Pro, Ford Next, Ford Credit, and Corporate Other. The Ford Blue, Ford Model E, and Ford Pro segment includes the sale of Ford and Lincoln vehicles, service parts, and accessories, together with the associated costs to develop, manufacture, distribute, and service the vehicles, parts, and accessories. The Ford Next segment is involved in the expenses and investments for emerging business initiatives aimed at creating value for Ford in vehicle-adjacent market segments. The Ford Credit segment consists of the Ford Credit business on a consolidated basis, which is primarily vehicle-related financing and leasing activities. The Corporate Other segment refers to corporate governance expenses, past service pension and OPEB income and expense, interest income and gains and losses from cash, cash equivalents, and marketable securities, and foreign exchange derivatives gains, and losses associated with intercompany lending. The company was founded by Henry Ford on June 16, 1903 and is headquartered in Dearborn, MI.