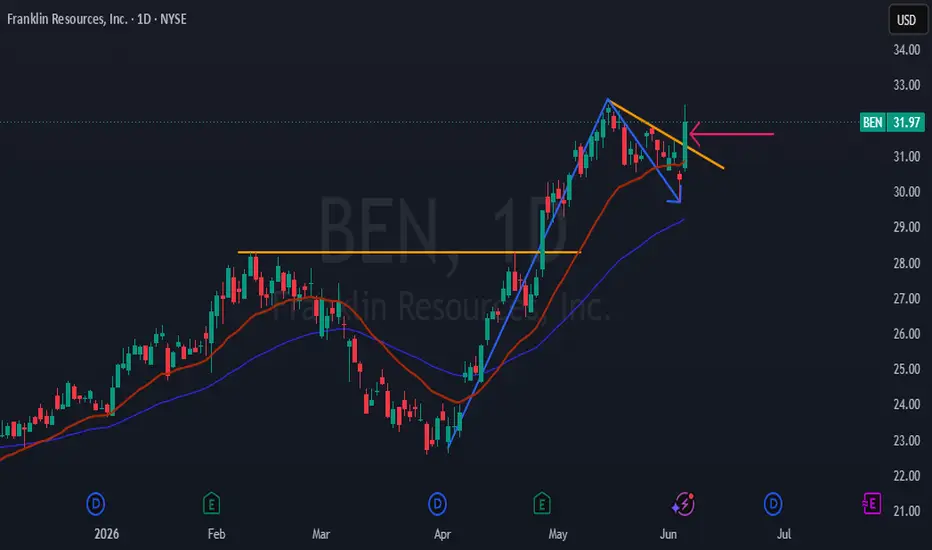
Franklin Resources Inc. (BEN) — Buy SetupFranklin Resources Inc. (NYSE: BEN) is presenting a constructive bullish setup, with the current technical structure supporting a buy-side trade idea. Buyers are gradually gaining control, while the broader structure continues to favor an upside move toward the identified target zones.
The setup is
Compare with Franklin Templeton, Inc.
1.47 USD
471.70 M USD
8.73 B USD
274.04 M
Next report date
—
Report period
—
EPS estimate
—
Revenue estimate
—
Company info
Sector
Industry
CEO
Jennifer M. Johnson
Website
Headquarters
San Mateo
Founded
1947
IPO date
Dec 5, 1986
ISIN
US3546131018
CUSIP
354613101
FIGI
BBG000BD0TF8
Identifiers
ISIN US3546131018
Franklin Templeton, Inc. is a holding company, which engages in the provision of investment management and related services. The firm offers services and products under various distinct brand names, including, but not limited to, Franklin, Templeton, Legg Mason, Benefit Street Partners, Brandywine Global Investment Management, Clarion Partners, ClearBridge Investments, Fiduciary Trust Company International, Franklin Mutual Series, K2 Advisors, Lexington Partners, Putnam Investments, Alcentra, Royce Investment Partners and Western Asset Management Company. It provides investment management and related services to retail, institutional and high-net-worth investors in jurisdictions worldwide. The company was founded by Rupert H. Johnson, Sr. in 1947 and is headquartered in San Mateo, CA.
Franklin Resources Pullback Signals Potential Buying OpportunityFranklin Resources (BEN) is attracting buying interest after retracing to its 20- and 50-day moving averages, presenting a potential entry opportunity. The stock remains in a well-established uptrend, continuing to make higher highs and higher lows while trading above well-aligned 20- and 50-day mov
BEN - Resistance Break and 50 SMA Support Retest💡 Swing setup idea
50 SMA support retest
🔎 Analysis summary:
The stock broke above resistance and came back to retest the 50 SMA as support. Buyers are also starting to step in, which keeps this setup constructive.
👀 Levels to watch:
Entry trigger: Break above $32.35
Target: $34.92
Stop: Und
Franklin Resources Attracts Buyers as Uptrend Remains IntactBEN is attracting buying interest following a recent retracement, with the stock continuing to exhibit a constructive technical setup. Shares remain in a well-defined uptrend, characterized by higher highs and higher lows, while trading above both the 20-day and 50-day moving averages, signaling sus
Strengthening Consolidation phaseBen broke through its bearish trend and is consolidating just below the local volume area high which lines up with the last bullish volume area low.
If Ben can reclaim 29.32 I see a path to 42.50.... if we reject we might see a full rotation of the value area at 19.39 and a potential retest of the b
BEN Stock Going UP, Confirmed Monday 6/30/25Hello,
Ayrfolio trade ideas are based on weekly charts and momentum, so remember to be patient! No day trades here unless the stock soars up intraday. Today we’re covering:
COMPANY: Franklin Resources, Inc.
STOCK SYMBOL: BEN
POSITION: Long
TP1 Risk-Reward Ratio: 2.26
TP2 Risk-Reward Ratio: 4.52
BEN attacking major resistance area, jumps over 30d MABEN (Franklin Resources) in early trading today has jumped over its 30 day SMA, for the first time since late March. A 3.5% rise in the stock also bring it to a major resistance zone between 23.30 and 23.85. Currently trading slightly below at 23.22, but with a lot of momentum, it is possible we'll
Franklin Resources, Inc. Posts Weak Q2 ResultsFranklin Resources, Inc. (NYSE: NYSE:BEN ) unveils its second-quarter financial performance, showcasing resilience and strategic prowess amidst evolving market dynamics. With a nuanced approach to financial management and a focus on innovation, the company navigates challenges while charting a path
See all ideas
Summarizing what the indicators are suggesting.
Neutral
SellBuy
Strong sellStrong buy
Strong sellSellNeutralBuyStrong buy
Neutral
SellBuy
Strong sellStrong buy
Strong sellSellNeutralBuyStrong buy
Neutral
SellBuy
Strong sellStrong buy
Strong sellSellNeutralBuyStrong buy
An aggregate view of professional's ratings.
Neutral
SellBuy
Strong sellStrong buy
Strong sellSellNeutralBuyStrong buy
Neutral
SellBuy
Strong sellStrong buy
Strong sellSellNeutralBuyStrong buy
Neutral
SellBuy
Strong sellStrong buy
Strong sellSellNeutralBuyStrong buy
Displays a symbol's price movements over previous years to identify recurring trends.
Maturity dateAug 12, 2051
Coupon2.95% (Fixed)
Maturity dateJan 15, 2044
Coupon5.63% (Fixed)
Maturity dateAug 10, 2036
Coupon5.50% (Fixed)
Maturity dateOct 30, 2030
Coupon1.60% (Fixed)
See all BEN bonds
Frequently asked questions
The current price of BEN is 34.73 USD — it has increased by 3.52% in the past 24 hours. Watch Franklin Templeton, Inc. stock price performance more closely on the chart.
Depending on the exchange, the stock ticker may vary. For instance, on NYSE exchange Franklin Templeton, Inc. stocks are traded under the ticker BEN.
BEN stock has fallen by −0.43% compared to the previous week, the month change is a −3.53% fall, over the last year Franklin Templeton, Inc. has showed a 35.35% increase.
We've gathered analysts' opinions on Franklin Templeton, Inc. future price: according to them, BEN price has a max estimate of 41.00 USD and a min estimate of 26.00 USD. Watch BEN chart and read a more detailed Franklin Templeton, Inc. stock forecast: see what analysts think of Franklin Templeton, Inc. and suggest that you do with its stocks.
BEN stock is 5.00% volatile and has beta coefficient of 1.20. Track Franklin Templeton, Inc. stock price on the chart and check out the list of the most volatile stocks — is Franklin Templeton, Inc. there?
Today Franklin Templeton, Inc. has the market capitalization of 17.65 B, it has decreased by −5.46% over the last week.
Yes, you can track Franklin Templeton, Inc. financials in yearly and quarterly reports right on TradingView.
Franklin Templeton, Inc. is going to release the next earnings report on Nov 3, 2026. Keep track of upcoming events with our Earnings Calendar.
BEN earnings for the last quarter are 0.72 USD per share, whereas the estimation was 0.66 USD resulting in a 9.35% surprise. The estimated earnings for the next quarter are 0.75 USD per share. See more details about Franklin Templeton, Inc. earnings.
Franklin Templeton, Inc. revenue for the last quarter amounts to 1.82 B USD, despite the estimated figure of 1.76 B USD. In the next quarter, revenue is expected to reach 1.85 B USD.
BEN net income for the last quarter is 160.40 M USD, while the quarter before that showed 251.90 M USD of net income which accounts for 0.00% change. Track more Franklin Templeton, Inc. financial stats to get the full picture.
Yes, BEN dividends are paid quarterly. The last dividend per share was 0.33 USD. As of today, Dividend Yield (TTM)% is 3.77%. Tracking Franklin Templeton, Inc. dividends might help you take more informed decisions.
Franklin Templeton, Inc. dividend yield was 5.53% in 2025, and payout ratio reached 140.40%. The year before the numbers were 6.15% and 146.40% correspondingly. See high-dividend stocks and find more opportunities for your portfolio.
As of Sep 6, 2026, the company has 9.8 K employees. See our rating of the largest employees — is Franklin Templeton, Inc. on this list?
EBITDA measures a company's operating performance, its growth signifies an improvement in the efficiency of a company. Franklin Templeton, Inc. EBITDA is 1.79 B USD, and current EBITDA margin is 19.05%. See more stats in Franklin Templeton, Inc. financial statements.
Like other stocks, BEN shares are traded on stock exchanges, e.g. Nasdaq, Nyse, Euronext, and the easiest way to buy them is through an online stock broker. To do this, you need to open an account and follow a broker's procedures, then start trading. You can trade Franklin Templeton, Inc. stock right from TradingView charts — choose your broker and connect to your account.
Investing in stocks requires a comprehensive research: you should carefully study all the available data, e.g. company's financials, related news, and its technical analysis. So Franklin Templeton, Inc. technincal analysis shows the buy rating today, and its 1 week rating is buy. Since market conditions are prone to changes, it's worth looking a bit further into the future — according to the 1 month rating Franklin Templeton, Inc. stock shows the buy signal. See more of Franklin Templeton, Inc. technicals for a more comprehensive analysis.