WIPRO – Long-Term Channel Support Bounce?Wipro Limited is currently approaching an important zone within a long-term rising price channel on the monthly timeframe. The broader chart structure continues to show a long-term upward trajectory, with the lower boundary of the channel acting as a significant historical support area.
The recent corrective movement has brought the price closer to this rising support zone. If the channel structure continues to remain valid and buyers defend this region, the stock could witness a potential upside movement in the coming months.
The projected path on the chart represents only a possible technical scenario. Price may experience volatility, consolidation, or further corrections before any meaningful directional move develops.
Technical View
Long-term rising channel remains the primary structure.
Price is approaching the lower boundary/support region of the channel.
Historical channel support could become an important area to watch.
A successful hold and reversal from this zone may open the possibility of an upside move.
This is strictly a long-term chart-pattern observation, not a short-term trading call.
About the Company
Wipro Limited is a global AI-powered technology services and consulting company. Its business spans technology consulting, cloud and infrastructure services, cybersecurity, engineering, data and analytics, application development, business process services, and AI-led digital transformation solutions. The company also operates an IT Products segment offering third-party computing, storage, networking, security and software products.
Disclaimer
This analysis is based solely on long-term technical chart patterns and price structure. It does not consider fundamentals, financial results, valuations, news, corporate developments, or macroeconomic factors. The projected movement is only a possible scenario and is not guaranteed. Markets involve risk, and price can move in either direction. This is not investment advice or a recommendation to buy or sell any security. Please conduct your own research before making investment decisions.
Wipro Limited
No trades
No trades
In-depth trading ideas
WIPRO – STOCK OF BULLISHNESS Wipro is showing a positive structure with strong support near ₹175–₹176.
Key Support Zone: ₹170–₹175
Breakout Level: ₹183
Upside Targets:
Target 1: ₹196
Target 2: ₹205
View: As long as the stock sustains above the ₹175–₹176 support zone, the bullish setup remains intact. A decisive breakout above ₹183 can trigger the next momentum leg towards ₹196 and ₹205.
Confirmation above ₹183 is important before expecting the full upside move.
Thank you .
WIPRO Bullish Setup | Breakout Watch WIPRO UPDATE | Channel Breakout Setup
Key Breakout Level: 181
A sustained breakout above 181 can confirm fresh bullish momentum.
Upside Targets:
183 (Initial Retest Zone)
187
190 (Channel Pattern Target)
Major Support Zone: 170 – 172
Market View: The bullish structure remains intact as long as the stock holds above the 170–172 support zone. A decisive breakout above 181 can accelerate the move towards the next resistance levels.
WIPRO | BTR Swing Trading Analysis | 23 Jun 2026📉 Trend Structure Turning Bearish
Wipro recently generated a fresh BTR SELL Signal after failing to sustain above the short-term bullish trend structure. The stock attempted multiple recoveries, but each rally faced selling pressure, indicating weakening momentum.
The latest sell signal emerged near the resistance zone, followed by a sharp decline toward the first projected target area.
BTR Swing Framework
🔴 Latest SELL Signal Activated
❌ Potential SL: ₹182.40
🎯 Potential T-1: ₹175.37 (Being Tested)
🎯 Potential T-2: ₹171.86
🎯 Potential T-3: ₹168.35
Price Action Observations
• Multiple trend reversals can be seen during June.
• Previous BUY signals captured short-term recoveries.
• Recent SELL signal indicates a possible continuation of the broader corrective phase.
• Price is currently trading around the T-1 zone.
• Sustained weakness below T-1 may open the path toward T-2 and T-3 levels.
Swing Trading View
📌 Immediate resistance remains near the recent sell signal area.
📌 Bears remain in control while price trades below ₹182.40.
📌 T-1 is acting as the first decision zone.
📌 A breakdown below T-1 may increase downside momentum toward T-2 and T-3.
📌 Traders should monitor price behavior around support zones rather than predicting future movement.
Educational Insight
Strong trends often move through three phases:
➡️ Trend Formation
➡️ Pullback & Retest
➡️ Trend Continuation
The recent structure in Wipro highlights how a failed recovery near resistance can sometimes lead to renewed selling pressure and continuation of the prevailing trend.
⚠️ This chart reflects a technical market structure analysis for educational purposes only. Markets are uncertain, and no target or level is guaranteed to be achieved.
#WIPRO #SwingTrading #PriceAction #TechnicalAnalysis #StockMarketIndia #NSE #MarketStructure #TrendFollowing #RiskManagement #TradingViewIndia #BKQuantDesk
Wipro Analysis | Trading in Discount Zone📊 Wipro Analysis | Trading in Discount Zone
Wipro is currently trading in a weak structure and positioned inside a key demand/liquidity zone after a sustained downtrend.
📌 Key Observations:
• Price is in a discount zone (lower range)
• Equal lows formed — liquidity resting below
• Gap Imbalance (FVG) present near current levels
• Strong downside move already completed
📊 Possible Scenarios:
🔻 Scenario 1 (Liquidity Sweep First):
Price may sweep the equal lows and tap into the liquidity zone (around 184–178), potentially filling imbalance before any reaction.
🔺 Scenario 2 (Immediate Reaction):
If current levels hold, price may show a short-term bounce from demand and attempt to fill upside imbalance.
🧠 Technical Confluence:
• Equal low liquidity
• Imbalance zone acting as magnet
• Discount pricing (value area)
⚠️ Disclaimer:
This analysis is for educational purposes only and not financial advice. Market behavior depends on multiple factors—always use proper risk management.
👉 Focus on reaction, not prediction.
#Wipro #StockMarket #PriceAction #FVG #Liquidity #NiftyKing
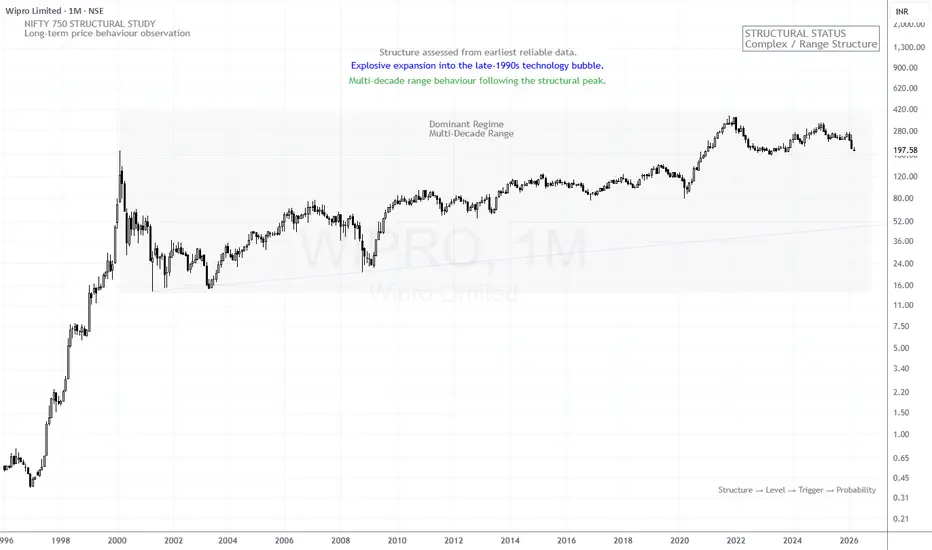
NSE – NIFTY 750 | Wipro Limited | Structural CensusWipro experienced an explosive expansion during the late-1990s technology boom.
Following the peak around 2000, the stock transitioned into a prolonged structural consolidation characterised by repeated cyclical swings rather than sustained trend expansion.
The long-term structure can therefore be interpreted as a Complex / Range Structure, where price oscillates within a broad multi-decade range.
Part of the ongoing NIFTY 750 Structural Census.
Structure → Level → Trigger → Probability
#NF750Census #MarketStructure #StructuralAnalysis
Wipro Near Historic Support – Cup & Handle or Breakdown?On the weekly chart, Wipro looks like it formed a rounded base near 176 . This acts like the “cup” part of a possible cup-and-handle structure.
The drop from 324.60 has formed a declining neckline, with price currently moving inside a falling channel that resembles a handle-like structure.
Current Structure
(A) formed at 228
(B) formed at 273.10
(C) is now projecting near 176
The 100% extension of (A) from (B) comes exactly near 176 — which is also the cup base. This makes 176 a key reaction zone .
What to Watch
176 is the crucial support
RSI is nearing oversold on weekly
No confirmed bullish reversal pattern yet
Price still inside a falling channel
If price shows a strong bullish reversal near 176, we may see a technical bounce.
However, if 176 breaks decisively , then deeper levels like 150 or even 116 cannot be ruled out.
For now, any bounce may be treated as a selling opportunity unless clear trend reversal signals appear.
Structure confirmation is still pending.
Disclaimer: This analysis is for educational purposes only and does not constitute investment advice. Please do your own research (DYOR) before making any trading decisions.
WIPRO | Gann Square of 9 – 45° Support Case Study | 28 Mar 2022This idea presents a historical intraday example of how the Gann Square of 9 can be used to identify logical support levels based on price–degree relationships.
On 28 March 2022, WIPRO Ltd initiated a downward move after forming its 0° reference point near ₹609.
📐 Gann Degree Structure
0° level: 609
45° level: 597
Using the Square of 9 calculations, ₹597 emerged as the next geometric downside level.
⏱️ Price–Time Alignment (Gann Guideline)
According to classical Gann intraday observations:
Support reactions often appear when
45° is reached before 2:30 PM, or
90° is reached before 2:45 PM
In this session, price completed the 45° move within the valid time window, and a clear upward reaction followed from the ₹597 zone.
🧠 Key Learning
This case study demonstrates that:
Degree completion helps define objective support
Reversals occur from measured levels, not guesswork
Gann geometry converts price action into structured behavior
📌 Conclusion
The Gann Square of 9 offers a rule-based method to identify intraday support and resistance.
When price respects degree levels within time, reactions often become clearer and more reliable.
Disclaimer:
This chart is shared strictly for educational and analytical purposes only. It does not constitute trading or investment advice.
Wipro: A Classic Cup and Handle poised to deliver 20%NSE:WIPRO
On Higher Time Frames (W/M) its quite evident pattern - Cup and Handle.
Using chart structure and pivots, a reasonable trade setup exists.
CMP 267
Entry: 265-267
SL: 257
TGT - 20%
Its a positional trade. This will offer many churning opportunities in between. Trade prudently using SMC and Camarilla Pivots.
Wipro limited Buy 253-255
SL 250
Target 270-285
If you find this helpful and want more FREE forecasts in TradingView, Hit the 'BOOST' button
Drop some feedback in the comments below! (e.g., What did you find most useful?
How can we improve?)
Your support is appreciated!
Now, it's your turn!
Be sure to leave a comment; let us know how you see this opportunity and forecast.
Have a successful week
DISCLAIMER: I am NOT a SEBI registered advisor or a financial adviser. All the views are for educational purpose only
Wipro: Breakout & Boom!This is the daily timeframe chart of Wipro.
Wipro has been forming a falling wedge pattern, and the stock has given a breakout near the ₹250 level.
The breakout has also occurred above the long-term support zone of ₹225–₹240, which strengthens the bullish structure.
If this momentum continues, then any dips from the current levels may offer strong risk-reward opportunities and potentially lead to a bigger rally.
In the shorter timeframe, the potential upside target for Wipro stands near the ₹280 level..
Thank you.