In-depth trading ideas
TVSMOTOR (D) CHARTFriends, the market forms a structure; when that structure breaks, it is called a "Break of Structure" (BOS), and the market moves in a new direction. When it breaks or shifts its movement, it is termed a "Change of Character" (CHoCH)—meaning it alters its nature and begins moving in the opposite direction.
Whenever this structure breaks, a trade plan emerges for you; try to understand this.
Often, immediately after the structure breaks (when the price moves above the previous high), it drops sharply; you can view this movement as a "Liquidity Sweep." Then, it falls again and attempts to break that same structure once more; sometimes, a large candle breaks that level and drives the market upward, and subsequently, the price returns to retest the area around that candle.
This serves as an excellent zone for a trade, as a tight stop-loss allows you to increase your position size. However, if the candle is very large, you should reduce your quantity; otherwise, significant market volatility—whether upward or downward—could lead to heavy losses. Pay close attention to the high or low of the candle that caused the break. Mark these levels and wait for the market to return to them. Plan your trade only when the market touches that zone and reacts to it.
Remember, the time frame is crucial. Whether you are using a 15-minute, 1-hour, 4-hour, or daily chart, you should base your plan on the structure visible within that specific time frame; otherwise, you may face difficulties.
Keep in mind that risk management is even more important than your win rate; it is the tool that safeguards your capital.
TVSMOTORTechnical Note: Let the market come to your zones and show its hand. Trade safe and manage your risk! Always wait for your own confirmations before entering the market.
Risk Disclaimer: This analysis is for educational purposes only and does not constitute financial advice. Always practice proper risk and position sizing. The market is supreme; no one can make a 100% accurate prediction.Stop Loss Must if you want to be a profitable Trader.
MARKET VIEW:-
Current Bias: BULLISH
Preferred Strategy: – SELL ON RISE .... Wait for Confirmation
TVSMOTOR: 1H Descending Channel Breakout past 61.8% Fib 📊 TVS Motor Company Limited (TVSMOTOR) - 1-Hour (1H) Chart Analysis
This post is shared for EDUCATIONAL PURPOSES ONLY to analyze short-term parallel channel breakouts, Fibonacci structural confluences, and moving average transitions. It is not financial or investment advice.
🎯 Educational Swing Setup:
• Entry Zone: 3,590.00 – 3,622.00 (Sizing into position blocks within this breakout environment or accumulating on minor hourly retests of the 3,600 EMA support zone).
• Target 1: 3,651.50
• Target 2: 3,680
• Target 3: 3,720
• Invalidation / Stop-Loss: 3,540.00 (An hourly candle close back below the pink long-term moving average baseline completely invalidates this breakout continuation structure).
• Expected Duration: 4 to 10 Trading Days (Short-term hourly swing view)
⚠️ Risk Management:
Since the price is actively grinding against the 61.80% Fibonacci barrier, watch for a clean volume continuation spike to validate institutional backing on the breakout extension. Maintain disciplined position sizing!
TVS Motors cmp 3608.40 Daily ChartTVS Motors cmp 3608.40 Daily Chart
- Support Zone 3425 to 3570 Price Band
- Resistance Zone 3650 to 3800 Price Band
- Support Zone seems to be tested retested
- Rounding Bottom near Resistance Zone neckline
- Resistance Zone & Trendline Breakout attempted
- Volumes needed for fresh price momentum uptrend
NSE – NIFTY 750 | TVS Motor | 14 Mar 2026TVS Motor illustrates a Sustained Impulsive Structure.
Following the structural low around the 2008–2009 financial crisis period, the stock entered a long-term expansion phase. Over the past decade, price has continued to advance with periodic cyclical consolidations.
The broader structural regime remains upward, with recent price behaviour representing consolidation within that trend.
This chart forms part of the NIFTY 750 Structural Study, documenting long-term price behaviour across ~750 Indian equities.
Structure → Level → Trigger → Probability
#NIFTY750
#TVSMotor
#MarketStructure
#ElliottWave
#PriceAction
#IndianStockMarket
#EwavesJournal
TVS Motor Company (NSE: TVSMOTOR) — Swing Breakout Setup 'D'Timeframe: 1D
Structure: Pullback → Base Formation → Breakout Attempt
🔎 Technical Overview
TVSMOTOR is currently trading near the prior swing high zone around ₹3,900–3,950 after forming a higher low structure on the daily timeframe. The recent price action shows constructive consolidation followed by renewed buying interest, supported by volume expansion.
Fibonacci projections from the previous impulse leg indicate that price has reclaimed the 0 level (₹3,901), signaling strength. The structure suggests a potential continuation move if the breakout sustains.
Momentum remains positive, although slightly cooling, which indicates healthy consolidation rather than immediate exhaustion.
📌 Key Levels to Watch
Immediate Support:
₹3,900–3,910 (breakout retest zone)
₹3,740–3,750 (0.5 Fib support)
Resistance / Upside Projections:
₹4,050 (first supply zone)
₹4,130–4,150 (major resistance cluster / Fib 0.618 extension)
₹4,300 (extended bullish projection if momentum accelerates)
🎯 Trading Plan (Swing Bias)
Bullish Case:
A sustained move and daily close above ₹3,970 with strong volume confirmation could trigger continuation toward ₹4,050 and potentially ₹4,130–4,150.
Pullback Scenario:
Failure to hold ₹3,900 may lead to retracement toward ₹3,750, where buyers may attempt to defend structure.
Invalidation Level:
A decisive daily close below ₹3,740 would weaken the bullish structure and negate the breakout thesis.
📈 Bias
Short-term: Bullish above ₹3,900
Medium-term: Uptrend continuation structure intact
Risk-reward favorable near breakout base with defined stop
⚠️ Risk Disclosure
This analysis is for educational purposes only and reflects personal technical observations based on price structure and Fibonacci projections. Markets are subject to volatility, liquidity shifts, and broader index sentiment. Traders should conduct their own research, assess their risk tolerance, and use proper position sizing before taking any trades. No recommendation to buy or sell securities is intended.
TVS Motor- Key Levels & Conditional ScenariosAs you see chart is self explanatory
Time frame - 4 Hours
Tools- Parallel channels, Pivots
Method - Trend analysis, Chart patterns
An uptrend is expected for Tvs motors with Resistance at 3775-3800 levels and very strong resistance at 3950-4000 levels.
Check this link for video explanation
Review and plan for 29th January 2026Nifty future and banknifty future analysis and intraday plan.
This video is for information/education purpose only. you are 100% responsible for any actions you take by reading/viewing this post.
please consult your financial advisor before taking any action.
----Vinaykumar hiremath, CMT
TVSMOTOR Co. Ltd for 29th Oct #TVSMOTOR TVSMOTOR Co. Ltd for 29th Oct #TVSMOTOR
Resistance 3580 Watching above 3583 for upside momentum.
Support area 3530-3540 Below 3550 gnoring upside momentum for intraday
Watching below 3529 for downside movement...
Above 3550 ignoring downside move for intraday
Charts for Educational purposes only.
Please follow strict stop loss and risk reward if you follow the level.
Thanks,
V Trade Point
Intraday or Swing - Ichimoku, SMA, RSI and Fractal - Full SetupA very simple and effective setup for Swing and Intraday and can be applied to any stocks, crypto, or Forex.
Simplified –
If the Ichimoku Lag Span is ABOVE the price, then the upcoming momentum is Bullish and Trending Upwards.
If the Ichimoku Lag Span is BELOW the price, then the upcoming momentum is Bearish and Trending Downwards.
# Full Setup for Swing, Positional, Intraday and applicable on any scripts: -
• Monthly Ichimoku Lag span must be above Current price
• Price must be above 9SMA
• RSI 60>
• Same setup in Daily as monthly
• You will take entry at fractals which is green and red bar. Green bar is Resistance and Red is support. You will enter near Support for better Risk Management
Note – Example of TVS motors for you all. Now back test with any stocks.
TVS MOTOR CUP AND HANDLE FORMATION LONG TERM SWINGPattern: Cup and Handle (Bullish Continuation Pattern)
Trading Style: Long-Term Swing Trading (holding for several days to weeks, or even longer to capture significant moves)
Current Context (as of July 8, 2025):
TVS Motor Company (TVSMOTOR) last closed around ₹2876.90.
The 52-week high is ₹2960.30.
Recent analyst reports and technical analysis suggest that TVS Motor is near its all-time high (ATH) and there are discussions about a potential breakout above ₹2958 to ₹2960, which could confirm a bullish continuation if the cup and handle pattern is indeed forming.
Your Proposed Trade Setup:
Entry Level:
Safe Trader: Above ₹2960
Risky Trader: ₹2850
Stop Loss (SL):
Risky Trader: If weekly candle closing below ₹2800
Safe Trader: Weekly candle close below ₹2920
Target (TR):
1st Target: ₹3075
2nd Target: ₹3315
3rd Target: ₹4000
Review and plan for 26th June 2025Nifty future and banknifty future analysis and intraday plan.
This video is for information/education purpose only. you are 100% responsible for any actions you take by reading/viewing this post.
please consult your financial advisor before taking any action.
----Vinaykumar hiremath, CMT
+460% potential profit with TVS MotorThis is my pick for buy&hold in 2025 in NSE India. A part of Nifty Auto Index which will drive its growth and lead the sector.
Strong chart from all angles. This is published as demo of what is available on my social media. You can find more through links in my profile.
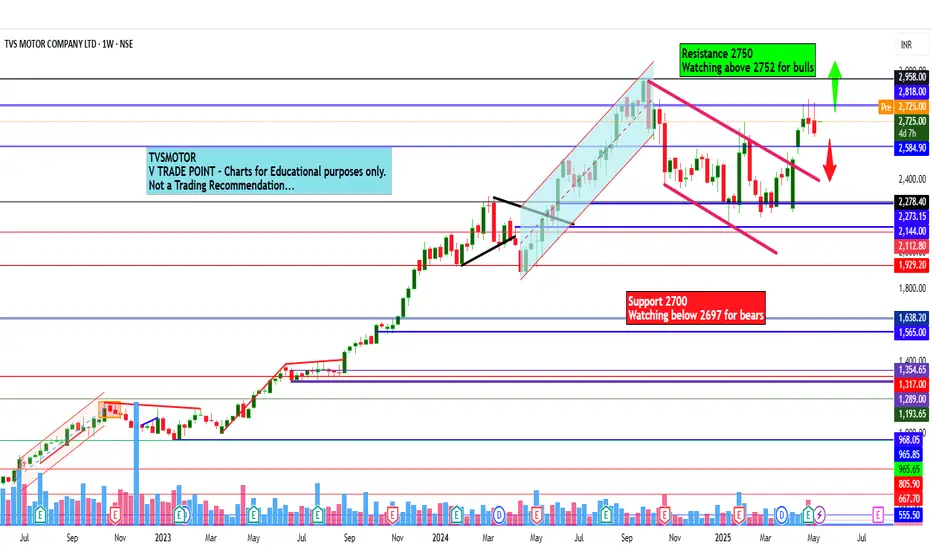
TVS MOTOR Co Ltd view for Intraday 12th May #TVSMOTOR TVS MOTOR Co Ltd view for Intraday 12th May #TVSMOTOR
Resistance 2750 Watching above 2752 for upside movement...
Support area 2700 Below 2730 ignoring upside momentum for intraday
Watching below 2697 for downside movement...
Above 2730 ignoring downside move for intraday
Charts for Educational purposes only.
Please follow strict stop loss and risk reward if you follow the level.
Thanks,
V Trade Point
Equity Research Report – TVS Motor Company Ltd.📌 Timeframes Analyzed: 15-Minute and 1-Hour
📅 Date: May 5, 2025
📍 CMP: ₹2,774.40
📈 Setup: Bullish breakout from falling channel with EMA crossover
🔹 Technical Highlights
Pattern: Descending channel breakout (1H)
Moving Averages: Price is trading above the 20-EMA and 50-EMA with bullish crossover
Volume: Breakout confirmed by increasing volume
RSI (Momentum): RSI is trending up above 50 with positive divergence
🟢 Trade Plan – Intraday to Short-Term Swing
✅ Buy Levels (Confirmation Entry)
Buy Above: ₹2,780 (breakout confirmation level)
🎯 Targets
Timeframe Target 1 Target 2 Target 3
15-min ₹2,810 ₹2,835 ₹2,860
1-hour ₹2,850 ₹2,880 ₹2,920
🔻 Stop Loss
Intraday SL: ₹2,745 (below channel support and 50-EMA)
Swing SL: ₹2,720