In-depth trading ideas
TORRENT PHARMATorrent Pharmaceuticals Ltd. (CMP ₹4,572.00, NSE: TORNTPHARM) Prepared by Sucrit Patil | The SmartWay Research Desk | 12 June 2026 An Ahmedabad‑based pharmaceutical major, incorporated in 1972. Torrent Pharma operates across cardiovascular, central nervous system, gastro‑intestinal, anti‑infective, diabetology, and oncology segments, with strong presence in India, Brazil, Germany, and the U.S. Promoter Holding (Mar 2026): Mehta Family — 71.25% stake (no pledges) --- FY22–FY26 Snapshot - Revenue Growth: FY26 revenue ₹11,215 Cr vs ₹9,842 Cr in FY25 (+13.9% YoY). → Good - Net Profit: FY26 PAT ₹1,215 Cr vs ₹1,048 Cr in FY25 (+15.9% YoY). → Good - Operating Margin: FY26 EBITDA ₹2,312 Cr, margin 20.6% vs 19.8% last year (+80 bps). → Good - Equity Capital: Stable, face value ₹5. → Good - Dividend Policy: Dividend ₹20.00/share declared for FY26. → Good - Asset Building: Investments in oncology, biosimilars, and U.S. generics. → Good - Sales: Strong demand from India, Brazil, and Germany markets. → Good - Expense: R&D spend ~8% of revenue; manageable. → Good - EPS: FY26 EPS ₹72.15 vs ₹62.20 last year (+16%). → Good --- Institutional Interest & Ownership Trends (Mar 2026) - Promoter Holding: 71.25% (no pledges) - FII Holding: 8.12% - DII Holding: 12.34% - Retail & Others: 8.29% --- Strategic Moves & Innovations - Expansion in oncology and biosimilars pipeline. - Focus on U.S. generics and EU formulations. - Partnerships with global pharma companies for co‑marketing. - Diversification into specialty therapies and chronic care. --- Cash Flow & Balance Sheet Strength - Market cap ~₹77,800 Cr. - Debt‑to‑equity ratio ~0.22 (moderate leverage). - Book value per share ₹412.00; P/B ~11.1. - EPS (TTM) ₹72.15; P/E ~63.4. --- Risk Factors - High P/E ratio ~63.4, indicating premium valuations. - Dependence on regulatory approvals in U.S./EU markets. - Exposure to pricing pressure in generics. - Competition from Sun Pharma, Cipla, and Dr. Reddy’s. --- Investor Takeaway Torrent Pharma has delivered robust FY26 performance, with revenue and profit growth supported by chronic therapies and international expansion. With strong promoter backing, dividend payouts, and a diversified portfolio, Torrent remains a premium play in Indian pharma. At CMP ₹4,572.00, valuations are expensive (P/E ~63.4, P/B ~11.1), reflecting growth expectations in oncology, biosimilars, and global generics.
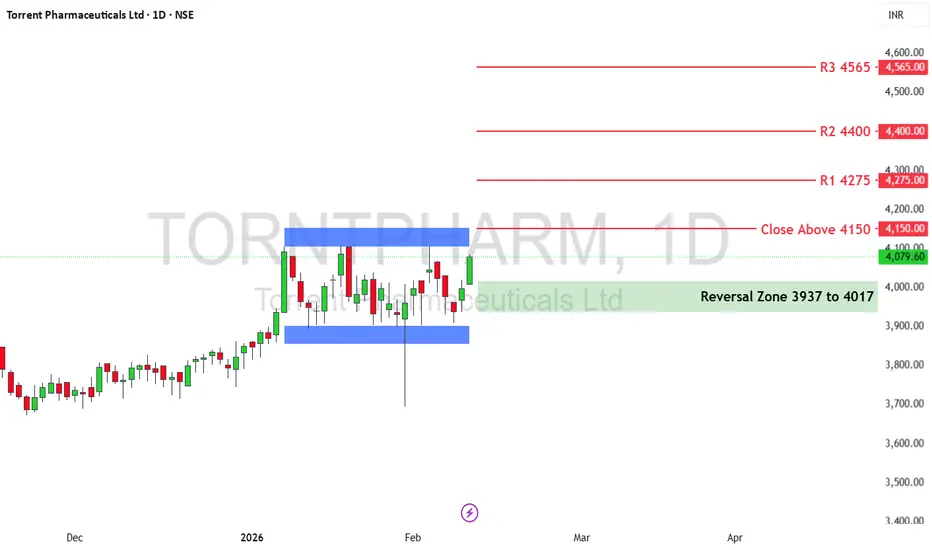
Torrent Pharma: Coiling Below 4150 — Breakout BrewingFundamentals:
Torrent is a chronic-therapy-focused, branded-generics leader (cardiac, CNS, diabetology, GI) with ROE/ROCE ~25–27%, healthy margins, steady double-digit growth, strong cash flows, and low beta. The premium P/E reflects earnings visibility and quality, not hype.
Technicals:
After a sharp rally, price is compressing in a tight box: 3970–4150.
Repeated supply at 4150
Higher lows near 4000
Volatility contraction = accumulation
Trigger:
Daily close above 4150 → range converts to trend
Targets:
4275 → 4400 → 4565
Buy Zone:
3970–4017 (demand/reversal area)
Invalidation: ty
Sustained move below 3970
Disclaimer: aliceblueonline.com/legal-documentation/disclaimer/
Torent Pharmaceutical Ltd for 23rd Oct #TORNTPHARM Torent Pharmaceutical Ltd for 23rd Oct #TORNTPHARM
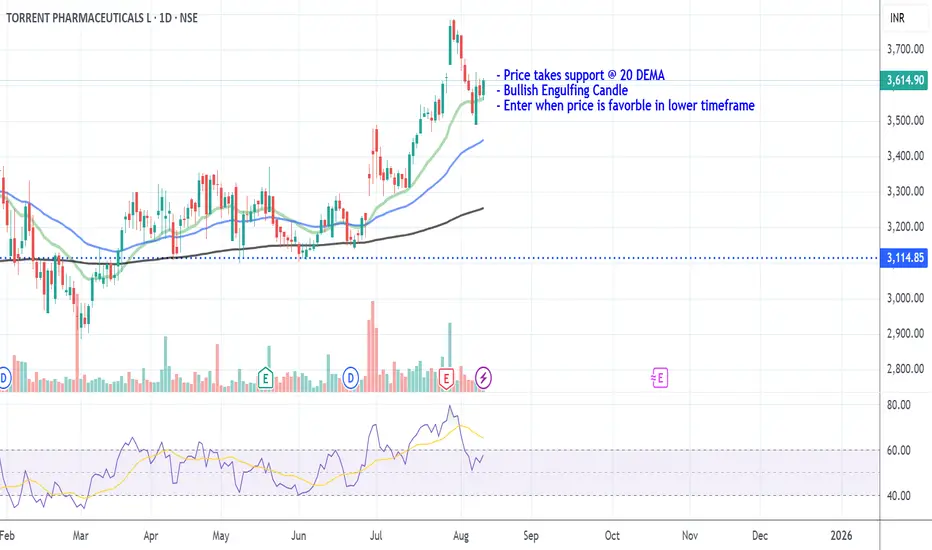
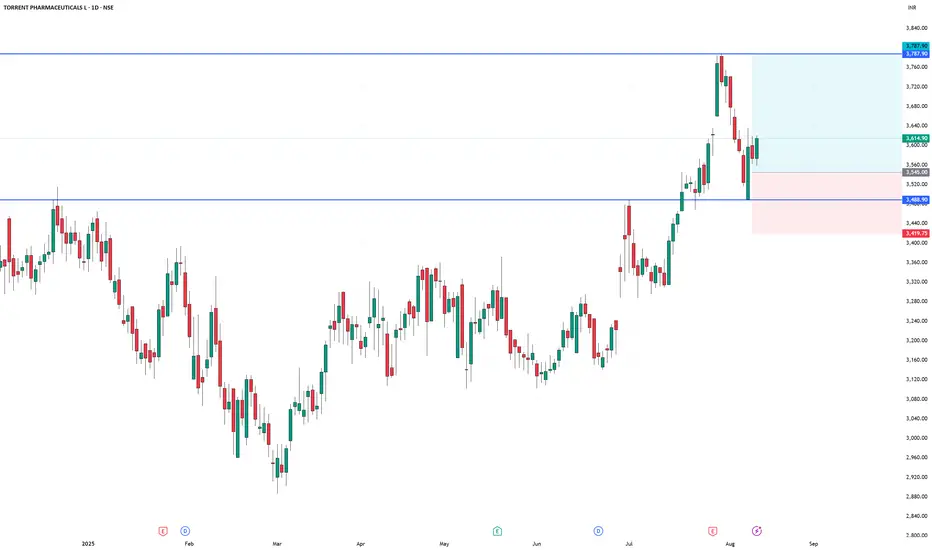
Resistance 3600-3620 Watching above 3623 for upside momentum.
Support area 3550 Below 3550 gnoring upside momentum for intraday
Watching below 3545 for downside movement...
Above 3600 ignoring downside move for intraday
Charts for Educational purposes only.
Please follow strict stop loss and risk reward if you follow the level.
Thanks,
V Trade Point
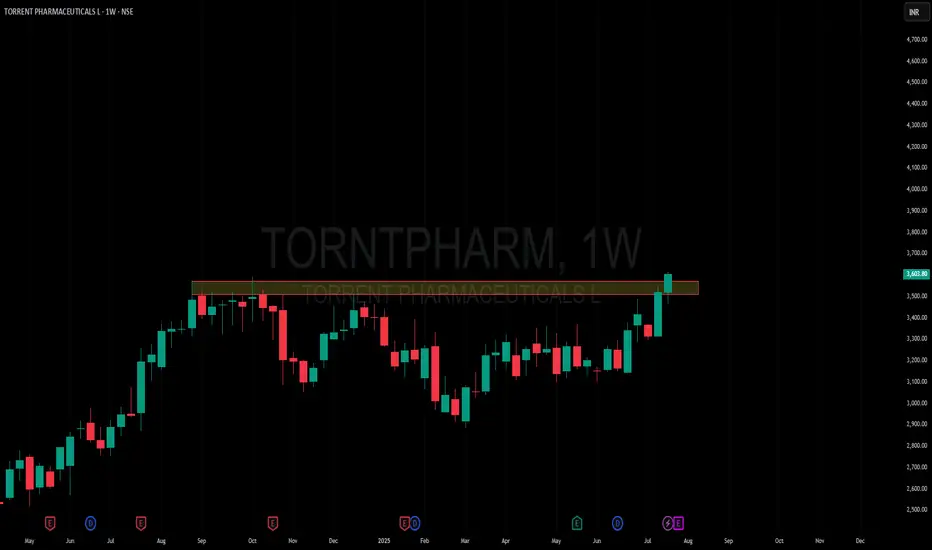
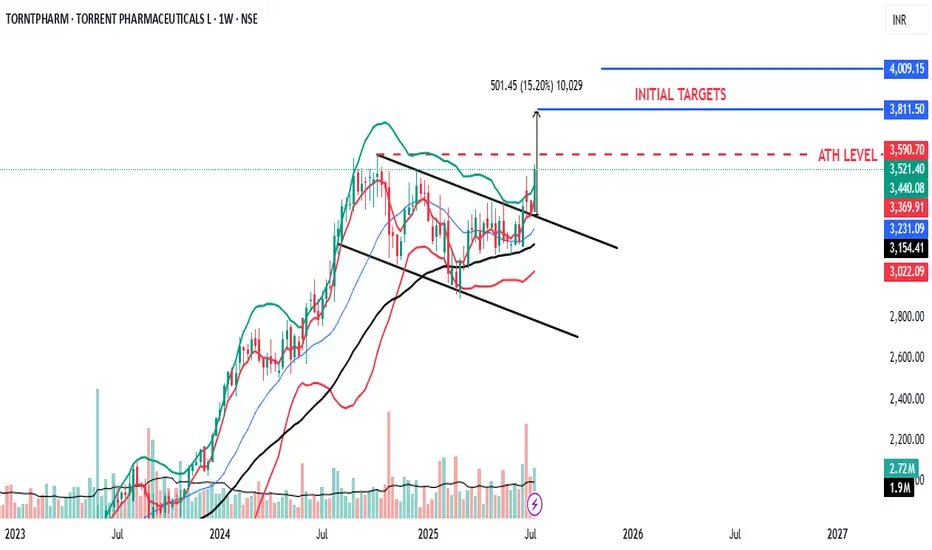
Amazing breakout on WEEKLY Timeframe - TORNTPHARMCheckout an amazing breakout happened in the stock in Weekly timeframe, macroscopically seen in Daily timeframe. Having a great favor that the stock might be bullish expecting a staggering returns of minimum 25% TGT. IMPORTANT BREAKOUT LEVELS ARE ALWAYS RESPECTED!
NOTE for learners: Place the breakout levels as per the chart shared and track it yourself to get amazed!!
#No complicated chart patterns
#No big big indicators
#No Excel sheet or number magics
TRADE IDEA: WAIT FOR THE STOCK TO BREAKOUT IN WEEKLY TIMEFRAME ABOVE THIS LEVEL.
Checkout an amazing breakout happened in the stock in Weekly timeframe.
Breakouts happening in longer timeframe is way more powerful than the breakouts seen in Daily timeframe. You can blindly invest once the weekly candle closes above the breakout line and stay invested forever. Also these stocks breakouts are lifelong predictions, it means technically these breakouts happen giving more returns in the longer runs. Hence, even when the scrip makes a loss of 10% / 20% / 30% / 50%, the stock will regain and turn around. Once they again enter the same breakout level, they will flyyyyyyyyyyyy like a ROCKET if held in the portfolio in the longer run.
Time makes money, GREEDY & EGO will not make money.
Also, magically these breakouts tend to prove that the companies turn around and fundamentally becoming strong. Also the magic happens when more diversification is done in various sectors under various scripts with equal money invested in each N500 scripts.
The real deal is when to purchase and where to purchase the stock. That is where Breakout study comes into play.
Check this stock which has made an all time low and high chances that it makes a "V" shaped recovery.
> Taking support at last years support or breakout level
> High chances that it reverses from this point.
> Volume dried up badly in last few months / days.
> Very high suspicion based analysis and not based on chart patterns / candle patterns deeply.
> VALUABLE STOCK AVAILABLE AT A DISCOUNTED PRICE
> OPPURTUNITY TO ACCUMULATE ADEQUATE QUANTITY
> MARKET AFTER A CORRECTION / PANIC FALL TO MAKE GOOD INVESTMENT
DISCLAIMER : This is just for educational purpose. This type of analysis is equivalent to catching a falling knife. If you are a warrior, you throw all the knives back else you will be sorrow if it hits SL. Make sure to do your analysis well. This type of analysis only suits high risks investor and whose is willing to throw all the knives above irrespective of any sectoral rotation. BE VERY CAUTIOUS AS IT IS EXTREME BOTTOM FISHING.
HOWEVER, THIS IS HOW MULTIBAGGERS ARE CAUGHT !
STOCK IS AT RIGHT PE / RIGHT EVALUATION / MORE ROAD TO GROW / CORRECTED IV / EXCELLENT BOOKS / USING MARKET CRASH AS AN OPPURTUNITY / EPS AT SKY.
LET'S PUMP IN SOME MONEY AND REVOLUTIONIZE THE NATION'S ECONOMY!
TORRENT PHARMA, Kindly do your own studyThis stock is ready to zoom. Stock is near all time high level and ready to break that level.
Monthly price is above 5 EMA
Monthly MACD flat after down
Monthly RSI is above 60
Weekly price is challenged upper bollinger band with good volume
Weekly MACD is in PCO stat and above zero line
Weekly RSI is above 60
Weekly ADX is strong
Daily RSI is in momentum
Daily ADX is strong
Torrent Pharmaceuticals 1DTorrent Pharmaceuticals, currently trading around ₹3,200, is poised to potentially break its all-time high. The stock has formed a bullish triangle pattern, indicating strong upward momentum
Disclaimer: The information provided is for educational and informational purposes only and should not be considered as financial advice. Investing in the stock market involves risk, and past performance is not indicative of future results. Please consult with a certified financial advisor or conduct your own research before making any investment decisions. We are not responsible for any losses incurred as a result of using this information. Stock market investments are subject to market risks; read all related documents carefully.
Torrent Pharma Ltd for Intraday 31st October #TORNTPHARM Torrent Pharma Ltd for Intraday 31st October #TORNTPHARM
Resistance 3150-3160. Watching above 3162 for upside movement...
Support area 3080. Below 3110 ignoring upside momentum for intraday
Support 3080 .Watching below 3078 for downside movement...
Resistance area 3150
Above 3110 ignoring downside move for intraday
Charts for Educational purposes only.
Please follow strict stop loss and risk reward if you follow the level.
Thanks,
V Trade Point
TORRENT PHARMA S/R Support and Resistance Levels:
Support Levels: These are price points (green line/shade) where a downward trend may be halted due to a concentration of buying interest. Imagine them as a safety net where buyers step in, preventing further decline.
Resistance Levels: Conversely, resistance levels (red line/shade) are where upward trends might stall due to increased selling interest. They act like a ceiling where sellers come in to push prices down.
Breakouts:
Bullish Breakout: When the price moves above resistance, it often indicates strong buying interest and the potential for a continued uptrend. Traders may view this as a signal to buy or hold.
Bearish Breakout: When the price falls below support, it can signal strong selling interest and the potential for a continued downtrend. Traders might see this as a cue to sell or avoid buying.
20 EMA (Exponential Moving Average):
Above 20 EMA: If the stock price is above the 20 EMA, it suggests a potential uptrend or bullish momentum.
Below 20 EMA: If the stock price is below the 20 EMA, it indicates a potential downtrend or bearish momentum.
Trendline: A trendline is a straight line drawn on a chart to represent the general direction of a data point set.
Uptrend Line: Drawn by connecting the lows in an upward trend. Indicates that the price is moving higher over time. Acts as a support level, where prices tend to bounce upward.
Downtrend Line: Drawn by connecting the highs in a downward trend. Indicates that the price is moving lower over time. It acts as a resistance level, where prices tend to drop.
RSI: RSI readings greater than the 70 level are overbought territory, and RSI readings lower than the 30 level are considered oversold territory.
Combining RSI with Support and Resistance:
Support Level: This is a price level where a stock tends to find buying interest, preventing it from falling further. If RSI is showing an oversold condition (below 30) and the price is near or at a strong support level, it could be a good buy signal.
Resistance Level: This is a price level where a stock tends to find selling interest, preventing it from rising further. If RSI is showing an overbought condition (above 70) and the price is near or at a strong resistance level, it could be a signal to sell or short the asset.
Disclaimer:
I am not a SEBI registered. The information provided here is for learning purposes only and should not be interpreted as financial advice. Consider the broader market context and consult with a qualified financial advisor before making investment decisions.
Triangle pattern on TORNTPHARMTORNTPHARM formed a triangle pattern on daily chart with multiple test of support and resistance. Price broke out of resistance and subsequently retesting now support (previous resistance line). Looking at the aggressive bears once brought the price down compared with recent swing low, it appears bears aggressiveness has weekend. Also the recent swing high shows bulls are aggressive. Wait for the price to bounce back from support before entering long. Stop loss can be held just below recent swing low. with Target the larger width of triangle. This would be a low risk trade with potential 1:3 risk reward.
Hope you liked this idea. If so please boost this idea so others can benefit from it or leave a comment below on your thoughts on this setup. I'll be glad to hear from you. Otherwise, happy trading :-)