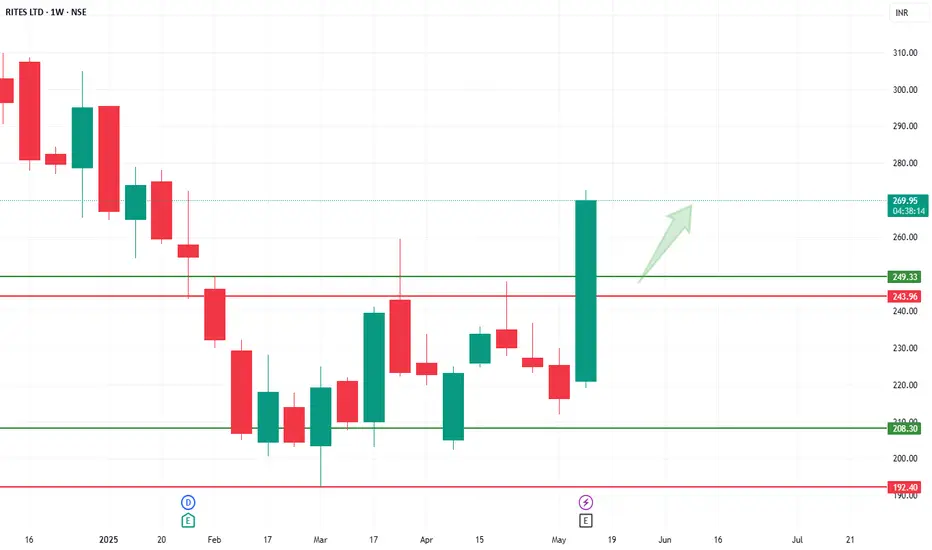
Rites - Right time to enter - Huge volume breakoutRITES holds a formidable order book valued at over ₹9,200+ Crore, securing high revenue visibility for the next 2 to 3 years. Turnkey Projects (~49% of order book): Drives high top-line revenue growth.
Government Push: The Indian Government’s massive capital expenditure layout for modernizing Indian Railways and expanding city Metro networks acts as a long-term safety net for order inflows.
Debt free | strong div yield | ROCE 22% | ROE 15.4% | PE 27.6
Valuations are good compared to peers (Screener) Civil construction industry
RITES Ltd.
No trades
No trades
In-depth trading ideas
RITES: Long-Term Channel Support Signals Potential ReversalRITES Ltd. is currently trading near the lower boundary of a long-term ascending channel that has guided price action for several years. Historically, this trendline has acted as a strong demand zone, making the current area technically significant for long-term investors.
After an extended corrective phase from its previous highs, price appears to be stabilizing around channel support. A sustained hold above this region, followed by higher highs and higher lows, could mark the beginning of a fresh bullish cycle over the coming months. If buying momentum strengthens, the stock may gradually advance toward the upper boundary of the long-term channel.
The projected path represents a technical scenario rather than a prediction. As always, confirmation through price action, volume expansion, and broader market participation will improve the probability of a sustained move.
About the Company
RITES Ltd. is a Government of India enterprise and one of the country's leading engineering consultancy companies. It provides end-to-end services across transport infrastructure, including railways, highways, ports, airports, urban transport, and export of railway rolling stock.
Key Business Segments
Railway engineering and consultancy
Project management services
Transport infrastructure development
Quality assurance and inspection
Export of locomotives, coaches, wagons, and railway equipment
Turnkey infrastructure and maintenance projects
Technical Perspectiv e
Price is approaching a long-term ascending channel support.
Risk-to-reward improves if the support zone continues to hold.
A confirmed reversal could initiate a medium- to long-term recovery phase.
The upper channel remains the primary technical objective over the longer horizon.
Disclaimer
This analysis is based solely on technical chart structure and is intended for educational and informational purposes only. The illustrated price path is a possible scenario, not a guarantee of future performance. Market conditions can change at any time, and traders should wait for technical confirmation before making investment decisions. Always conduct your own research and manage risk appropriately.
RITES Ltd. Breakdown: Is the Bear Market Finally Over ?After a brutal correction cycle that wiped off a significant portion of its value from its 2025 highs, RITES Ltd. is showing a classic structural trend reversal on the daily chart. Today’s strong single-day surge of +5.57% (trading at 211.37) has positioned the stock right at a major breakout trigger zone.
Let's dissect the market structure, the historical correction cycles, and the exact roadmap ahead.
The Anatomy of the Down-Cycle (July 2025 – March 2026)
Before finding a floor, RITES went through a textbook series of lower highs and lower lows, frustrating retail investors through three distinct phases:
Phase 1 (July – Sept 2025): The stock faced an initial drop of -13.73% in July, followed by a brief dead-cat bounce of +12.40% through August and September.
Phase 2 (Sept – Dec 2025): Selling pressure intensified, dropping the price by -18.62%. A minor relief rally into December (+13.70%) gave false hope before rolling over.
Phase 3 (Jan – March 2026 - The Final Capitulation): The steepest drop came in early 2026, plunging -27.26% ($\Delta -65.58$ points) to hit its definitive structural bottom.
The Structural Shift: Higher Lows Formed The trend began shifting when aggressive buying emerged off the March 2026 lows.
The Initial Push (Apr – May 2026): A sharp +19.03% recovery wave proved that institutional buyers were stepping back in.
The Healthy Retest (May – June 2026): Instead of making a newer low, the stock underwent a controlled profit-booking retracement of -11.66%, carving out a beautiful Higher Low right around the ₹200 level.
Technical Price Structure & Key Levels
The stock is currently trading at ₹211.30, which serves as the active breakout zone and indicates that buyers are attempting to establish control above recent resistance levels. Price action remains constructive as long as it sustains above the immediate support region.
Primary Support (Stop Loss): ₹206.85
This level acts as the immediate invalidation point for the bullish setup. A close below ₹206.85 may weaken the current breakout structure and increase the probability of a deeper pullback
SMA 7: ₹203.32
The 7-period Simple Moving Average continues to provide dynamic short-term support, reflecting positive near-term momentum. Sustained trading above this moving average keeps the short-term trend biased to the upside
Upside Targets
Primary Target – ₹230.83
This represents the first momentum objective for the ongoing breakout move. A successful move above current levels could attract fresh buying interest toward this target.
Target 2 – ₹240.13
A medium-term structural resistance level that may act as the next destination once the primary target is achieved. Strong volume and momentum would be required for a decisive move beyond this zone.
Target 3 – ₹255.25
This is the major swing resistance target derived from the broader price structure. Reaching this level would signify a substantial continuation of the prevailing bullish trend and could attract profit booking from shorter-term traders.
Updates (Q4 FY26 Financials)
Revenue: Surged by 27.6% YoY to ₹768.26 crore, showcasing highly robust project execution.
Net Profit: Dipped slightly by 2.3% YoY to ₹130.1 crore due to compressed operating margins (dropping to ~16.9% against ~22% in Q4 FY25).
Corporate Action: The company declared a final dividend of ₹2.75 per share, bringing the total FY26 payout to ₹5.50 per share.
Ownership
Promoter Holding: Heavily backed by the Government of India, with the promoter (President of India) maintaining a dominant 72.2% stake.
Institutional / Public Mix: Foreign Institutional Investors (FIIs) hold roughly 3.5%, Mutual Funds/UTI sit around 2.3%, and retail/public holding makes up the remaining ~22.1%.
Growth
Order Book Visibility: RITES commands a robust order pipeline of ₹5,800 crore to ₹9,262 crore (depending on project phase validations), ensuring solid revenue visibility for the next 2 to 2.5 years.
Project Segments: Growth is primarily led by its high-margin Consultancy arm, domestic turnkey infrastructure (like line doubling and electrification), and international supply exports. Revenue is projected to grow at a 10% CAGR over the FY25–FY27 period.
Triggers
Technical Breakout: The price has successfully bounced off its structural support zone at ₹200–₹206. A sustainable move above ₹210 officially triggers a short-to-medium-term bullish trend reversal.
Macro Catalyst: Massive railway capital expenditure allocations from the Indian Government alongside aggressive execution of international export contracts across Africa and Southeast Asia.
Moat
Nomination Dominance: Roughly 39% of RITES' massive order book is secured directly via government nomination rather than competitive bidding, demonstrating its exclusive strategic relationship with Indian Railways.
Asset-Light High Margins: Its core Consultancy division operates an asset-light model that achieves impressive standalone operating margins of ~42%, providing a defensive buffer during market downturns.
Rating
Technical Consensus: Caution to Neutral Reversal (Analysts indicate it remains structurally weak below major historical moving averages, but the current zone represents a strong reversal setup if it firmly stays above ₹210).
Fundamental Brokerage Consensus: BUY (Prominent brokerages maintain a long-term buy view, assigning a fundamental target price of ₹275/share, valuing the company at roughly 24x FY27E EPS).
Disclaimer: aliceblueonline.com/legal-documentation/disclaimer/
RITESRITES showing good strength in recent session. And currently trading near strong hurdle. It has a strong resistance near 310-15 levels and rejected many times earlier. So if now closing above 315 may start new momentum rally in the counter which may continue for next 20-22% upwards. On lower side 270 seems very good support But closing above 315 is very crucial. I would avoid before that but surely keep a closer watch on it.
RITES for Swing and Short Positional viewAs we can see H3 chart already has created reversal CHoCH which is a good signal of bullish view. After inducement (X) taken out candles have created M15 Ch and price is trading in the discount zone (<Rs 225/-) of previous impulsive leg (the low & high swing points already mentioned on the chart with yellow dot)
So, we can buy at the demand zone or at any price level below Rs 225/-and can hold up to 1-2 months for 20-25% return.
RITES: INVERSE H&S BREAKOUTThe Inverse Head and Shoulders pattern is a bullish reversal chart pattern that signals a potential trend reversal from bearish to bullish. It consists of three key components:
Structure of the Pattern:
Left Shoulder: A price decline followed by a temporary rally.
Head: A deeper decline forming the lowest point, followed by another rally.
Right Shoulder: A decline similar in size to the left shoulder but not as deep as the head, followed by a move higher.
Neckline: A resistance level that connects the highs of the two rallies after the left shoulder and head.
The Inverse Head and Shoulders pattern in RITES, with a neckline at ₹225, indicates a potential bullish reversal. The stock has formed a well-defined left shoulder, head, and right shoulder, suggesting that selling pressure is weakening. The target price for this breakout is ₹263 calculated by measuring the distance from the head’s low to the neckline and projecting it upwards. If the stock sustains above the neckline, it could gain further momentum. However, traders should consider placing a stop-loss at 212 to manage risk in case of a failed breakout.
RITES giving bamboo to investorsRITES pays dividends, stock split etc.....but it has given major bamboo to its investors after the major run up...The most likely reversal area is around 150-160....provided we see some price action there....I wouldn't have much hope unless the overall Indian market sentiment improves.. Why can't they remove LTCG tax? FIIs are getting better returns putting their money in UAE which is giving 5% without tax.....Here Nifty might give 5% with the additional risk , because LTCG makes it less enticing to invest...Right now, this stock is in a death spiral....I have bought some at these levels and will continue to average down....Multiple sell orders till 400.....Keep in mind FIIs are still aggressively selling.....and FDs are giving better returns now.....so invest at your own risk....
Rites BO after accumulationThe stock is showing a breakout (Bo) after accumulating at support levels.
This presents a favorable risk-reward ratio (R:R) for trading, especially with a small stop loss (SL).
Volumes are also shooting 'up.
It's worth noting that there’s a trendline that has been respected for a long time.
Breakout should be with a strong candle (TF as we used in chart); then the entry will be after the consecutive candle which should be breaching the breakout candle.
Do your own research before investing
RITES LTDAnalyst consensus provides a median price target of ₹325.50, representing a potential upside of about 16.52% from the current price.
TRENDLYNE
In terms of valuation metrics, the company has a Price-to-Earnings (P/E) ratio of 33.81, a Price-to-Sales (P/S) ratio of 6.51, and a Price-to-Book (P/B) ratio of 4.95.
ECONOMIC TIMES
Given these factors, while RITES Ltd. exhibits strong financial health, the current market price appears to be higher than its estimated intrinsic value. Potential investors should consider this overvaluation and the limited upside potential when making investment decisions.
SWING IDEA - RITESRITES , a leading engineering consultancy company specializing in transport infrastructure, is showing technical signals that suggest a promising swing trading opportunity.
Reasons are listed below :
770-800 Resistance Zone : The 770-800 level has been tested multiple times and the price is now attempting to break through this resistance, indicating strong bullish momentum.
Ascending Triangle Breakout : The price is breaking out of an ascending triangle pattern, a bullish continuation pattern that suggests potential for further upward movement.
Bullish Engulfing Candle on Daily Timeframe : The recent formation of a bullish engulfing candle on the daily chart indicates strong buying pressure and further supports the bullish case.
50 EMA Support : The stock is finding support at the 50-day exponential moving average (EMA), reinforcing the overall bullish sentiment and providing a strong support level.
Trading at All-Time High : The stock is trading at its all-time high, suggesting strong market confidence and potential for further gains.
Spike in Volume : A noticeable increase in trading volumes confirms the strength of the price move and indicates growing investor interest.
Target - 930 // 1030
Stoploss - daily close below 680
DISCLAIMER -
Decisions to buy, sell, hold or trade in securities, commodities and other investments involve risk and are best made based on the advice of qualified financial professionals. Any trading in securities or other investments involves a risk of substantial losses. The practice of "Day Trading" involves particularly high risks and can cause you to lose substantial sums of money. Before undertaking any trading program, you should consult a qualified financial professional. Please consider carefully whether such trading is suitable for you in light of your financial condition and ability to bear financial risks. Under no circumstances shall we be liable for any loss or damage you or anyone else incurs as a result of any trading or investment activity that you or anyone else engages in based on any information or material you receive through TradingView or our services.
@visionary.growth.insights
Symmetrical triangle on RITESRITES formed a symmetrical triangle pattern on daily chart. With multiple support level tested, it is looking good. Also looking at the way the price has broken out of resistance with charging bulls, probability of price going up is higher. Stop loss can be held just below the breakout candle. Any swing low could give you an entry with target at 52week high.
Hope you liked this idea, if so please boost this idea so others could benefit or leave a comment on what you think. I'll be glad to hear from you. Otherwise happy trading :-)
RITES go long ifit crosses 525.70
entry @ 525.75
stop loss: 470.95 (10.42% risk involved)
target: 635.10 (20.80% reward with a risk of 10.42%)
buy this stock only one can handle risk of 10.42%
this is my stock idea and i am entering in it with 10.42% risk, if one cannot handle 10.42% risk please do not enter into it.
I am no SEBI registered individual , please do your own analysis before entering into it.