Compare with Motilal Oswal Financial Services Limited
32.9 INR
18.69 B INR
96.13 B INR
138.61 M
Next report date
—
Report period
—
EPS estimate
—
Revenue estimate
—
Company info
Sector
Industry
CEO
Motilal Oswal
Website
Headquarters
Mumbai
Founded
2005
IPO date
Sep 17, 2007
ISIN
INE338I01027
FIGI
BBG000R3TTT7
Identifiers
ISIN INE338I01027
Motilal Oswal Financial Services Ltd. is a non-banking financial company, which engages in providing a range of financial products and services such as private wealth, retail broking and distribution, institutional broking, asset management, investment banking, private equity, commodity broking, currency broking, and home finance. It operates through the following segments: Wealth Management, Capital Markets, Asset and Private Wealth Management, Home Finance, and Treasury Investments. The Wealth Management segment manages broking services and financial product distribution. The Capital Market segment includes research and advisory services, investment banking, and institutional broking. The Asset and Private Wealth Management segment offers fee-based services for management of assets. The Home Finance segment represents interest and other related income from affordable housing finance business. The Treasury Investments segment refers to investment and financing activities. The company was founded on May 18, 2005, and is headquartered in Mumbai, India.
Motilal Oswal Financial Services Limited (NSE: MOTILALOFS)Here is the short-term technical outlook for Motilal Oswal Financial Services Limited (NSE: MOTILALOFS) based on your daily chart and Fibonacci retracement setup:
Technical Summary
Current Market Price (CMP): ~₹857.00
Context: The stock experienced a sharp drop from its recent swing high of ₹989.7
MOTILALOFS (D) CHARTTechnical Note: Let the market come to your zones and show its hand. Trade safely and manage your risk! Always wait for your own confirmations before entering the market.
Risk Disclaimer: This analysis is for educational purposes only and does not constitute financial advice. Always practice proper
Motilal Oswal: Hold or Breakdown? Key Technical Levels to Watch.MOTILAL OSWAL – Technical Outlook
The stock continues to trade within a well-defined ascending channel and is currently positioned near the mid-channel support, which is also aligned with the 200 EMA. Historically, this confluence has acted as a strong demand zone, preventing the price from sustain
A short term technical trade DAILY TFStock price is trading within a channel and formed an inverse head and shoulders pattern taking support at lower trendline.......buying zone 926-930.......sl below 893 closing basis....Target 1 is 1029 and Target 2 is 1158... Only for educational purpose and not any recommendations.........
A trendline breakout A trendline breakout occurs when an asset's price crosses and closes outside a established diagonal trendline, signaling a potential trend reversal or continuation. Valid breakouts are confirmed by a strong candle close beyond the line, often accompanied by high volume, and sometimes a retest of the
Motilal Oswal Financial Services Ltd – May Turn to Upside from KMotilal Oswal Financial Services Ltd (1D – NSE)
Trend:
Medium-term structure is still range-bound to corrective after a strong prior up-move. Recent price action shows a descending channel / falling trendline, indicating short-term weakness.
Key Resistance:
₹1,039–1,050: Major supply zone and pre
MOTILALOFS - Double Top PATTERN BREAKOUT [SELL SIDE ]I am not a SEBI-registered investment advisor. The information provided here is for educational and informational purposes only and should not be construed as financial or investment advice. Please do your own research or consult with a SEBI-registered financial advisor before making any investment
See all ideas
Summarizing what the indicators are suggesting.
Neutral
SellBuy
Strong sellStrong buy
Strong sellSellNeutralBuyStrong buy
Neutral
SellBuy
Strong sellStrong buy
Strong sellSellNeutralBuyStrong buy
Neutral
SellBuy
Strong sellStrong buy
Strong sellSellNeutralBuyStrong buy
An aggregate view of professional's ratings.
Neutral
SellBuy
Strong sellStrong buy
Strong sellSellNeutralBuyStrong buy
Neutral
SellBuy
Strong sellStrong buy
Strong sellSellNeutralBuyStrong buy
Neutral
SellBuy
Strong sellStrong buy
Strong sellSellNeutralBuyStrong buy
Displays a symbol's price movements over previous years to identify recurring trends.
Frequently asked questions
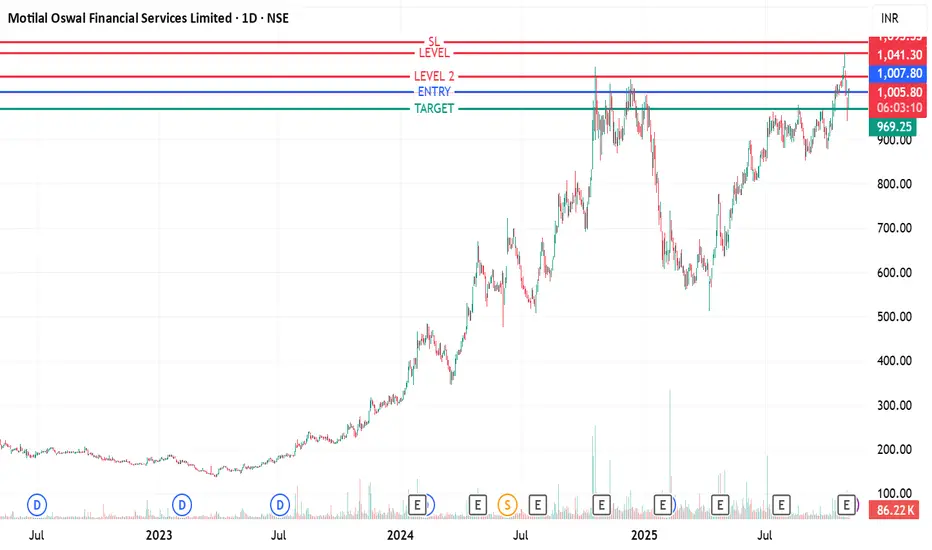
The current price of MOTILALOFS is 1,025.0 INR — it has decreased by −2.52% in the past 24 hours. Watch Motilal Oswal Financial Services Limited stock price performance more closely on the chart.
Depending on the exchange, the stock ticker may vary. For instance, on NSE exchange Motilal Oswal Financial Services Limited stocks are traded under the ticker MOTILALOFS.
MOTILALOFS stock has risen by 2.50% compared to the previous week, the month change is a 18.09% rise, over the last year Motilal Oswal Financial Services Limited has showed a 14.40% increase.
We've gathered analysts' opinions on Motilal Oswal Financial Services Limited future price: according to them, MOTILALOFS price has a max estimate of 1,250.00 INR and a min estimate of 1,024.00 INR. Watch MOTILALOFS chart and read a more detailed Motilal Oswal Financial Services Limited stock forecast: see what analysts think of Motilal Oswal Financial Services Limited and suggest that you do with its stocks.
MOTILALOFS reached its all-time high on Oct 28, 2025 with the price of 1,097.1 INR, and its all-time low was 10.9 INR and was reached on Mar 5, 2009. View more price dynamics on MOTILALOFS chart.
See other stocks reaching their highest and lowest prices.
MOTILALOFS stock is 3.19% volatile and has beta coefficient of 1.77. Track Motilal Oswal Financial Services Limited stock price on the chart and check out the list of the most volatile stocks — is Motilal Oswal Financial Services Limited there?
Today Motilal Oswal Financial Services Limited has the market capitalization of 633.58 B, it has decreased by −1.19% over the last week.
Yes, you can track Motilal Oswal Financial Services Limited financials in yearly and quarterly reports right on TradingView.
Motilal Oswal Financial Services Limited is going to release the next earnings report on Oct 29, 2026. Keep track of upcoming events with our Earnings Calendar.
Motilal Oswal Financial Services Limited revenue for the last quarter amounts to 19.03 B INR, despite the estimated figure of 15.29 B INR. In the next quarter, revenue is expected to reach 14.60 B INR.
MOTILALOFS net income for the last quarter is 12.73 B INR, while the quarter before that showed −2.21 B INR of net income which accounts for 0.00% change. Track more Motilal Oswal Financial Services Limited financial stats to get the full picture.
As of Sep 9, 2026, the company has 12.46 K employees. See our rating of the largest employees — is Motilal Oswal Financial Services Limited on this list?
EBITDA measures a company's operating performance, its growth signifies an improvement in the efficiency of a company. Motilal Oswal Financial Services Limited EBITDA is 27.68 B INR, and current EBITDA margin is 40.97%. See more stats in Motilal Oswal Financial Services Limited financial statements.
Like other stocks, MOTILALOFS shares are traded on stock exchanges, e.g. Nasdaq, Nyse, Euronext, and the easiest way to buy them is through an online stock broker. To do this, you need to open an account and follow a broker's procedures, then start trading. You can trade Motilal Oswal Financial Services Limited stock right from TradingView charts — choose your broker and connect to your account.
Investing in stocks requires a comprehensive research: you should carefully study all the available data, e.g. company's financials, related news, and its technical analysis. So Motilal Oswal Financial Services Limited technincal analysis shows the buy rating today, and its 1 week rating is buy. Since market conditions are prone to changes, it's worth looking a bit further into the future — according to the 1 month rating Motilal Oswal Financial Services Limited stock shows the buy signal. See more of Motilal Oswal Financial Services Limited technicals for a more comprehensive analysis.