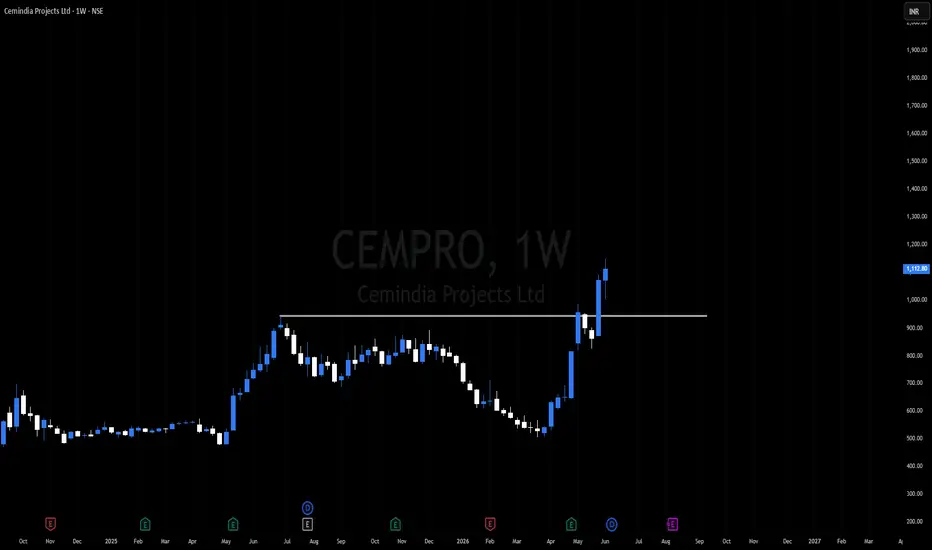
CEMPRO S/R
Support and Resistance Levels:
Support Levels: These are price points (green line/shade) where a downward trend may be halted due to a concentration of buying interest. Imagine them as a safety net where buyers step in, preventing further decline.
Resistance Levels: Conversely, resistance levels (r
Cemindia Projects Ltd
No trades
No trades
Compare with Cemindia Projects Ltd
35.0 INR
5.98 B INR
100.61 B INR
77.51 M
Next report date
—
Report period
—
EPS estimate
—
Revenue estimate
—
Company info
Sector
Industry
CEO
Jayanta Basu
Website
Headquarters
Mumbai
Founded
1978
IPO date
Jul 30, 1998
ISIN
INE686A01026
FIGI
BBG000CPTT32
Identifiers
ISIN INE686A01026
Cemindia Projects Ltd. engages in the construction of a wide variety of structures. Its areas of operations include maritime structures, mass rapid transport systems (MRTS), dams and tunnels, airports, highways, bridges and flyovers, and other foundations and specialized engineering work. The company was founded on June 24, 1978 and is headquartered in Mumbai, India.
Cemindia ProjectStructure: Price has surged from the Weekly DMIP & Monthly BUFL zone (≈ 760 – 880), confirming strong demand absorption.
Bias: As long as price holds above 825, the setup favors continuation toward 1,500.
Momentum: Weekly candle shows +19.4% gain — strong breakout with volume confirmation.
Trend
Amazing BREAKOUT on WEEKLY Timeframe - CEMPROCheckout an amazing breakout happened in the stock in Weekly timeframe, macroscopically seen in Daily timeframe. Having a great favor that the stock might be bullish expecting a staggering returns of minimum 25% TGT. IMPORTANT BREAKOUT LEVELS ARE ALWAYS RESPECTED!
NOTE for learners: Place the break
CEMINDIA PROJECTS LTD – ATH Breakout WATCHOUT !!
📊 Technical Structure
All-Time High breakout after an extended consolidation phase.
Breakout from a short-term descending trendline.
Price trading well above the 50 EMA, confirming bullish momentum.
Higher Highs and Higher Lows structure remains intact.
Previous ATH zone (₹950–1,000) has now turn
See all ideas
Summarizing what the indicators are suggesting.
Neutral
SellBuy
Strong sellStrong buy
Strong sellSellNeutralBuyStrong buy
Neutral
SellBuy
Strong sellStrong buy
Strong sellSellNeutralBuyStrong buy
Neutral
SellBuy
Strong sellStrong buy
Strong sellSellNeutralBuyStrong buy
An aggregate view of professional's ratings.
Neutral
SellBuy
Strong sellStrong buy
Strong sellSellNeutralBuyStrong buy
Neutral
SellBuy
Strong sellStrong buy
Strong sellSellNeutralBuyStrong buy
Neutral
SellBuy
Strong sellStrong buy
Strong sellSellNeutralBuyStrong buy
Displays a symbol's price movements over previous years to identify recurring trends.
Frequently asked questions
The current price of CEMPRO is 1,285.1 INR — it has increased by 1.50% in the past 24 hours. Watch Cemindia Projects Ltd stock price performance more closely on the chart.
Depending on the exchange, the stock ticker may vary. For instance, on NSE exchange Cemindia Projects Ltd stocks are traded under the ticker CEMPRO.
CEMPRO stock has risen by 3.29% compared to the previous week, the month change is a 6.71% rise, over the last year Cemindia Projects Ltd has showed a 76.52% increase.
We've gathered analysts' opinions on Cemindia Projects Ltd future price: according to them, CEMPRO price has a max estimate of 1,700.00 INR and a min estimate of 1,459.00 INR. Watch CEMPRO chart and read a more detailed Cemindia Projects Ltd stock forecast: see what analysts think of Cemindia Projects Ltd and suggest that you do with its stocks.
CEMPRO reached its all-time high on Jul 21, 2026 with the price of 1,649.2 INR, and its all-time low was 5.7 INR and was reached on Mar 12, 2009. View more price dynamics on CEMPRO chart.
See other stocks reaching their highest and lowest prices.
CEMPRO stock is 4.61% volatile and has beta coefficient of 1.41. Track Cemindia Projects Ltd stock price on the chart and check out the list of the most volatile stocks — is Cemindia Projects Ltd there?
Today Cemindia Projects Ltd has the market capitalization of 226.00 B, it has decreased by −2.93% over the last week.
Yes, you can track Cemindia Projects Ltd financials in yearly and quarterly reports right on TradingView.
Cemindia Projects Ltd is going to release the next earnings report on Nov 11, 2026. Keep track of upcoming events with our Earnings Calendar.
CEMPRO earnings for the last quarter are 8.20 INR per share, whereas the estimation was 12.00 INR resulting in a −31.67% surprise. The estimated earnings for the next quarter are 7.40 INR per share. See more details about Cemindia Projects Ltd earnings.
Cemindia Projects Ltd revenue for the last quarter amounts to 27.21 B INR, despite the estimated figure of 29.03 B INR. In the next quarter, revenue is expected to reach 24.25 B INR.
CEMPRO net income for the last quarter is 1.41 B INR, while the quarter before that showed 2.42 B INR of net income which accounts for 0.00% change. Track more Cemindia Projects Ltd financial stats to get the full picture.
Yes, CEMPRO dividends are paid annually. The last dividend per share was 3.00 INR. As of today, Dividend Yield (TTM)% is 0.23%. Tracking Cemindia Projects Ltd dividends might help you take more informed decisions.
Cemindia Projects Ltd dividend yield was 0.59% in 2025, and payout ratio reached 8.62%. The year before the numbers were 0.36% and 9.22% correspondingly. See high-dividend stocks and find more opportunities for your portfolio.
As of Sep 8, 2026, the company has 36.81 K employees. See our rating of the largest employees — is Cemindia Projects Ltd on this list?
EBITDA measures a company's operating performance, its growth signifies an improvement in the efficiency of a company. Cemindia Projects Ltd EBITDA is 10.58 B INR, and current EBITDA margin is 10.31%. See more stats in Cemindia Projects Ltd financial statements.
Like other stocks, CEMPRO shares are traded on stock exchanges, e.g. Nasdaq, Nyse, Euronext, and the easiest way to buy them is through an online stock broker. To do this, you need to open an account and follow a broker's procedures, then start trading. You can trade Cemindia Projects Ltd stock right from TradingView charts — choose your broker and connect to your account.
Investing in stocks requires a comprehensive research: you should carefully study all the available data, e.g. company's financials, related news, and its technical analysis. So Cemindia Projects Ltd technincal analysis shows the buy rating today, and its 1 week rating is buy. Since market conditions are prone to changes, it's worth looking a bit further into the future — according to the 1 month rating Cemindia Projects Ltd stock shows the buy signal. See more of Cemindia Projects Ltd technicals for a more comprehensive analysis.