In-depth trading ideas
Ross Stores (ROST) Pullback Presents Buying OpportunityROST is attracting buying interest following its recent retracement. The stock remains in a strong uptrend, making higher highs and higher lows while trading above well-aligned 20 and 50-day moving averages, signaling continued bullish momentum.
Ross Stores, Inc. is a $74.89 billion market capitalization company that operates off-price retail apparel and home accessories stores. Through its Ross Dress for Less and dd's DISCOUNTS brands, the company offers branded and designer apparel, accessories, footwear, and home fashions at compelling value prices. Its off-price business model and efficient inventory management have enabled the company to establish a durable competitive position within the retail industry.
ROST is a wide economic moat company that has consistently grown both revenue and earnings per share over the last three quarters. The company maintains healthy profitability, with operating and net margins of 13% and 11%, respectively. Return on equity (ROE) and return on invested capital (ROIC) are an impressive 39% and 24%, reflecting strong capital efficiency and shareholder value creation. Ross Stores also maintains a solid financial position, with a current ratio of 1.5x and a debt-to-equity ratio of 0.8x, providing financial flexibility to support future growth initiatives.
Buy ~ $ROST — Steady Uptrend with Strong Fundamentals As you can see, this stock has been maintaining a steady and consistent uptrend, showing strong price structure over time.
On the fundamental side, the story remains equally compelling, with a healthy upward revision to full-year guidance and notable confidence from major institutions that have been aggressively raising their price targets.
Management also increased full-year EPS guidance to a range of $7.50 to $7.74, up from the previous $7.02 to $7.36, which comes in comfortably above Wall Street’s pre-earnings consensus of around $7.31 to $7.32. Overall, both the technical trend and improving fundamentals appear aligned, supporting the ongoing bullish momentum.
ROST — 98% Bull Signals, Whale Sell, Bear Volume at CeilingPrice is at 213.52 with no futures market. The bias reads 98.4% bull against 1.6% bear across 112 signals — the most extreme directional reading in this entire series by a significant margin. Clarity at 52% is the highest of the group. Retrace is only -1.5% with a 15.6% bounce target at 10.3x Para. On paper this looks like an unambiguous long setup. The volume tells a completely different story.
MTF scoring is 57 green to 1 red. That near-perfect score is extraordinary. EMA at 14:0 — unanimous across every timeframe. Ichi TK at 11:0 — unanimous trend confirmation. Candle at 13:1. SS/DD at 7:0 — full demand dominance at the price layer. Engulf at 4:0. Spread at 96.6% Extreme. Every signal layer in the system is pointing the same direction. This kind of signal uniformity is rare.
And yet.
Vol Z at 3.01 is flagged Extreme — the highest volume Z-score of any setup covered today. Dollar volume at 1.65B is elevated. The direction is Bear Dom. Bull:Bear Z reads -0.77 against 3.58 — the bear volume Z is nearly five times the bull volume Z. That inversion between signal bias and volume direction is the most extreme conflict in this entire series. Momentum is Accelerating at 3.47, the highest momentum reading of the group. S.Mom is expanding at 205.3%.
The Whale signal reads SELL. Whale activity at extreme volume with bear dominance and a 3.58 bear Z is institutional distribution — the same pattern seen in MRNA but more extreme. Price percentile is at 100%. Ceiling. ROST is sitting at the absolute top of its 126.62 to 213.52 historical range with the highest volume Z, the highest bear Z, a Whale Sell flag, and Bear Dom direction.
OBV Z at 2.24 is Inflow — the one volume signal aligning with the bullish bias. But OBV inflow against whale selling and 3.01 extreme bear-dominant volume at the range ceiling is a conflict that historically resolves in favor of the larger institutional flow, not the OBV trend.
Bull scenario: The 57:1 signal split is so extreme that price is simply grinding higher against all rational volume-based concerns. EMA 14:0 and Ichi TK 11:0 unanimity sustains into price discovery above the historical range. This would require the whale selling and bear volume dominance to be absorbed completely — possible in a momentum-driven market but the risk-reward at 100th percentile makes this a low-conviction add.
Danger scenario: Whale Sell at extreme volume with Bear Z at 3.58 is the tell. Distribution at the range ceiling into a near-perfect signal structure is textbook smart money behavior — selling into strength while retail signals are maxed out. When the signal structure eventually cracks from 98.4% bull, the unwind tends to be fast. The 10.3x Para multiplier becomes irrelevant if price rolls from the ceiling.
The setup is a direct collision between the cleanest signal structure of the series and the most aggressive distribution volume of the series. Both cannot be right. The Whale Sell at 100th percentile is the signal that has historically been harder to fade.
ROST pressing highs ahead of earnings — momentum favors upside:Current Price: 205.64 (Analysis was generated on Monday Morning)
Direction: LONG
Confidence level: 68%(X sentiment shows clear bullish bias with multiple traders expecting upside ahead of earnings, and price is holding above key support levels. Confidence is moderated due to limited YouTube trader data.)
Targets
Target 1: 210.00
Target 2: 214.00
Stop Levels
Stop 1: 201.00
Stop 2: 196.00
Key Insights:
Here’s what’s driving this setup. ROST is trading just below its recent highs while staying comfortably above its 20‑day and 50‑day moving averages. Several traders are framing this as constructive consolidation rather than exhaustion. Momentum indicators shared across the trading community show RSI still below overbought territory, suggesting there’s room to run if buyers step in on volume.
What really stands out is the timing. Traders are openly positioning ahead of the March 3 earnings call, with many expecting another solid quarter driven by strong same‑store sales and discount retail demand. The crowd is treating pullbacks toward $200–$202 as opportunities rather than warning signs, which tells me sentiment is leaning toward continuation, not reversal.
Recent Performance:
ROST has climbed steadily over recent weeks, pushing into the $200+ zone and flirting with 52‑week highs. Even on lighter volume sessions, the stock has refused to break down, holding gains and forming an ascending channel. That kind of price behavior usually signals accumulation rather than distribution, especially when the broader retail sector is holding up.
Expert Analysis:
Several professional traders I track are watching the $202–$205 area closely. Holding above this range keeps the short‑term trend intact and opens the door for a push into the low $210s. A few traders did flag the risk of a brief pullback if volume stays thin, but notably, they framed that as a dip‑buying scenario, not a trend change. The consensus takeaway is simple: above $196 support, bulls stay in control.
News Impact:
The upcoming Q4 FY 2026 earnings call is the main catalyst. Traders expect management commentary on store expansion and consumer demand to be just as important as the headline numbers. Any upside surprise or confident guidance could spark a fast move through resistance, especially given how lightly positioned some funds still appear to be in discount retail.
Trading Recommendation:
Putting it all together, I’m staying LONG on ROST this week. I like entries near current levels or on shallow dips, targeting $210 first and $214 if earnings momentum carries through. I’m keeping risk defined with a stop at $201, and a wider protection level at $196 in case of an earnings‑driven shakeout. This isn’t a blind hold — watch volume and the post‑earnings reaction closely — but the balance of trader sentiment and price structure favors upside continuation.
ROST Breaks Higher as Strong Uptrend and Volume Confirm StrengthROST is in a strong ascending trend, supported by increasing volume, signaling rising institutional interest. The stock continues to print higher highs and higher lows, while holding firmly above key moving averages, reinforcing the prevailing uptrend. Price is currently in a breakout phase, trading approximately 3% above the breakout level, which suggests momentum remains intact, though short-term consolidation is possible.
Ross Stores, Inc. operates off-price retail apparel and home accessories stores, offering branded and designer apparel, footwear, accessories, and home fashions through its Ross Dress for Less and dd’s DISCOUNTS banners. Fundamentally, ROST is a wide economic moat company, having delivered three consecutive quarters of revenue growth and two quarters of earnings growth over the last three quarters.
Profitability remains solid, with ROE above 37%, ROIC above 21%, and net margins exceeding 9% over the past five quarters. The balance sheet is also robust, supported by healthy liquidity with a current ratio of 1.5x and prudent leverage reflected in a debt-to-equity ratio of approximately 0.9x, positioning the company well for continued growth. NASDAQ:ROST
ROST - Ross Stores - Broke previous High and back for Re-testHello Everyone, Followers,
Second one and probably last one from me for today is ROST - Ross Stores Inc.
What they do
Ross Stores is a major U.S. off-price retailer. They operate the flagship “Ross Dress for Less®” chain—the largest off-price apparel & home fashion chain in the U.S.—plus the dd’s DISCOUNTS® chain. They offer name-brand and designer apparel, accessories, footwear and home fashions at discounts of ~20-60% (and up to ~70% for dd’s) vs typical department/specialty store pricing. Headquartered in Dublin, California.
Latest Commercial / Strategic Highlights
- Ross plans to open ~90 new stores in fiscal 2025 (~80 Ross Dress for Less + ~10 dd’s DISCOUNTS) across the U.S. This expansion includes new entry into markets like Connecticut, Minnesota, New Jersey and New York.
- The company entered into a new senior unsecured revolving credit facility of US$1.3 billion (effective June 27, 2025) replacing its prior facility, enhancing liquidity and financial flexibility.
Financial Snapshot & Key Metrics
Market Cap ~ US$50.9 billion
Revenue (FY 2024) ~ US$21.1 billion.
P/E Ratio (Trailing) ~ 24.9×
Dividend Yield ~ 1.01%
Financially i find them quite good and they have enough cash on their hand continue to pay Dividends.
Technical Part:
Last week on Monday it broke to previous high resistance level and closed the day over this level. Following days it closed the small Gap and i am considering this movement as Re-test to previous high level.
My expectation for ROST is , it will maintain this momentum and continue to go high.
Its ATH level is 163.60 and if it can break the this level and close over it then my final Price target for short term is 185- 186.
If it go back more and hit to 155- 155.50 then we can try to buy in this level. If you do not want to take more risk then you can wait to break 163.60 then buy for short term.
Second option is if it closes below 155 then there is a possibility to hit 149-149.50 then this level could be a good level to buy.
My Expectation: It will maintain the momentum and first hit to ATH level. Then I need to have a look again. Short term price target is 185 - 186 which ic over approx %16 , not bad for a short term :).
This is just my thinking and it is not invesment suggestion , please do not make any decision with my anaylsis.
Have a lovelly Sunday to all and Good Start a Week.
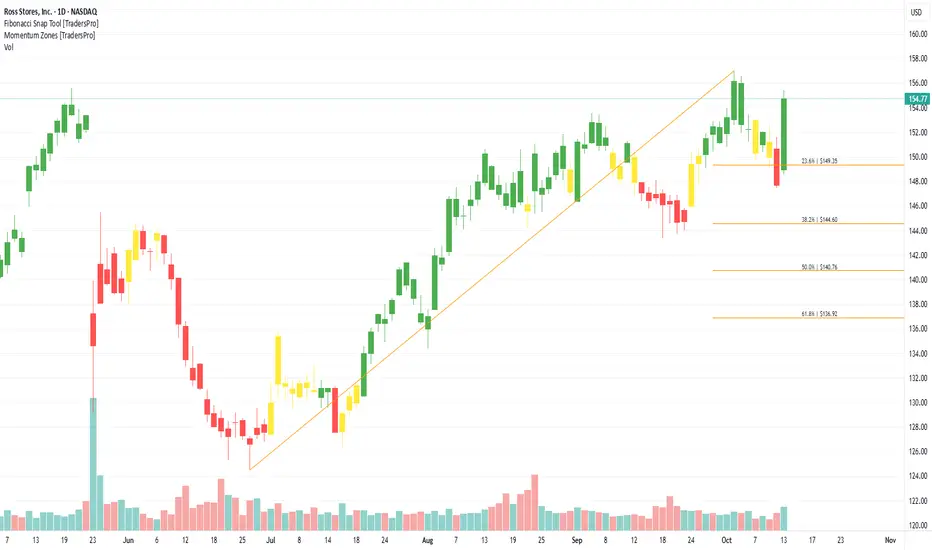
Ross Stores, Inc. (ROST) Grows With Consumer Value FocusRoss Stores, Inc. (ROST) is a leading off-price retailer offering name-brand apparel, footwear, and home fashions at discounted prices. With over 2,000 stores across the U.S. under the Ross Dress for Less and dd’s DISCOUNTS banners, the company attracts value-conscious shoppers in all markets. Ross’s growth is fueled by strong consumer demand for affordable fashion, strategic expansion in new locations, and consistent inventory management that supports profitability.
On the chart, a confirmation bar with rising volume highlights bullish momentum. The price has entered the momentum zone after breaking above the .236 Fibonacci level. A trailing stop can be placed just below this Fibonacci line using the Fibonacci snap tool, helping traders secure profits while staying positioned for further upside potential.
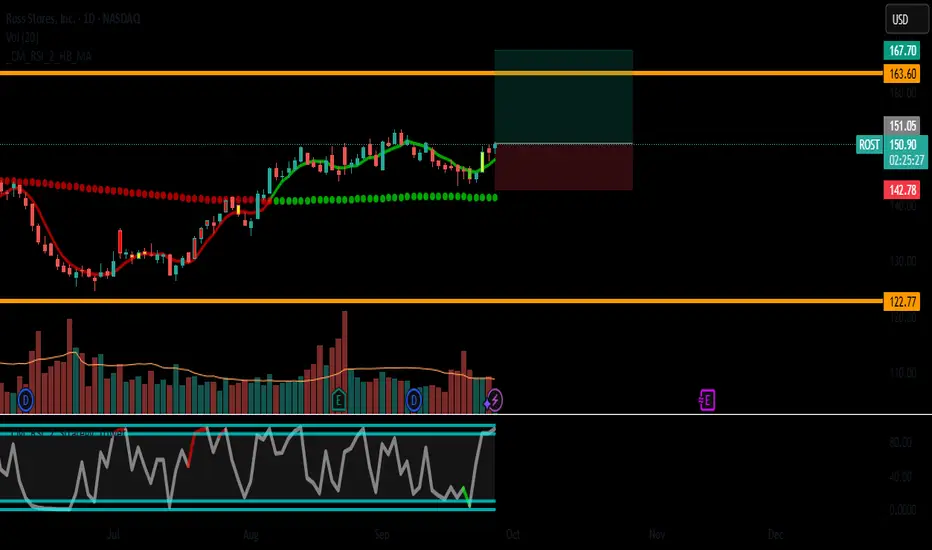
ROST - Strong Fundamental + Technical Breakout Setup**Title: ROST - Strong Fundamental + Technical Breakout Setup | Long Entry $150.9**
---
**📈 Ticker:** ROST (Ross Stores Inc.)
**📍 Recommendation:** LONG
**⏰ Timeframe:** Swing to Position Trade (1-4 weeks)
---
### **🎯 Trade Idea Summary**
- **Entry:** $150.90 (on pullback or breakout confirmation)
- **Stop Loss:** $142.70 (-5.4%)
- **Take Profit:** $167.70 (+11.1%)
- **Risk/Reward Ratio:** 1:2.05
---
### **📊 Fundamental Justification**
- **Score Fundamental:** 5/9 (Solid)
- **Revenue Growth:** Moderate
- **Net Income Growth:** Strong
- **Debt Health:** Excellent (Score 10/10)
- **Valuation:** Fairly valued based on P/E
- **Strong balance sheet with low debt and high interest coverage**
---
### **📈 Technical Analysis**
- **Trend:** Daily trend ↗️ Alcista, 4H Bajista pero 1H Alcista (mixed)
- **RSI:** 60.2 – Neutral with upward momentum
- **MACD:** Slightly negative but converging toward signal line
- **Price Action:** Trading above SMA20 ($148.59) and SMA50 ($145.05)
- **Key Support:** $148.50 (SMA20), $145.00 (SMA50)
- **Key Resistance:** $152.50 (recent high), then $160.00
---
### **🔍 Additional Confirmation**
- **RSI2 Connors Signal:** Buy signal on Sep 22 – confirms short-term momentum
- **Volume:** Steady accumulation pattern
- **Sector:** Defensive retail – outperforms in volatile markets
---
### **🎮 Trade Management**
- Enter on bounce from $150.00–151.00 zone
- Stop below SMA50 and recent swing low ($142.70)
- Target $167.70 based on measured move from consolidation breakout
- Trail stop upon breaking $160.00
---
### **⚠️ Risks to Monitor**
- Broad market pullback
- Retail sector weakness
- Failure to hold SMA20 support
---
**✅ Conclusion:**
ROST offers a high-probability long setup with strong fundamentals, positive technical structure, and confirmed momentum via RSI2. The 1:2 R/R makes this an attractive swing trade.
Disclaimer:
This post is for educational and informational purposes only and does not constitute financial advice, investment recommendation, or an offer to buy or sell any securities. Trading stocks, options, futures, forex, or cryptocurrencies involves substantial risk of loss and is not suitable for every investor. The trade idea presented is based on the author's analysis and assumptions, which may not be accurate or complete. Past performance is not indicative of future results. You should always conduct your own due diligence and consult with a qualified financial advisor before making any investment decisions. The author may hold a position in the mentioned security at the time of publication.
---
**#ROSS #Stores #SwingTrade #Retail #Breakout #LongSetups #TradingView**
**#FundamentalAnalysis #TechnicalAnalysis #RSI2 #RiskManagement**
ROST Earnings Play: Big Call Setup Ahead of BMO! 🚀 ROST Earnings Play: Big Call Setup Ahead of BMO! (Aug 21, 2025) 🚀
### 🏦 Earnings Outlook
* 📊 **Revenue Growth:** +2.6% TTM – stable retail performance
* ⚖️ **Margins:** Profit 9.8%, Operating 12.2%, Gross 32.8% → strong operational efficiency
* 📈 **Historical Beat Rate:** 100% over last 8 quarters, avg surprise 7.9%
* 🛍️ **Sector:** Apparel Retail – benefiting from value rotation trends
* 🧭 **Analyst Consensus:** Buy (1.7/5.0), forward EPS \$6.69
---
### 🔎 Options Flow Insight
* 📈 **Call Activity:** High call volume at \$150 strike indicates bullish sentiment
* ⚖️ **Put Activity:** Significant open interest at \$144 for institutional hedging
* 🏦 **IV:** Moderate at 0.70, offering favorable earnings options play
---
### 📉 Technical Setup
* 📊 **Current Price:** Trading above 50 & 200-day MAs
* 🔑 **Support:** \$144
* 🔑 **Resistance:** \$160
* 💥 **RSI:** 67.35 → slight overbought, but bullish momentum
---
### 🎯 Trade Setup (Earnings Play)
* 🟢 **Direction:** CALL (Bullish Bias)
* 🎯 **Strike:** \$150.00
* 💵 **Entry Price:** \$2.80
* 📅 **Expiry:** Aug 22, 2025
* 📊 **Size:** 1 contract
* 🕒 **Entry Timing:** Pre-earnings close (BMO)
📌 **Profit Target:** \$8.40 (200-400% potential 🚀)
📌 **Stop Loss:** \$1.40 (50% of premium)
📌 **Exit Rule:** Within 2 hours post-earnings or target hit
---
🔥 Hashtags for Maximum Reach 🔥
\#ROSTEarnings #ROSTOptions #EarningsPlay #RetailStocks #OptionsTrading #BullishCall #DayTrading #SwingTrading #WallStreet
Ross Stores Faces Crucial $150 Resistance TestTrend:
The stock has remained inside a descending channel since Aug 2024. Price is currently testing the upper trendline resistance at $150–151, a level where it has been repeatedly rejected.
Momentum Indicators:
RSI (60.3): Slightly bullish but shows bearish divergence vs price → signals weakening momentum.
MACD: Bullish but flattening, suggesting fading momentum; a bearish crossover could confirm downside.
Trade Plan-Bearish Setup (base case – rejection at resistance)
Entry (Short): $145–147 zone
Stop-Loss: $150.60-152 (above trendline)
Targets: $144.43,$140.62,$138.91,$137.54, and even lower, if bearishness persists.
ROST is correcting and that's OK - Long at 141.28People get panicky during corrections. Understandably, it can be nerve-wracking watching that stock you were sure was going up, going down. With the short term nature of the trading I'm doing, I don't worry that much, and especially when the corrections are garden variety ones.
ROST is down almost 10% since Dec 5th. That's a normal correction, especially for ROST. It's done that (or more) 4 times in the last 11 months, coming all the way back or more each time. Now I'm not predicting it will this time, too. The whole point of short term trading is not having to worry about earnings, the economy, who we enter a trade war with, etc.
But it is important to keep perspective and zoom out every once in a while. Looking too closely at the last two weeks for this stock could be unnecessarily frightening. 7 down days in the last 8. 4 in a row. Zooming out lets me realize that what's going on here isn't necessarily a crisis. It's (no pun intended) business as usual.
It helps that NASDAQ:ROST is one of my better stocks for trading the way I do. It also helps that there is some support relatively close. It helps that I have over 1100 backtested and real trades in ROST to look back on. When the history of the stock is 1122-2 (the 2 are the last two days), it makes the 10% drop lately seem less worrisome. Data is comforting in times of stress.
And those are lessons for everyone's trading, I think. Look at the big picture before getting nervous about the small one. Collect data on your trades, and let that story of success keep you calm in difficult times. And if it's a story of a lack of success, then at least you can avoid a mess before it happens and work on developing something new.
Per my usual strategy, I'll add to my position at the close on any day it still rates as a “buy” and I will use FPC (first profitable close) to exit any lot on the day it closes at any profit.
As always - this is intended as "edutainment" and my perspective on what I am or would be doing, not a recommendation for you to buy or sell. Act accordingly and invest at your own risk. DYOR and only make investments that make good financial sense for you in your current situation.
Second $ROST entry on bullish confirmation!Key Stats:
Market Cap: $51.9B
P/E Ratio: 24.65 (sector average ~22.5)
Free Cash Flow: $1.6B TTM
Next Earnings Date: March 4, 2025
Technical Reasons Supporting an Increase:
Ascending Channel Formation: ROST continues to trend upward within a well-defined ascending channel, targeting the upper band near $190.
Key Moving Averages Bullish Crossover: The 50-day SMA just crossed above the 200-day SMA—hello, golden cross.
RSI Momentum Breakout: RSI (14) remains at a healthy 62, suggesting bullish momentum without overbought conditions.
Fundamental Reasons Supporting an Increase:
Strong Q3 Earnings Beat: Revenue up 8% YoY with EPS growth of 12% (Q3 FY24). Management raised FY guidance, reinforcing investor confidence.
Off-Price Retail Resilience: Amid inflationary pressures, ROST’s model thrives by offering value-conscious customers an edge.
Expansion Plans On Track: 100 new stores planned by 2025, creating a pathway for revenue growth and broader market penetration.
Potential Paths to Profit:
Option 1 (Lowest Risk): Buy shares outright and hold.
Option 2 (Moderate Risk): Buy LEAP calls for potential returns based on implied move calculations.
Disclaimer:
We are not a brokerage or investment firm. We do not offer financial advice or investment advice and/or signals. This is not certified financial education. We offer access to the daily thought process of an individual and his experiences. We do not offer refunds. All sales are final.
You need $ROST to spell PROFITSKey Stats
Current Price: $154.87
52-Week Range: $113.77 - $159.16
P/E Ratio: 24.38 (moderate valuation for retail)
Market Cap: $51.38B
Revenue Growth: +5.8% forecasted YoY for FY 2025
Next Earnings Date: March 4 2025
Top 3 Technical Reasons ROST Will Increase:
Breakout Setup: The stock recently hit a resistance level at $155, forming a bullish continuation pattern. With strong volume, it could rally toward $190 over the next year.
Golden Cross Signal: The 50-day MA recently crossed above the 200-day MA, a classic bullish indicator.
RSI Momentum: Currently hovering, indicating bullish momentum without being overbought.
Top 3 Fundamental Reasons ROST Will Increase:
Steady Revenue Growth: Analysts forecast 5.8% revenue growth for FY 2025, driven by store expansion and strong discount retail performance in economic slowdowns.
EPS Projections: EPS is expected to grow by 8.2% next year, reflecting strong operational efficiency.
Defensive Industry Positioning: As a leading off-price retailer, Ross Stores thrives in economic uncertainty, attracting value-conscious consumers
Potential Paths to Profit:
Lowest Risk: Purchase shares directly and hold until the target price of $190 is reached.
Buy LEAPS Jan 2026 $160 calls (current premium ~$15) for long-term upside.
Bull Call Spread: Buy the $160 call and sell the $190 call for a cost-efficient play.
Covered Calls: Own the stock and sell $190 calls expiring in mid-2025 for income while waiting for appreciation.
Disclaimer: We are not a brokerage or investment firm. We do not offer financial advice or investment advice and/or signals. This is not certified financial education. We offer access to the daily thought process of an individual and his experiences. We do not offer refunds. All sales are final.
Ross Stores: Pullback Near HighsRoss Stores rallied in the winter. Now, after a period of consolidation, some traders may see potential for further upside.
The first pattern on today’s chart is the pair of bullish gaps after the last two earnings reports. The first gap sent the retailer to new highs above its 2021 peak. The second reestablished it above its 50-day simple moving average (SMA).
The price jumps could reflect positive fundamentals. The move above the 50-day SMA may suggest the intermediate-term trend has gotten more bullish again. Also notice the latest pullback.
Next, ROST made a weekly low of $142.65 on June 11. Last week it tested and held that level. Has new support been established near old highs?
Third, higher weekly lows occurred along the 200-day SMA in May. That could suggest its longer-term trend is upward.
Last, stochastics have dipped to an oversold condition.
TradeStation has, for decades, advanced the trading industry, providing access to stocks, options and futures. See our Overview for more.
Past performance, whether actual or indicated by historical tests of strategies, is no guarantee of future performance or success. There is a possibility that you may sustain a loss equal to or greater than your entire investment regardless of which asset class you trade (equities, options or futures); therefore, you should not invest or risk money that you cannot afford to lose. Online trading is not suitable for all investors. View the document titled Characteristics and Risks of Standardized Options at www.TradeStation.com . Before trading any asset class, customers must read the relevant risk disclosure statements on www.TradeStation.com . System access and trade placement and execution may be delayed or fail due to market volatility and volume, quote delays, system and software errors, Internet traffic, outages and other factors.
Securities and futures trading is offered to self-directed customers by TradeStation Securities, Inc., a broker-dealer registered with the Securities and Exchange Commission and a futures commission merchant licensed with the Commodity Futures Trading Commission). TradeStation Securities is a member of the Financial Industry Regulatory Authority, the National Futures Association, and a number of exchanges.
TradeStation Securities, Inc. and TradeStation Technologies, Inc. are each wholly owned subsidiaries of TradeStation Group, Inc., both operating, and providing products and services, under the TradeStation brand and trademark. When applying for, or purchasing, accounts, subscriptions, products and services, it is important that you know which company you will be dealing with. Visit www.TradeStation.com for further important information explaining what this means.
Ross Stores Stock Jumps 8.34% on Earnings BeatRoss Stores ( NASDAQ:ROST ) has reported better-than-anticipated results and raised its guidance as it reduced costs. The off-price apparel and home goods retailer beat profit and sales forecasts, despite facing macroeconomic headwinds that squeezed its lower-income customers. CEO Barbara Rentler said the results came even as the company faced macroeconomic headwinds that squeezed their discretionary spending.
Ross Stores( NASDAQ:ROST ) reported first-quarter earnings per share (EPS) of $1.46, up from $1.09 a year ago, and revenue gained 8% from the year-ago quarter to $4.86 billion. Both exceeded forecasts. Same-store sales rose 3%. The improvement in profit stemmed primarily from reduced costs, as the company slashed expenses by $1 billion from the fourth quarter. Operating margin jumped 205 basis points to 12.2%, attributed mainly to lower distribution, incentive, and freight costs that were partially offset by the planned decline in merchandise margin.
Ross Stores ( NASDAQ:ROST ) CEO Barbara Rentler said that continued uncertainty in the macroeconomic and geopolitical environments, including inflationary pressures, "continue to squeeze our low-to-moderate income customers' purchasing power." She said the company would keep managing inventory and expenses "tightly" to maximize sales and earnings growth the rest of the year. Based on first-quarter results and forward guidance, Ross Stores boosted its full-year EPS outlook to a range of $5.79 to $5.98, up from the previous estimate of $5.64 to $5.89.
Ross Stores shares ( NASDAQ:ROST ) is up 8.3% at $142.72 as of the time of writing on Friday and have gained about 3% since the start of the year. The company's results echo that of its off-price peer TJX Cos, which posted better-than-expected first-quarter results and raised its annual profit forecast helped by easing costs and strong demand. With a Relative Strength Index (RSI) of 68.19, the stock is poised for further gains.
5/23/24 - $rost - a +ve EPS setup, but watching from parking lot5/23/24 - vrockstar - NASDAQ:ROST - a good play on affordability like NASDAQ:COST NYSE:BJ (which reported good #s in this AM) and then we even see semi-discretionary stuff that's still discretionary makeup ( NYSE:ELF ) doing fine. it's the pricey and let's wait category (or let's finance it category too) that are suffering the shoot-stock-first-figure-out-where-the-bottom-is-later. i'd post that 22x PE on this, positive growth, albeit MSD, and 4-5% fcf yield would probably be a "buy" all else equal in this tape. i'm not going to play this, similar to NYSE:DECK - same "vein" of thinking/ name here (though i prefer brands vs. sellers-of brands all else equal, even if the multiple is 50% more expensive). gl to the holders, will be rooting you on in this as well.
Intuition stock short ROST tgt $95I never had time this weekend to meditate and fish through time and space for a ticker, so while lying in bed I had the thought I should try to get something. Pretty immediately I "heard", "Ross dress for less." I'm assuming it's the stock and not a recommendation to shop cuz I actually hate my local store and refuse to go.
It seems like when these pop in super fast they're super good, though TXN is a bit slow atm.
The number that floated in was 14, so when I saw they closed Friday at $112.xx I decided this was for realz. Obviously it's at $114 today. I had my intuitive symbol for down float into mind, and sensed we're to expect down.
I didn't spend more time on it other than to dowse just now. The target I get is $95 and that it will be reached. I don't give a target any longer unless I get this verification as it's becoming pretty reliable. The "big idea" is a breakdown, so that validates my intuition. Whether I'm correct will be another matter!
Like other tickers/indexes I've inquired on today, there's an indication of going up into Thursday. NFP Friday could shake things up, but at this point, I'd be good shorting this late this week.
I'll update if there's anything sketchy when I check on it on Thursday. Not looking at much upside. Maybe to $118-19