Technical and Fundamental Assessment of Genmab
Technical Analysis
Genmab has been in an upward trend since the beginning of April 2025. The trend is only partly supported by the moving averages (MA) and is weakened by a declining RSI-21. The price is currently below or near the lower edge of a red Ichimoku cloud and is trading in the lower par
Compare with Genmab A/S
1.28 USD
965.95 M USD
3.73 B USD
586.56 M
Next report date
—
Report period
—
EPS estimate
—
Revenue estimate
—
Company info
Sector
Industry
CEO
Jan G. J. van de Winkel
Website
Headquarters
Copenhagen
Founded
1998
IPO date
Oct 1, 2000
ISIN
US3723032062
CUSIP
372303206
FIGI
BBG004MPKM64
Identifiers
ISIN US3723032062
Genmab A/S is an international biotechnology company, which engages in the development of human antibody therapeutics for the treatment of cancer and other diseases. Its product pipeline includes daratumumab, marketed as DARZALEX for the treatment of certain indications of multiple myeloma, teprotumumab-trbw marketed as TEPEZZA for the treatment of thyroid eye disease, and ofatumumab, marketed as Arzerra for the treatment of certain indications of chronic lymphocytic leukemia. The company was founded by Donald Lee Drakeman, Florian Schonharting, and Jan G. J. van de Winkel on June 11, 1998, and is headquartered in Copenhagen, Denmark.
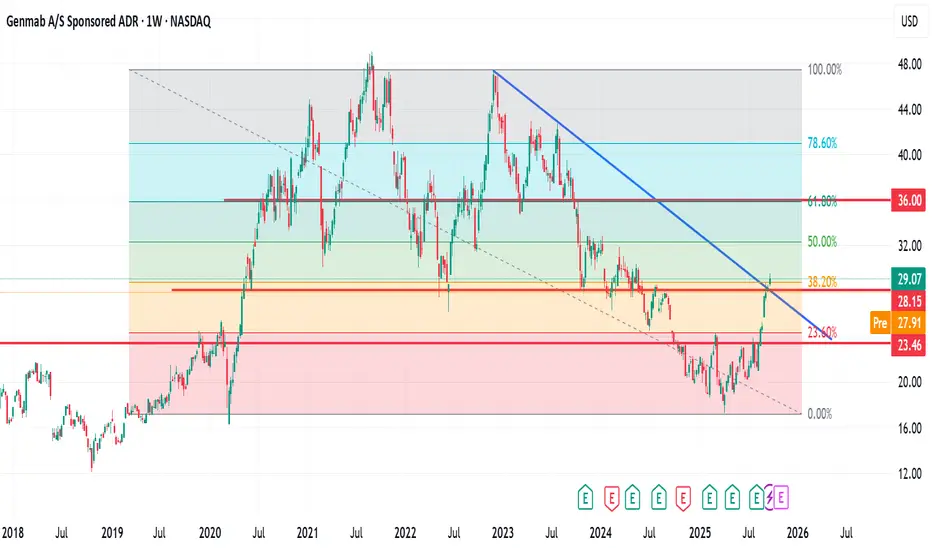
GMAB at a Critical Confluence Zone – Potential UP or down?GMAB at a Critical Confluence Zone – Potential Breakout or Reversal?
GMAB has shown strong recovery momentum since its April 7th, 2025, low. The price is currently testing a significant confluence area formed by a descending trendline and the Fib 38.2% support level.
If price action holds above th
GMAB - Top Fundamental Quality + Strong Uptrend**Title: GMAB - Top Fundamental Quality + Strong Uptrend | Long Entry $29.10**
---
**📈 Ticker:** GMAB (Genmab A/S)
**📍 Recommendation:** LONG
**⏰ Timeframe:** Position Trade (2-8 weeks)
---
### **🎯 Trade Idea Summary**
- **Entry:** $29.10 (on pullback to support)
- **Stop Loss:** $25.99
GMAB / GENMAB / Likely this is the scenarioThe last 10 Years give us an idea how this stock moves.
Today i bough some expecting around 20% profit until End of July.
I look at Seasonality / seasonal price tendencies and identified a good period to be long in that stock. I have confidence in that and my entry was the break of yesterday candle.
See all ideas
Summarizing what the indicators are suggesting.
Neutral
SellBuy
Strong sellStrong buy
Strong sellSellNeutralBuyStrong buy
Neutral
SellBuy
Strong sellStrong buy
Strong sellSellNeutralBuyStrong buy
Neutral
SellBuy
Strong sellStrong buy
Strong sellSellNeutralBuyStrong buy
An aggregate view of professional's ratings.
Neutral
SellBuy
Strong sellStrong buy
Strong sellSellNeutralBuyStrong buy
Neutral
SellBuy
Strong sellStrong buy
Strong sellSellNeutralBuyStrong buy
Neutral
SellBuy
Strong sellStrong buy
Strong sellSellNeutralBuyStrong buy
Displays a symbol's price movements over previous years to identify recurring trends.
Maturity dateDec 15, 2033
Coupon7.25% (Fixed)
Maturity dateDec 15, 2032
Coupon6.25% (Fixed)
See all GMAB bonds