$DOGE emerging from ocean depths Bouncing off major horizontal support. Monthly RSI curling up from its lowest print on record.Longby CryptoSurf223
DOGE: $0.085 | for the Good of Humanitywhere it all started a fork of a fork a derivative a speculation a meme a movement a platform an Elon an ABRSOLTE TRUTH powered by Royal Arabs of Dubai and Crazy Rich Asians it shall be GLORiOUS again as always in the past and moving forward by senyor10x15
DOGEUSD - Moves Up Sharply in Cycles Like TSLA TSLA and DOGE share chart similarities especially in the way they pump very fast and then move sideways for multiple years I noticed this on my last chart made for TSLA Bullish on this long term timeframe for both TSLA and DOGECOIN by Bixley24
DOGE JUST HIT A HISTORICAL EXTREME.13 years of data. RSI is at an all time low. DOGE is sitting on its long term cycle floor. And against NVIDIA, relative valuation is back near the same type of extreme zone that preceded previous major DOGE expansions. The market sees weakness. I see one of the most asymmetric DOGE setups in its history. Fear is obvious. Opportunity is not.Longby Cryptollica28
Twice Rejected at 0.0895. The Anchor Is Catching Up.Neutral / long-biased above 0.0856 Doge sat between 0.0687 and 0.0725 for five weeks. Three sessions in late August took it to just above 0.1000. That is a 43% expansion off the base, and almost none of it built volume. Two weeks have passed since. Price has gone nowhere. That is not failure. It is the market deciding whether 0.0800 to 0.0900 is a price it accepts, having never traded there before 20 August. Where structure sits Price 0.08786, +2.02% on the session Swing AVWAP 0.0856, rising Deviation +2.67% PDH 0.0885 PDL 0.0840 POC 0.0700 Supply band 0.0885 to 0.0900 Bias BULLISH Two levels do all the work here The first is the 0.0885 to 0.0900 band. It is the prior-day high, and it is the last stretch of real traded volume before the profile empties. Price has been sent back from it twice at nearly the same price. 27 August topped at 0.0899. 3 September topped at 0.0897. Both closed back inside the range within two bars. Equal highs at a volume shelf are supply being respected, not supply being worked through. The second is 0.0856, the swing AVWAP. That is the average price paid by everyone who bought the expansion. On 20 August it sat at 0.0785, far under the market. It has risen every session since and is now inside the range. On 4 September price traded through it to 0.0848 and closed back above on the next bar. Cost basis was tested once and it held. Compression Highs: 0.1008, 0.0959, 0.0899, 0.0897. Lows: 0.0835, 0.0812, 0.0815, 0.0848. The anchor: 0.0785, rising without a down session, now 0.0856. The first leg spanned 20%. The current one spans under 6%. The ceiling has stopped falling and the cost basis is climbing straight into it. Ranges that tighten into cost basis resolve. They do not drift. What I am watching Upside: two 4H closes above 0.0900, not a wick. That clears the only shelf holding this back. Above it the profile is close to empty all the way to the 22 August high, because that ground was covered in one session and never revisited on volume. Thin tape does not slow a move. Downside: loss of 0.0856 puts price under the average cost of the expansion for the first time since 20 August. Below sits 0.0840, then the 0.0812 shelf that has held twice. Under 0.0812 the profile is hollow back to 0.0725, and the only real acceptance in this chart is the POC at 0.0700. Constructive while the anchor rises and price keeps closing above it. Not constructive the moment 0.0856 stops holding. Chart: Institutional Volume Map.by Thecantillonreport0
DOGE: The Dogecoin Return#Dogecoin has been among the most traded assets recently. As a market leader, bullish sentiment around it could positively influence the broader market. Currently forming a major triangle structure that could set the stage for a long-term upward move. On the LTF, the initial target is the $0.20 range.Longby MohamedSewid11
Goals RationaleThe bullish reaction to cryptocurrency dominance has, technically speaking, reached the minimum expected level. In other words, a reversal could occur from these levels. This is my base case scenario. However, structurally, there is a possibility that the bullish rally will continue all the way to the peak of Wave 1. We’re waiting for confirmation. I’ll reiterate my targets for DOGE: 0.0324 - the minimum anticipated target, and 0.0085 - the structurally likely target. If the bullish-pullback rally continues, DOGE could reach the 0.16–0.23 range. This will largely depend on confirmation from the US02Y chart. It makes sense to consider a bull market scenario and its targets if USDt stable-coin dominance falls below the peak of Wave 1, i.e., 5.713%. by dogecoin_chain1
Dodge is bearishcoin is reacting to level and bounce back heading south toward tp @161% fibo level . keep observing the coin for entering short as recommended Shortby MtICHIUpdated 110
DOGE: Multi-Year Correction May Be Entering Its Final PhaseDogecoin has spent years correcting the move that took it from virtually nothing to its 2021 peak. But what if this prolonged correction is now approaching its final stage? The weekly structure suggests DOGE may be developing a large-scale triangle, with price currently returning to the 0.786–0.886 retracement region. If this interpretation is correct, the current weakness may not be the beginning of another major decline, but part of the process of completing a much larger corrective structure. -- A Correction Measured in Years DOGE's major impulsive structure began from the 2015 low and eventually produced the historic advance into the 2021 peak. From there, the market entered a prolonged correction. What makes the current structure interesting is its duration. This is no longer a conventional short-term pullback. DOGE has been consolidating for years, and the internal price action increasingly resembles a complex corrective formation rather than a simple five-wave decline. The possibility I am tracking is a large-scale triangle developing from the 2021 high. If this interpretation is correct, DOGE could still have some work to do before the correction is complete. -- The Zone DOGE Is Approaching Price is currently moving back toward the 0.786–0.886 Fibonacci retracement region, an area that deserves attention because it coincides with the lower boundary of the current structure. The market does not necessarily need to reverse immediately from here. In fact, the triangle scenario allows for another decline before the structure is considered complete. A move toward the $0.048984 region would therefore not automatically invalidate the larger bullish thesis. Instead, it could become the next important piece of the corrective structure. This is where the distinction between short-term weakness and long-term structure becomes important. DOGE can continue falling while the broader bullish scenario remains intact. -- The Triangle Scenario Under the primary interpretation, DOGE could continue developing a large triangle before the market finally resolves to the upside. That would mean more consolidation, more volatility and potentially another move lower before the correction reaches completion. The projected structure points toward a possible triangle completion around 2027–2028. That may sound far away, but the timeframe is consistent with the scale of the correction being analyzed. A multi-year correction following a multi-year impulse should not necessarily be expected to resolve within a few months. The bigger question is what happens after the triangle. That is where the setup becomes much more interesting. -- The Bigger Wave Once the corrective structure is complete, the next major move could be a Wave 3 to the upside. The initial projection shown on the chart reaches toward the $0.16 area, but the significance of the move would extend beyond that first target. A genuine Wave 3 would represent a much larger impulsive phase rather than simply another relief rally. In other words, the current correction could ultimately become the foundation for the next major expansion in DOGE. This is also why I am more interested in the structure than in trying to predict the next few weekly candles. -- What Would Change the Thesis? The bullish triangle interpretation has a clearly defined line in the sand. A sustained break below $0.048984 would significantly weaken this scenario and suggest that the correction is taking a different form. Below that level, the chart opens the door to deeper corrective targets, including approximately $0.023238 and $0.007990, with the much lower $0.002747 region representing another major historical support area. These are not my primary targets at this stage. They represent levels to watch if the current structure fails. That distinction is important because Elliott Wave analysis is not about forcing a count onto the market. The structure must continue to validate itself through price action. -- DOGE May Need More Time The most interesting part of this setup is that the bullish case does not require DOGE to rally immediately. Quite the opposite. The market may still need to spend considerable time completing the corrective structure before the larger trend can resume. If $0.048984 continues to hold as the critical invalidation level, the triangle interpretation remains viable. From there, continued consolidation could eventually lead to the larger upside resolution projected on the chart. So while DOGE may not be ready for its next major move yet, the long-term structure is becoming increasingly interesting. The correction may not be the story. It may be the preparation for the next one. by Kap_Waves10
(DOGE) dogecoinHypothetically, Dogecoin while listed to Coinbase has never been in the black. If the chart is true and the choice to list Dogecoin happened at the peak of it's price popularity, Coinbase is synonymous with listing companies at their peak leaving new investors to have to wait until troublesome bottoms years later to actually find interest in investing in the company. Dogecoin has never been able to maintain it's price through all the different years of volatility and is the original memecoin, valueless? Obviously, if you were looking at the Robinhood Dogecoin chart the story would be very different. Dogecoin is what kind of made Robinhood a cryptocurrency household name. by CryptocurrencyBlot0
DOGE HAS NEVER LOOKED THIS BADNot once in 13 years. And that is exactly why this may be the best DOGE opportunity we have seen in 13 years. Biggest returns are not built by buying hype. They are built by buying fear, disbelief and total indifference. CRYPTOCAP:DOGE Longby Cryptollica2223
Dogecoin Wave Analysis – 12 August 2026 Dogecoin: ⬇️ Sell – Dogecoin reversed from resistance zone – Likely to fall to support level 0.0675 Dogecoin cryptocurrency recently reversed down from the resistance zone between the resistance level 0.0725 (upper boundary of the sideways price range inside which the price has been moving from July) and the upper daily Bollinger Band. This resistance zone was furthers strengthened by the 38.2% Fibonacci correction of the downward impulse from the start of July. Given the clear daily downtrend, Dogecoin cryptocurrency can be expected to fall to the next support level 0.0675, lower border of the active sideways price range. Shortby FxPro0
BUY LIMIT AT $0.666 Altcoin Optimism at record low. I do project the low for dogecoin at $0.666. Longby WU_WEI-CAPITALUpdated 4
DOGE: Is History About to Repeat Itself?Since the 2021 market top, **Dogecoin has remained trapped inside a well-defined macro downtrend**, consistently producing lower highs while gradually approaching one of the most important technical regions in its entire trading history. This study combines **Anchored VWAP (from inception), Volume Profile, Market Structure, Time Cycles, and Long-Term Trend Analysis** to answer one question: Is DOGE quietly building another long-term accumulation before its next major move? This is not a prediction , but a structural interpretation of the current market. --- ## Looking Beyond Price Most traders focus only on candles. I prefer looking at where the market has historically accepted value. That's why one of the most important tools on this chart is the Anchored VWAP plotted from the very first candle in DOGE's trading history. Unlike a moving average, the Anchored VWAP represents the volume-weighted average price since the asset began trading. Institutional traders often use this metric to evaluate whether an asset is trading above or below its long-term fair value. Interestingly, after every major market cycle, price has eventually gravitated back toward this level. Today, DOGE is once again trading almost exactly around this historical equilibrium. --- ## Volume Profile Tells the Same Story The Volume Profile reinforces this observation. Across multiple market cycles, the largest concentrations of traded volume continue to develop around the current price region. Instead of accepting significantly lower prices, the market repeatedly returns to these high-volume nodes. This behavior often suggests equilibrium rather than panic selling. Whether this equilibrium becomes accumulation remains to be seen. --- ## A Market Running Out of Space The macro structure is becoming increasingly interesting. Since 2021, DOGE has respected a long-term descending trendline while compressing into a progressively tighter range. Volatility continues to contract. Price swings become smaller. The market appears to be running out of space. Historically, extended periods of compression are frequently followed by periods of expansion. The chart does not tell us the direction. It simply tells us that a significant move becomes increasingly likely. --- ## The 50–60 Day Pattern One detail immediately caught my attention. Looking back at previous macro bottoms, DOGE consistently spent approximately 50 to 60 days building a base before beginning its strongest impulsive advances. Not 10 days. Not a few weeks. Nearly two months. The current structure is beginning to follow a remarkably similar timeline. Is this enough to predict another rally? Absolutely not. Markets never owe us repetition. But recurring behavior deserves attention. Sometimes price repeats. More often, it rhymes. --- ## Why This Area Matters From a risk management perspective, the current location is particularly interesting. Several independent technical factors are beginning to converge: - Anchored VWAP from inception. - Historical support. - High-volume acceptance zones. - Multi-year price compression. - Repeating accumulation time cycles. - Declining volatility. None of these signals alone confirms a reversal. Together, however, they create a technical environment that deserves close attention. --- ## What Needs to Happen Next? The bullish thesis remains unconfirmed . For buyers to regain control, I would like to see: - A weekly close above the nearest resistance. - Higher highs and higher lows. - Increasing trading volume. - Acceptance above previous value areas. - A confirmed breakout of the multi-year descending trendline. Until then, this remains a developing structure—not a completed one. --- ## Risk vs Reward This raises the most important question. If previous bottoms required roughly 50–60 days of consolidation before expanding... could history be repeating once again? No one knows. Markets rarely offer certainty. They offer probabilities. From where price currently sits, downside appears increasingly limited by: - Long-term support. - Anchored VWAP from inception. - Historical high-volume acceptance zones. Meanwhile, a confirmed breakout could completely change the long-term market structure. That asymmetry is what makes this setup particularly interesting. Not because a rally is guaranteed... But because the risk-to-reward profile appears increasingly attractive . --- ## Final Thoughts The best opportunities rarely appear when everyone is optimistic. They are usually built during periods of uncertainty, low volatility, and widespread disbelief. Whether DOGE is truly building another accumulation remains unknown. The market will ultimately provide the answer. For now, this is simply one possible interpretation of the current structure. One thing, however, is difficult to ignore: History doesn't have to repeat itself... but markets often rhyme. --- *This study reflects my personal interpretation of the current market structure and should not be considered financial advice. Always do your own research before making investment decisions.* --- ### What do you think? Do you believe DOGE is quietly accumulating for another major cycle, or is this simply another pause before continuation to the downside? I'd love to hear your perspective in the comments.by finalmenterico9
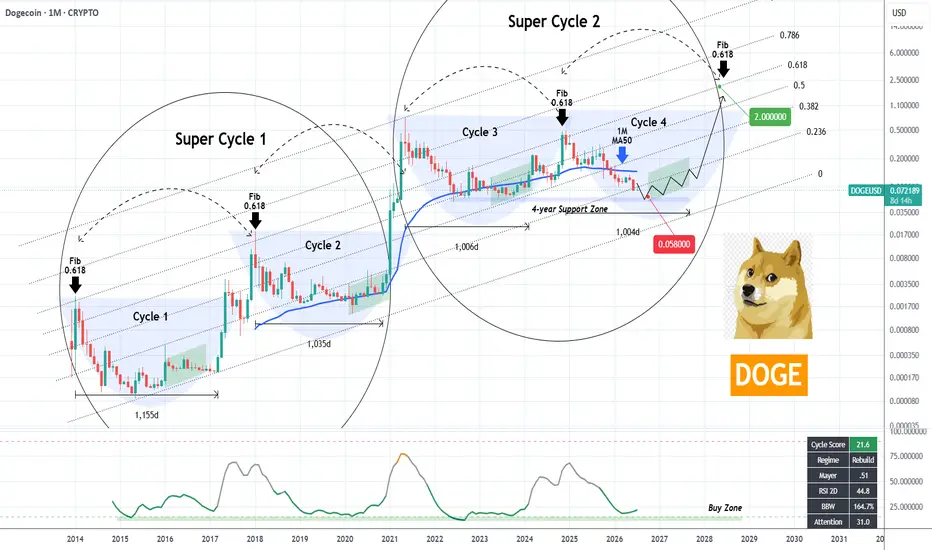
DOGE Super Cycles point to $2.00 for next TopDogecoin (DOGEUSD) is expected to experience some more max pain on the short-term as based on a number of indicators the current Cycle (no 4) hasn't yet bottomed. The bottom is located on its 4-year Support Zone, whose upper level is around $0.0580, while at the same time the Cycle Score indicator has to historically enter its Buy Zone. On the long-term though, DOGE has significant upside ahead as it is currently on the 2nd part of its Super Cycle 2 and that's where historically the strongest rally of the pattern takes place. After at least 1000 days are completed from the Cycle 3 Top, the market is expected (as it has done on previous Cycles) to initiate the final parabolic rally. Based on the previous Tops, this should hit at least the 0.618 Channel Fibonacci level, which by mid-2028 could reach $2.00. --- ** Please LIKE 👍, FOLLOW ✅, SHARE 🙌 and COMMENT ✍ if you enjoy this idea! Also share your ideas and charts in the comments section below! This is best way to keep it relevant, support us, keep the content here free and allow the idea to reach as many people as possible. ** --- 💸💸💸💸💸💸 👇 👇 👇 👇 👇 👇by TradingShot4454
Dogecoin: The Battle Between Wave Y and a New ImpulseDogecoin Daily Chart | Elliott Wave Analysis At this stage, both the aggressive and conservative scenarios remain valid. The key difference lies in how the current corrective structure is interpreted, and only future price action will determine which scenario is actually unfolding. Aggressive Scenario In the aggressive scenario, the current structure may still be part of a classic Zigzag. If this interpretation is correct, I expect the market to first develop a three-wave corrective pattern, at least resembling the behavior of Wave (B) within the current Zigzag. Once that correction is complete, another Zigzag could develop, allowing the entire corrective structure to finish with the typical seven-swing sequence. Another possibility is that the current movement represents only a portion of a higher-degree Wave X. If so, the correction could become considerably more complex, developing multiple nested Zigzag formations before eventually completing a larger Wave Y, and ultimately Wave (IV). For now, both interpretations remain valid until future price action provides structural confirmation. Conservative Scenario In the conservative scenario, the correction of Wave X, interpreted as an Extended Leading Diagonal, is viewed as having been completed through a classic Zigzag, potentially completing the entire corrective cycle. If this interpretation proves to be correct, a breakout above the previous Wave B high of the recent Zigzag would provide the first meaningful confirmation that the next bullish phase is underway. However, at the current stage, a three-wave corrective structure remains the more probable outcome until the market confirms otherwise—particularly if the Extended Leading Diagonal has already reached completion. As always, the market will determine the correct path. Until then, structure, invalidation levels, and future price action remain our most reliable guide. Patterns whisper. I listen. — Mr. Nobody | Elliott Wave Principle Dogecoin 2 hours ago Dogecoin Daily Chart | Elliott Wave Analysis Longby Mehdi_Abbasi_EWP9
Dogecoin Daily Chart | Elliott Wave Analysis At this stage, both the aggressive and conservative scenarios remain valid. Only future price action will determine which path the market ultimately chooses. Aggressive Scenario In the aggressive scenario, there is still a possibility that the market is developing a three-wave correction that could eventually evolve into a Double Three (W-X-Y) corrective structure. Under this interpretation, the previous decline can be viewed as Wave W, followed by the recovery that formed Wave X. The current decline may represent only the initial phase of Wave Y, having already reached its most conservative target. From here, the market may develop either a smaller corrective pattern or a more complex corrective structure around the current region or slightly lower. Ultimately, price action and the development of the following waves will determine whether Wave Y continues to unfold or whether the correction has already reached completion. Conservative Scenario In the conservative scenario, Wave X is interpreted as an Extended Leading Diagonal. In addition, the most recent three-wave advance currently displays the characteristics of a classic Zigzag, a structure that could mark the beginning of the next move in the direction of the larger trend. If this interpretation proves to be correct, the correction may have already reached completion, allowing the market to gradually transition into the next bullish phase. However, as always, confirmation will only come through a breakout from the corrective structure, the ability of price to hold above the breakout level, and the development of a valid bullish pattern. At this stage, neither scenario should be treated as certain. The market itself will determine the correct path. Until then, the structure, invalidation levels, and future price action remain our most reliable guide. Patterns whisper. I listen. — Mr. Nobody | Elliott Wave Principle Dogecoin 2 days ago Dogecoin (DOGE/USD) — A Long-Term Elliott Wave Perspective Dogecoin 2 days ago Dogecoin — The Structure of a Potential Golden Era Longby Mehdi_Abbasi_EWP7
Doge still playingProbably the cycle extended to 2:1 so based on that in needs time to start to move , I won’t be surprised if we see the top around late 2027by mastershark6
Dogecoin — The Structure of a Potential Golden Era Taking a closer look at the third wave of Dogecoin, we can now examine the internal structure of this larger-degree scenario in greater detail. What makes this chart particularly interesting is that, in some cases, the patterns do not remain confined to the boundaries we initially expect. Instead, they gradually extend beyond their original framework and begin to reveal a much larger structure. Here, we are looking at a long-term scenario that, if confirmed, could potentially lay the foundation for a Golden Era for Dogecoin. Of course, “Golden Era” is not a slogan or a guaranteed prediction. The meaning of that term will ultimately be determined by the structure itself and by the path the market chooses to take in the future. In my long-term studies of Bitcoin, Ethereum, and Dogecoin, one common element has repeatedly captured my attention: Structure. Not excitement. Not hype. Not unsupported predictions. If this scenario eventually unfolds, it will not be because we decided in advance that the market must go higher. It will be because the structure allowed for that possibility. At the current stage, Wave IV appears to be approaching its final stages, and specific targets have already been defined for this corrective structure. Once Wave IV is complete, the next step is no longer prediction. It is waiting for confirmation through price action. A breakout from the corrective channels, followed by the ability of price to hold above the broken structure and develop a valid bullish pattern, could provide the first significant evidence that the next major advance is beginning. However, there is one important principle we must always remember. The market is a very strict enforcer. For every violation of its rules, the market demands a heavy penalty. If a scenario violates its structural rules, we must accept it. If an invalidation level is broken, the count must be reconsidered. The market does not negotiate with any analyst. At the same time, missing a valid opportunity also carries a cost. Sometimes, missing a major move can be just as costly as taking a position against the market. Therefore, the goal is not to be in the market at all times. The goal is to understand the structure, define the scenarios, identify the invalidation levels, and act when the market provides the confirmation. At this stage, the long-term structure of Dogecoin continues to present a very interesting scenario. This structure may eventually develop into a much larger advance. Perhaps it will complete and reveal what could truly become a Golden Era for Dogecoin. Or perhaps the market will violate the structure and force us to reconsider the count. Ultimately, the only thing capable of providing the real answer is future price action and market structure. For now, patience is required. We must allow the future to reveal itself. Several years from now, this chart may provide very interesting feedback. Will this structure ultimately lead to the major advance illustrated in this scenario? Or will the market choose another path? The future will provide the answer. But until then, one thing remains clear: We do not predict the future. We study the structure and allow the market to reveal what comes next. — Mr. Nobody | Elliott Wave PrincipleLongby Mehdi_Abbasi_EWP2214
Dogecoin (DOGE/USD) — A Long-Term Elliott Wave Perspective On the weekly chart, Dogecoin continues to present a potential large-degree five-wave impulse structure. As with the long-term structures I have previously shared for Bitcoin and Ethereum, DOGE may currently be developing within Wave IV of this larger impulse. At the aggressive count, Wave IV can be interpreted as a large sideways correction composed of two larger zigzags connected by an intervening wave. This connecting wave itself may take the form of a Triple Zigzag and, from a geometric perspective, shows similarities to an Expanded Diagonal structure. Within this interpretation, Wave Y is currently developing as a classic Simple Zigzag, and price has already reached the initial targets identified on the chart. The reaction at the next target zones will now become increasingly important. A sustained move higher and a confirmed breakout from the corrective channels shown on the chart could provide the first significant evidence that the correction is complete and that the next bullish phase is beginning. Each channel breakout may provide additional confirmation step by step. However, the reaction following the breakout, the ability of price to hold above the broken structure, and the subsequent development of the bullish pattern will remain important. A More Conservative Alternative Count At the same time, a more conservative interpretation must also remain on the table. In this scenario, the same Expanded Diagonal that is interpreted as Wave X within the aggressive count could instead represent Wave 1 of a higher-degree Wave 5. If this interpretation is correct, the recent decline could be developing as a Simple Zigzag, forming Wave 2 of a higher-degree Wave 5. The key condition for this scenario is that the current correction must not move beyond the origin of Wave 1. As long as that critical low remains intact, the possibility remains that the market is still completing Wave 2 before beginning the next larger advance. A break above the corrective structure, followed by the development of a sustained bullish move, could then provide confirmation that Wave 2 has completed and that the market is entering Wave 3 of the larger Wave 5. Two Counts — One Potentially Bullish Path The interesting aspect of these two interpretations is that both can ultimately lead to a bullish outcome. The primary difference is the degree of the wave count and the position of the current structure within the larger Elliott Wave sequence. Under the aggressive interpretation, the larger correction may already be approaching completion, allowing the market to transition directly into the next bullish phase. Under the conservative interpretation, the market may first need to complete Wave 2 of a higher-degree Wave 5. As long as the key Wave 1 low holds, the next advance could then develop as Wave 3. For now, the key factors to monitor are: Price reaction at the next target zones; Confirmed breakouts from the corrective channels; The preservation of the key Wave 1 origin in the conservative count; And the development of a valid bullish structure following the breakout. Until these confirmations appear, patience remains essential. The market will ultimately reveal which wave count is correct through its structure. — Mr. Nobody | Elliott Wave Principle DOGE Dec 15, 2023 Doge In Strong Bullish Market, Five Wave Up Longby Mehdi_Abbasi_EWP10
DOGEUSD: Entered the bottom process. $0.5500 can be max pain.DOGE is almost oversold on its 1W technical outlook (RSI = 33..163, MACD = -0.019, ADX = 25.177). It has completed a month of trading under the bottom band of the Mayer Multiple Bands. during the 2022 Bear Cycle, it first pierced below that level in June 2022 (same time as this Cycle) and spent 4 months ranging around it before it formed the macro bottom. Worst case scenario is for Dogecoin to reach 0.0550. Besides that, we are close to the ultimate starting levels to buy for the long term in preparation of the next Bull Cycle. ## If you like our free content follow our profile to get more daily ideas. ## ## Comments and likes are greatly appreciated. ##by InvestingScope7
Sal.... *Dogecoin CRYPTOCAP:DOGE - 4H Technical Analysis* *Current Price: $0.0718* *Summary:* DOGE is testing a major demand zone between *$0.0614 - $0.0685* marked in red. *Scenarios:* 1. *Bullish*: Holding above $0.0685 targets *$0.1123* next. Potential move: ~ +55% 2. *Bearish*: A 4H close below $0.0614 opens a drop toward *$0.0540* *Key Levels:* - *Support*: $0.0685 → $0.0614 - *Resistance*: $0.0800 → $0.1123 *Conclusion:* This zone is critical. A bounce here confirms the next leg up. A breakdown invalidates the setup. Risk management is key.Longby sabri20032
DOGECOIN [$DOGE] ELLIOTT WAVE CRYPTO ANALYSIS WEEKLY TFDOGE appears to be approaching the final stages of a multi-year correction, with price now testing a major confluence of long-term support. From an Elliott Wave perspective, the explosive five-wave advance into the 2021 peak was followed by a complex A-B-C correction that has gradually retraced much of the previous bull market. The current decline is now approaching the macro Golden Zone Long at 3¢, where multiple technical support levels converge. While bearish momentum remains intact in the short term, the broader structure suggests the correction may be entering its final phase. A successful defence of the current support region would complete the higher-degree Wave (4) and set the stage for the next impulsive advance. If buyers regain control, the focus shifts back toward the previous cycle high before opening the door to substantially higher prices as Wave (5) unfolds. Until then, patience remains key, as the market still needs to confirm that a durable bottom has formed. As long as the macro support zone at 3¢ holds, the larger bullish outlook remains intact. A decisive break below it, however, would force a reassessment of the current wave count. Not financial advice. Like and follow for more Elliott Wave and macro crypto analysis.Longby Anakyn1110

 Long
Long