Brent oil may be positioned to surge above $100Conditions in the Middle East remain volatile, and Brent crude oil now appears poised to move sharply higher after a period of consolidation. Brent already broke out of a bull flag pattern in mid-August and has been trending higher. It now appears to have formed a symmetrical triangle, which in this case could act as a bullish continuation pattern.
The pattern has been formed by a series of higher lows and lower highs. Currently, a move above $95.50 would be enough for Brent to clear the downtrend and move beyond the previous lower high from 21 August. If that happens, Brent could be on a path to higher prices.
At present, the technical chart suggests that Brent could rise back towards $100, the high established on 23 July. However, the technical pattern also suggests there could be further room to rise if Brent reaches $100. A projection of the move from the low established on 6 July to the high on 23 July, measured from the low on 26 August, would suggest Brent could rise towards $117, bringing it back towards the highs seen in early May.
If the price fails to break out and instead breaks down through the lower boundary of the symmetrical triangle at around $90, that would be bearish and could lead to a return to the August lows near $82.
Written by Michael J. Kramer, founder of Mott Capital Management.
Disclaimer: CMC Markets is an execution-only service provider. The material (whether or not it states any opinions) is for general information purposes only and does not take into account your personal circumstances or objectives. Nothing in this material is (or should be considered to be) financial, investment or other advice on which reliance should be placed.
No opinion given in the material constitutes a recommendation by CMC Markets or the author that any particular investment, security, transaction, or investment strategy is suitable for any specific person. The material has not been prepared in accordance with legal requirements designed to promote the independence of investment research. Although we are not specifically prevented from dealing before providing this material, we do not seek to take advantage of the material prior to its dissemination.
In-depth trading ideas
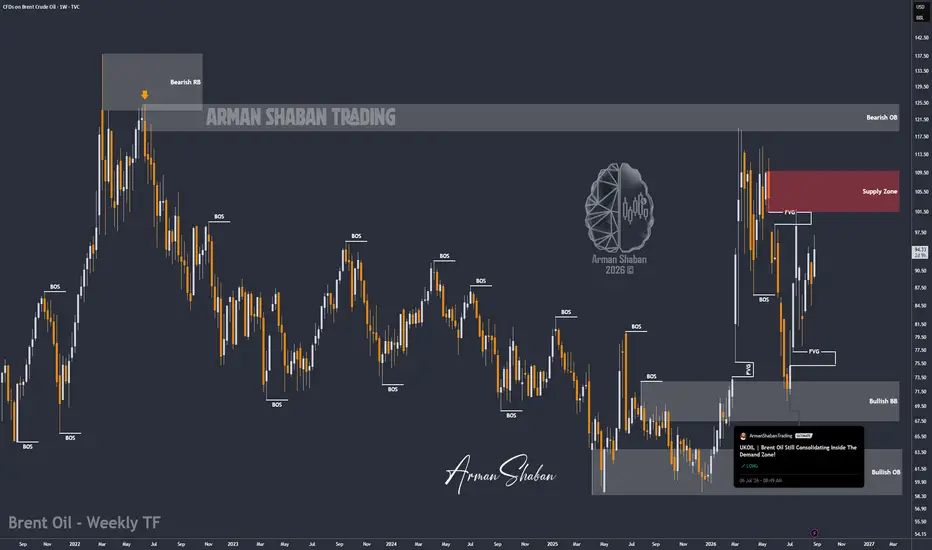
UKOIL | Brent Oil Is Waking Up Again, Is $120 About To Break?By analyzing the #BrentOil chart on the weekly timeframe, we can see that after the previous analysis, Oil first corrected toward the $78 region . However, that weakness did not last very long.
As tensions between Iran and the United States increased again and both sides returned to military confrontation, buying pressure gradually came back into the Oil market. Politically, everyone keeps talking about temporary pauses and de-escalation, but price is telling a completely different story . :))
In my view, Brent is now preparing for another major bullish expansion. The most important level ahead is the previous major high around $120 . If buyers manage to break and stabilize above this level, I believe the next bullish leg could become much more aggressive.
If this analysis has been useful so far, give it a Boost to support my work and let me know you want more updates like this.
Before reaching $120, the important upside levels I’m watching are $100, $105, $110, $115 and then the major $118 – $120 area . A clean breakout above $120 could open the way toward $125, $130 and potentially even $140 in the medium term.
On the downside, the important demand areas remain around $90 – $94 , followed by $82 – $86 and the deeper $76 – $80 region.
Honestly, almost nothing feels stable in this market right now. Every time the situation looks slightly calmer, another headline changes everything again. Based on what I’m seeing on the chart, the market still looks like it is pricing more risk ahead rather than a lasting normalization .
I truly hope that interpretation is wrong from a real-world perspective, but as a trader, my job is to read what price is showing me. For now, my broader bias on Brent Oil remains bullish .
Please support me with your likes and comments to motivate me to share more analysis with you and share your opinion about the possible trend of this chart with me !
Best Regards , Arman Shaban
Brent short squeeze to $96 incoming?Trading oil in today’s market is for the truly strong-minded. But if we try to look at the chart:
Price is still in a bounce phase after the decline, and today it finally showed a long squeeze, immediately reacting with growth.
There is still one liquidity zone left below at $85, but it’s noticeably smaller than the short-liquidity zone at $93–94. And price needs liquidity to move.
If price now holds above the $90.37 resistance level and manages to stay above the diagonal support, we can expect a strong upside reaction toward $96.
If price holds above resistance but loses support, we’ll move into the $86–$94 range.
However, a news event can always hit and change everything. Also, if price shows weakness now and drops below the diagonal support, the next major target could be $76 📉
⚠️ Right now, price is actively forming its next direction. In moments like this, it’s better not to force trades, but to let the market show where it wants to go.
UKOIL | Geopolitical tensions arise - Oil to go towards $100!Well hello folks, hope you are well. Amirali here.
As you can see in the weekly chart of Brent Oil, after this week's open, it has been on a upwards trend, reaching the high of 97.04 after the escalation in tensions in the Persian Gulf regarding the war between US and IR. Currently, it is being traded at around $95.00.
Now, considering the geopolitical tensions rising once more, Oil could go towards $100 again after 6 weeks, and break above the supply zone, reaching the huge Volume Imbalance. It has been announced by the Pakistani representatives that the US and IR people will come back to the negotiation table soon, which has eased the tensions a bit, but it is not something that's gonna stop the rise in price, rather something to control the price for a little while before it surges again. Last night, the US launched an attack on Iran soil, which the IR counterparts retaliated by launching missile attacks at the Persian Gulf countries. Meanwhile President Trump has announced that the IR will pay the price for their doings and this may cause another round of war starting very soon. Considering the tensions around the Strait of Hormuz, Oil price is likely to go higher.
Current targets for oil: 95.50, 96, 96.50, 97, 97.50, 98, 98.50, 99, 99.50 and 100.
Brent Crude Oil | Structure Before Correction
The lack of engulfing at the origin of the move—the **green box**—suggests that price is likely to retrace toward the **orange box** before the next directional move begins.
For now, price remains within the **Behavior Zone**. As long as Brent continues to hold **above $70**, I do not expect a deep correction or a significant decline.
The key area to watch is therefore the **orange box**. A reaction from this zone could provide the basis for the next leg of the move.
TREXbowman | Structure & Behavior
Oil to the MoonWell, again, it seems that the war in the Persian Gulf is going to raise the price of oil, but this series has a very big difference, the behavior of the price indicates the breaking of the ceiling range ahead, and it seems that the situation is not interesting and we have to wait for hyperinflation in the world with the oil price reaching 155-165 dollars in the main target and the initial target of 110 and then 130 dollars.
We have to wait and see
Stay with me and be profitable
Do you have any questions? Ask me in the comments
Don't forget to introduce me to your friends so that we can all profit together?
What do you have in mind that I should analyze for you? Comment for me.
Thank you for paying your full attention to my analysis
Brent Crude — Overall View: Bearish Brent Crude — Overall View: Bearish
CMP: 87.59
Our overall view on Brent Crude remains bearish. The first downside move is expected from 87 towards 82.
Once Brent reaches the 80–82 support zone, we will wait and observe the price action carefully.
87 → 82: First downside target
80–82: Major support & decision zone
If support sustains: We will wait for confirmation and consider a bullish reversal
If 80–82 breaks: Further downside can extend towards 70
Overall View: Bearish.
At 80–82, we will reassess the market conditions and decide whether to take a reversal or continue with the bearish view.
Disclaimer: This market view is for educational and informational purposes only and should not be considered investment or trading advice. Crude oil prices are highly volatile and can change rapidly based on market conditions. Please do your own analysis, manage risk appropriately, and trade according to your risk appetite.
BRENT | 24–28 Aug 2026Last Week Recap | 17–21 Aug 2026:
Brent continued to rise for the second consecutive week, supported by rising US–Iran tensions and increased Supply Risk surrounding the Strait of Hormuz. Brent closed at $95.20 (+6.39%).
Fundamental | 24–28 Aug 2026:
The outlook remains Bullish but highly volatile. Markets continue to monitor Geopolitical Risk and oil transportation through the Strait of Hormuz. If Supply remains constrained, prices could receive further support. However, traders should watch for pressure from Global Demand and potential profit-taking if geopolitical tensions ease.
Technical | 4H:
If Brent breaks above 95.40, it could move higher to test 96.90 / 98.00. A break below 94.40 could lead to further downside.
Bias: Bullish
Resistance: 95.40 / 96.90 / 98.00
Support: 94.40 / 92.51
Target: 98.00
Cut Loss: Below 94.40
OIL — THE MARKET’S MAIN WEAPON IN TIMES OF WAR🛢️ OIL — THE MARKET’S MAIN WEAPON IN TIMES OF WAR
When wars escalate, oil becomes one of the first markets everyone watches.
From a chart perspective, I still see a bullish structure.
Price is approaching an area that needs a real catalyst — fuel to break through resistance. If that breakout happens with strong structure and confirmation, I see a potential move toward $112+ per barrel.
🔥 WHY COULD THE BREAKOUT HAPPEN?
If we don’t see a meaningful peace development, I believe the market could enter another phase of panic.
And this is where I become skeptical of the narrative being pushed around the Strait of Hormuz.
We keep seeing claims along the lines of:
“Hormuz is open.”
“It is under U.S. control.”
“Oil traffic is operating normally.”
But if the physical market actually looked that normal, why does the narrative need to be repeated so aggressively?
Recently, we’ve seen reports from outlets including Axios and CNN pushing the idea that oil traffic and shipping conditions around Hormuz are basically normal.
I call it a bluff.
Not because every report is necessarily false, but because the headline narrative needs to be tested against physical evidence.
And in 2026, we have something called satellite imagery. 🙂
You can't simply say:
“Hormuz is open.”
Show us what is happening with:
IN → OUT → LOADED → UNLOADED → PORT ACTIVITY → TANKER MOVEMENTS
That is what matters.
🇨🇳 AND ABOUT CHINA…
I’ve also seen people pointing to China’s oil imports as evidence that the situation is normal.
I don't agree with that conclusion.
China is not suddenly importing dramatically more oil than it was a couple of months ago.
So if someone is using China’s current import levels as proof that Hormuz is functioning normally, I think they are stretching the data.
The question isn't simply how much China imports.
The question is:
Where is that oil coming from?
How is it moving?
And what does the physical-flow data actually tell us?
🧠 CREDIBILITY MATTERS
And then we get to something even more important:
MARKET CREDIBILITY.
Yesterday, U.S. Treasury Secretary Scott Bessent reportedly questioned why oil prices had moved higher.
Honestly… that was quite funny.
Because when policymakers and mainstream headlines keep telling the market one story, while shipping activity, satellite imagery and physical flows suggest something different, eventually traders stop listening to the narrative and start watching the data.
Credibility is an asset.
Once the market loses confidence in the official narrative, it starts searching for alternative sources of information.
And price becomes the judge.
⚔️ OIL IS NO LONGER JUST A COMMODITY
In a geopolitical conflict, oil becomes an economic weapon.
And right now, the question isn't simply:
“Is Hormuz open?”
The real questions are:
How much oil is actually moving?
Who is moving it?
Where is it going?
And what happens if those flows deteriorate further?
If geopolitical tension remains elevated and the physical market tightens, $112+ per barrel becomes a very real technical possibility.
And in this game…
🇨🇳 China may be playing the oil game differently than the market expects.
Don't trade the headlines.
Watch the flows.
Watch the structure.
Watch the breakout.
🛢️ Oil can tell you the truth long before the headlines do.
⚠️ Disclaimer: This is my personal market opinion and analysis only, not financial advice or a recommendation to buy/sell. I could be wrong. Markets are unpredictable, and all scenarios/price levels mentioned are hypothetical. Do your own research and manage your risk.
Probably safe to trade the bounce hereOil has come under pressure over the last few months but has now traded down to just above a rather significant support level. The $71.71 level (give or take) has been rather significant since early 2020 when it was resistance. Since then, it has turned into support, and now Brent has come down to test it as support once more. Our thinking is that it would be a safe trade to go long for the bounce here. At the very least we will know quickly that we are wrong if the support level fails. At best, we can get a great entry to trade Brent back up to around $90.
USOILOil is currently in a buying zone, but we do not yet see a confirmation candle for an upward move; we must wait for that confirmation. If the price does not rise from the current level, we should wait for the next buying zone—specifically between 88.260 and 87.793—though a confirmation candle is still required there. If the levels at 91.745 and 92.142 are broken, the price is likely to rise to the 94.255–94.763 range.
Brent 4H Sell Setup | News Hits Key Resistance at 92.61 #BRENT (#Crude_Oil, #USOIL, #CL)
Chart: 4H
There's a rising probability that Brent crude could be setting up for a sell right now. Why? Yesterday's news hit exactly at a higher timeframe key resistance level.
Usually, when the market reacts to a fundamental news catalyst right at a resistance level like this, there's a good chance the next move gets driven by technicals rather than more news. That's the setup I'm watching here.
Let's see how this plays out — this is just a read on the chart, it can go right or wrong. Right now, I'm looking to take a Brent SELL.
Review and plan for 26th August 2026 Nifty future and banknifty future analysis and intraday plan.
Watch- Groww, Welcorp.
This video is for information/education purpose only. you are 100% responsible for any actions you take by reading/viewing this post.
please consult your financial advisor before taking any action.
----Vinaykumar hiremath, CMT
Reducing tensions and normalizing conditions?Reducing tensions and normalizing conditions?
Can we conclude from the correction of oil prices from the peak of 94.85 to the current price of $87 that the level of tension in the Strait of Hormuz has decreased?
Or has the market gotten used to this situation and adapted itself?
Possible support and resistance levels have been drawn.
Oil Market Outlook: Structure Over HeadlinesOil Market Outlook: Structure Over Headlines
One of the most common mistakes in oil analysis is assuming that negative geopolitical news automatically means higher oil prices.
But markets do not trade the news itself. They trade its actual impact on supply, demand, and market structure.
Tensions may increase in the Middle East, new sanctions may be imposed, or there may be threats of disruptions to oil supply. However, unless these events lead to a real reduction in supply, disruption to transportation, or a meaningful change in the market balance, they do not necessarily provide enough reason for oil to continue rising.
There is another important factor: if the market has already priced in the geopolitical risk, the release of additional negative news can even become a reason for buyers to take profits and price to correct lower.
This is why, in oil analysis, we need to distinguish between:
High geopolitical risk ≠ necessarily higher oil prices
News is only a catalyst. What ultimately matters is Structure, Behavior, and the market’s reaction to the news.
The news may be negative, but if price fails to maintain its bullish structure, price behavior becomes more important than the headline itself.
We do not analyze the news. We analyze how the market reacts to the news.
From a structural perspective, I expect the current high to be taken out. However, that does not necessarily mean oil is entering a sustained bullish move.
For now, my expectation is that oil will eventually move toward $80.
The reason is that price is currently trading within a structural zone. As long as price remains above the Origin, I do not expect oil to move below $70.
Therefore, my current scenario is a move toward $80, while the existing structural conditions remain valid.
Structure first. Behavior confirms.
@trexbowman_sb | TREXbowman | Structure & Behavior
Weekly Overview: XAUUSD, #SP500, #BRENT | 28 August 2026XAUUSD: BUY 4620.00, SL 4580.00, TP 4720.00
Gold starts the week with sustained demand amid a weaker US dollar and renewed concerns about the stability of the US debt market. The US Treasury’s decision to increase buybacks of long-term bonds after the 30-year yield climbed toward multi-year highs has strengthened demand for defensive assets.
XAUUSD has already posted a notable advance, so further upside will depend on continued pressure on the dollar ahead of Federal Reserve Chair Kevin Warsh’s speech and upcoming inflation data. Elevated yields limit gold’s potential, but as long as fiscal concerns persist, the base-case scenario remains supportive of further gains.
Trading idea: BUY 4620.00, SL 4580.00, TP 4720.00
#SP500: SELL 7690, SL 7750, TP 7570
#SP500 enters the week after declining over the previous five sessions, with high borrowing costs remaining the main constraint. Long-term US Treasury yields are holding near multi-year highs, raising the hurdle for equity valuations and creating particular pressure on the technology sector.
The market is also awaiting Nvidia’s earnings report and Federal Reserve Chair Kevin Warsh’s speech in Jackson Hole. Strong corporate results could support equities, but the combination of expensive financing, inflation risks, and uncertainty over interest rates leaves the weekly outlook vulnerable. The base-case scenario remains tilted toward further downside.
Trading idea: SELL 7690, SL 7750, TP 7570
#BRENT: BUY 93.20, SL 90.70, TP 98.20
Brent starts the week after a strong advance, while the geopolitical risk premium remains elevated. The United States is preparing new sanctions against Iran and its trading partners, while vessel traffic through the Strait of Hormuz remains below pre-war levels. This keeps supply disruption risks in focus and supports oil prices.
Offsetting factors include higher US commercial crude inventories and the OPEC+ decision to raise September production quotas by 188,000 barrels per day. However, the IEA estimates that the market will remain in deficit during the third quarter. If supply constraints persist, the base-case weekly scenario allows for a recovery in #BRENT.
Trading idea: BUY 93.20, SL 90.70, TP 98.20