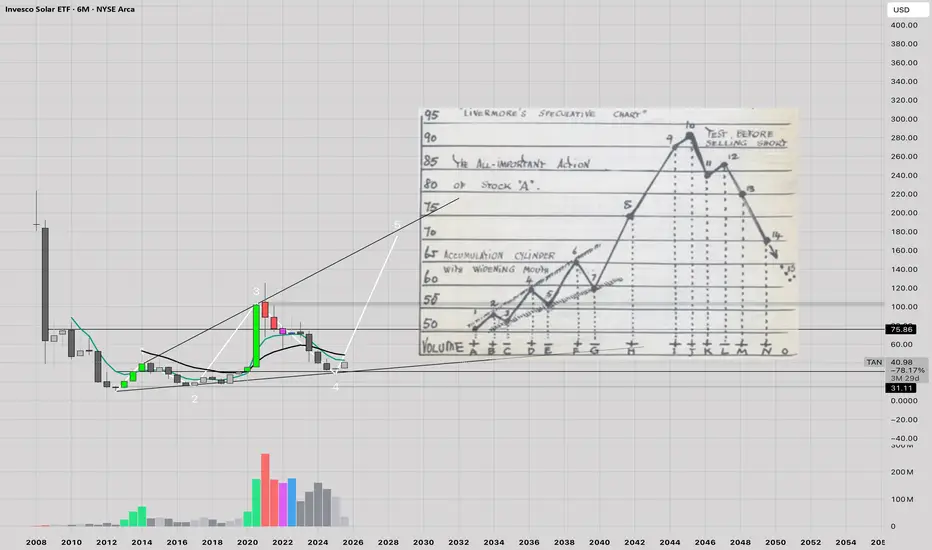
$TAN — The Three-Act Solar CycleAMEX:TAN — The Three-Act Solar Cycle
Pulled up the monthly on Invesco Solar to map the macro drivers. Three clean acts:
Act 1: The Policy Pump (late 2020 to Feb 2021)
Ran from ~$20 to ~$125 on Biden clean-energy anticipation: Paris re-entry, EO blitz, plus near-zero rates juicing every long-durat
Key stats
Fund info
Home page
Inception date
Apr 15, 2008
Structure
Open-Ended Fund
Replication method
Physical
Dividend treatment
Distributes
Distribution tax treatment
Qualified dividends
Income tax type
Capital Gains
Max ST capital gains rate
39.60%
Max LT capital gains rate
20.00%
Primary advisor
Invesco Capital Management LLC
Distributor
Invesco Distributors, Inc.
ISIN
US46138G7060
CUSIP
46138G706
FIGI
BBG00KXH5WT4
Identifiers
ISIN US46138G7060
TAN offers a unique take on renewable energy, holding a concentrated portfolio of companies involved in the solar energy industry, thus cutting out much of the broader renewable energy market. Selection begins with global solar energy companies of all caps including all solar technologies (crystalline and thin-film photovoltaic solar and solar thermal), the entire value chain (raw materials, installers, to financing), and related solar equipment (power inverters and encapsulates). Eligible companies are categorized into either pure-play or medium-play. Pure-play companies have the solar industry as their primary business, generating more than two-thirds of their revenue. Medium-play companies cover those with multiple business industries but still generate more than one-third of their revenue from solar-related businesses. The funds weighting tilts towards pure-plays and underweights the medium-play firms. The index is rebalanced quarterly.
Classification
What's in the fund
Exposure type
Electronic Technology
Utilities
Producer Manufacturing
Breakdown by region
Top 10 holdings
Solar Entering A period of Steady Growth (TAN)Beautiful chart - the TAN ETF has been on a steady climb and remarkably steady throughout all this turbulence. Mostly unaffected by the oil crisis. I wonder why? (sarcasm)
No matter what shenanigans are occurring around the world, and how backwards some countries are looking (ahem, USA), innovation
$TAN: Inverse Head and ShouldersThe Pattern Setup:
Left Shoulder: Formed during the late January dip (approx. $51.00 - $52.00).
The Head: The deeper washout seen in late February/early March, potentially hitting a low near the $50.48 mark.
Right Shoulder: Currently forming or anticipated as price stabilizes above the $51.51 supp
Trading Journal - January Bought the breakout, didnt follow through initially but didnt sell me out as well
The day it broke out even more, i got greedy. It is a solar ETF. I thought, man i am going to miss out on the gains if i buy ETF, rather do individual solar stock so i chose the best company $FSLR. Sold it for minor p
Energy ETFs: Policy, Solar, Gas, and NuclearEnergy ETFs serve as a strategic tool for capturing growth in specific sectors while reducing the risk associated with individual stocks. Let’s take ETFs in the alternative energy sector (solar, wind, nuclear). They dominate thanks to favorable policies and decarbonization trends. Natural gas ETFs,
Starlight is the future ?"As we progress along the Kardashev Scale, energy harnessed on Earth will increase a hundredfold and will mostly be solar aka fusion aka starlight.
Then energy harnessed will increase perhaps a billionfold if we make it to Kardashev II, with space solar power, and another billionfold if we harness
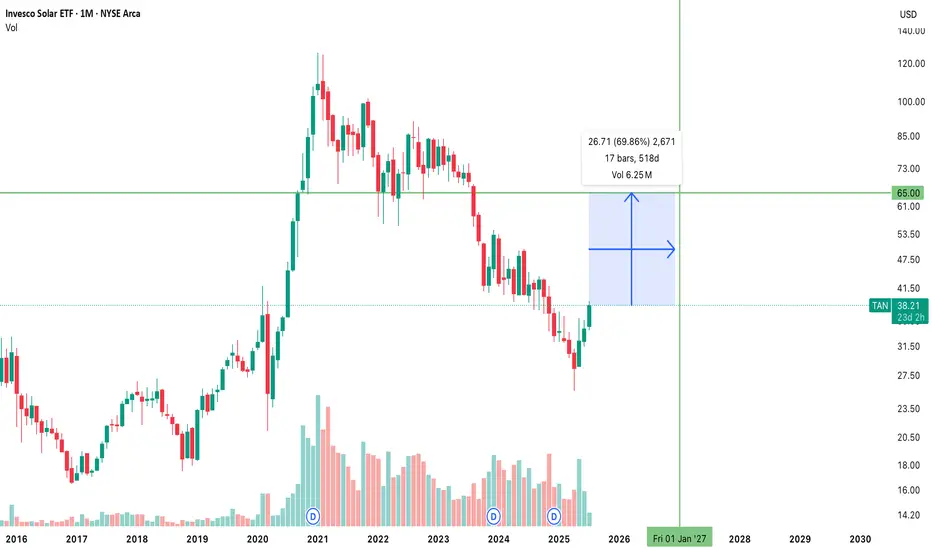
$TAN $65 STRIKE CALLS EXPIRING JAN 15, 2027 (17 MONTHS AWAY)WILL THIS PRINT???
AMERICA WILL RUN INTO A POWER CRISIS 2025-2035
The U.S. power grid is nearing a breaking point as AI, robotics, and data centers drive unprecedented electricity demand. By 2030, data centers could consume 9% of U.S. power, doubling from 2023, with AI queries alone using 10x the
$TAN Is This Getting Ready for a Stage 2 Breakout?Clean Energy (Solar) has been in a downtrend since January 2021! Every time it looks like it is setting up for a stage 2 breakout, it has broken down. Will this time be different?
Here is what I see on this chart.
TAN
was in a clear downtrend until mid-December 2024. Then it challenged its previo
Opening (IRA): TAN February 21st 32 Covered Call... for a 31.17 debit.
Comments: Still in the top 5 underlyings for IV on my ETF board, with 30-day at 35.0%. Adding at strikes better than what I currently have on after exiting the 33's at 50% max. Selling the -75 delta call against stock to emulate the delta metrics of a 25 delta short put, bu
Opening (IRA): TAN Nov 15th 37 Covered Call... for a 35.89 debit.
Comments: Relatively decent IV here at 42.8%. Selling the -75 delta call against stock to emulate the delta metrics of a +25 delta short put, but with the built-in defense of the short call.
Metrics:
Buying Power Effect/Break Even: 35.89
Max Profit: 1.11
ROC at Max: 3.09%
See all ideas
Summarizing what the indicators are suggesting.
Oscillators
Neutral
SellBuy
Strong sellStrong buy
Strong sellSellNeutralBuyStrong buy
Oscillators
Neutral
SellBuy
Strong sellStrong buy
Strong sellSellNeutralBuyStrong buy
Summary
Neutral
SellBuy
Strong sellStrong buy
Strong sellSellNeutralBuyStrong buy
Summary
Neutral
SellBuy
Strong sellStrong buy
Strong sellSellNeutralBuyStrong buy
Summary
Neutral
SellBuy
Strong sellStrong buy
Strong sellSellNeutralBuyStrong buy
Moving Averages
Neutral
SellBuy
Strong sellStrong buy
Strong sellSellNeutralBuyStrong buy
Moving Averages
Neutral
SellBuy
Strong sellStrong buy
Strong sellSellNeutralBuyStrong buy
Displays a symbol's price movements over previous years to identify recurring trends.
Frequently asked questions
An exchange-traded fund (ETF) is a collection of assets (stocks, bonds, commodities, etc.) that track an underlying index and can be bought on an exchange like individual stocks.
TAN trades at 47.27 USD today, its price has fallen −1.49% in the past 24 hours. Track more dynamics on TAN price chart.
TAN net asset value is 46.96 today — it's fallen 8.38% over the past month. NAV represents the total value of the fund's assets less liabilities and serves as a gauge of the fund's performance.
TAN assets under management is 1.08 B USD. AUM is an important metric as it reflects the fund's size and can serve as a gauge of how successful the fund is in attracting investors, which, in its turn, can influence decision-making.
TAN price has fallen by −6.93% over the last month, and its yearly performance shows a 17.70% increase. See more dynamics on TAN price chart.
NAV returns, another gauge of an ETF dynamics, have risen by −8.38% over the last month, have fallen by −8.38% over the last month, showed a −35.02% decrease in three-month performance and has increased by 12.75% in a year.
TAN fund flows account for 285.53 M USD (1 year). Many traders use this metric to get insight into investors' sentiment and evaluate whether it's time to buy or sell the fund.
Since ETFs work like an individual stock, they can be bought and sold on exchanges (e.g. NASDAQ, NYSE, EURONEXT). As it happens with stocks, you need to select a brokerage to access trading. Explore our list of available brokers to find the one to help execute your strategies. Don't forget to do your research before getting to trading. Explore ETFs metrics in our ETF screener to find a reliable opportunity.
TAN invests in stocks. See more details in our Profile section.
TAN expense ratio is 0.70%. It's an important metric for helping traders understand the fund's operating costs relative to assets and how expensive it would be to hold the fund.
No, TAN isn't leveraged, meaning it doesn't use borrowings or financial derivatives to magnify the performance of the underlying assets or index it follows.
In some ways, ETFs are safe investments, but in a broader sense, they're not safer than any other asset, so it's crucial to analyze a fund before investing. But if your research gives a vague answer, you can always refer to technical analysis.
Today, TAN technical analysis shows the sell rating and its 1-week rating is sell. Since market conditions are prone to changes, it's worth looking a bit further into the future — according to the 1-month rating TAN shows the sell signal. See more of TAN technicals for a more comprehensive analysis.
TAN trades at a premium (0.21%).
Premium/discount to NAV expresses the difference between the ETF’s price and its NAV value. A positive percentage indicates a premium, meaning the ETF trades at a higher price than the calculated NAV. Conversely, a negative percentage indicates a discount, suggesting the ETF trades at a lower price than NAV.
TAN shares are issued by Invesco Ltd.
TAN follows the MAC Global Solar Energy Index. ETFs usually track some benchmark seeking to replicate its performance and guide asset selection and objectives.
The fund started trading on Apr 15, 2008.
The fund's management style is passive, meaning it's aiming to replicate the performance of the underlying index by holding assets in the same proportions as the index. The goal is to match the index's returns.