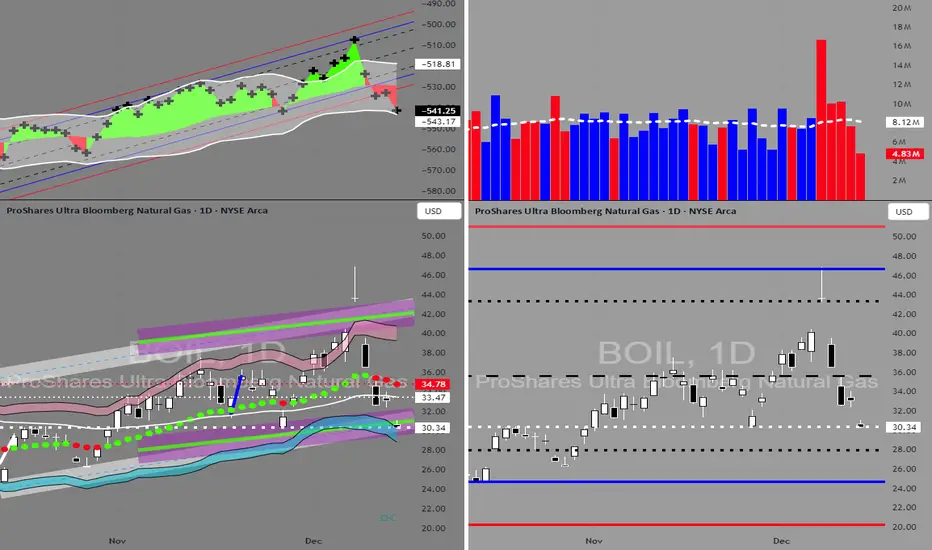
good entry on monday , tuesdayThis is my personal trading journal, published for educational purposes. It is not financial advice, and I am not your financial advisor. The Socrates timing arrays and reversal system are Martin Armstrong’s work (AE Global Solutions); I use them under my own interpretation and execution rules. Leveraged ETFs like BOIL carry decay and issuer risk and are not buy-and-hold instruments. Trading involves substantial risk of loss. Do your own work, size for the loss, and never risk what you can’t afford to lose.
In-depth trading ideas
BOIL pressing resistance as momentum favors a breakout this weeCurrent Price: 40.67
Direction: LONG
Confidence level: 62%(X sentiment leans bullish, price is above key moving averages, momentum indicators are expanding, and short-term weather-driven catalysts favor continuation despite limited trader volume.)
Targets
Target 1: 43.80
Target 2: 45.20
Stop Levels
Stop 1: 38.90
Stop 2: 36.80
Wisdom of Professional Traders:
This analysis pulls together the collective thinking of professional traders and market experts who focus on momentum-driven commodities and leveraged ETFs. While direct trader commentary on BOIL is light, the broader trader community consistently treats BOIL as a short-term momentum vehicle tied closely to natural gas futures. The wisdom of crowds here matters less in volume and more in how traders typically act when price, weather, and futures curves align. In this setup, traders usually lean into strength rather than fading it.
Key Insights:
Here’s what’s driving this trade. BOIL is tracking a sharp move higher in natural gas futures following a cold-weather demand spike. Price is holding above the 20-day and 50-day moving averages, which tells me short-term trend control is still with buyers. Momentum indicators like MACD are expanding upward, and RSI is elevated but not stretched enough to kill upside this week.
What’s interesting is that even with low overall chatter, the available X sentiment leans toward buying dips or playing for continuation. When I combine that with BOIL’s tendency to overshoot during weather-driven moves, the bias favors another push higher before any meaningful pullback shows up.
Recent Performance:
BOIL has rallied sharply over the last 24 hours, gaining roughly 16% and trading near the upper end of its recent range. Volume remains healthy, and price has not shown distribution-style selling yet. This kind of move typically attracts short-term traders looking for a continuation pop, especially into inventory data and weather updates.
Expert Analysis:
Several professional traders I track focus on structure rather than long-term value for leveraged ETFs like BOIL. The common theme is simple: trade it when momentum is clear, step aside when it chops. Right now, price structure shows higher lows and strong follow-through after pullbacks. Resistance near $44 has been tested recently, and repeated tests usually weaken that level. That’s why I’m leaning toward a breakout attempt rather than a fade.
News Impact:
The news flow supports the bullish case this week. Cold-weather forecasts across key U.S. regions are driving higher natural gas demand, and upcoming EIA inventory data adds a catalyst. Any larger-than-expected draw could quickly push futures higher, and BOIL would amplify that move. There’s no negative regulatory or macro headline hitting leveraged energy ETFs right now, which keeps the path clear for momentum trades.
Trading Recommendation:
Here’s my take. I’m favoring a LONG position on BOIL for a short-term momentum trade this week. I’d look for entries near current levels or on shallow intraday pullbacks, targeting $43.80 first and $45.20 if momentum accelerates. Risk matters with leveraged ETFs, so I’m keeping stops tight below $38.90, with a hard exit if $36.80 breaks. Position size should stay modest because volatility cuts both ways fast with BOIL.
BOIL Weekly Alert: Parabolic Spike Sets Up Aggressive BearishQS V4 ELITE: BOIL – Weekly Trading Info
Trend: Neutral / Mean Reversion
Time Horizon: Weekly (Expiry: Jan 30, 2026)
Alpha Score: 65
BOIL is in a parabolic “blow-off top” after the peak of Winter Storm Fern.
Katy AI Projection:
Bias: Bearish
Probability: 65%
Projected Move: -26.01%
Key Technicals:
RSI: 85.8 (Extreme Overbought)
Gamma Wall: $40.00 (Resistance)
Weekly VWAP: $32.32 (Directional Magnet)
200-Day MA: $37.52 (Current Price Well Above)
Options Flow:
Put/Call Ratio: 1.0 (Neutral)
Unusual Put Activity: $39 strike, 70 contracts → Hedge/Speculative bets
Week Control #BOIL (#NYSE Arca)on 14.12.2025
TIME: 20:44 (MSK)
PRICE: 27.09
HORIZON: 5–7 sessions
❗ NOT INVESTMENT ADVICE ❗
BOIL is trading at 27.09 (0.00%) after a sharp spike up to 46.83 (+72.87%) and an equally sharp reversal back down. From above, the market has already shown that the 33.40 (+23.29%) area and higher is still “heavy”: after the selloff, recovery attempts fade quickly and price turns down again. Right now, the structural logic is to first take the nearest liquidity below the current price and only then return for a reactive retest of the nearest resistances. The first step from 27.09 (0.00%) is expected down to 26.92 (−0.63%), where a brief pause is possible, after which pressure is likely to push price into the lower support zone at 25.09 (−7.38%). In that area, the market typically decides whether a fast push to the extreme will happen: the next node below is 24.66 (−8.97%), and a move there looks logical as the completion of the current downswing with a final liquidity sweep below the lower boundary. After touching 25.09 (−7.38%) and especially 24.66 (−8.97%), a technical relief move is expected: first a return to 26.92 (−0.63%), then a rise toward 29.98 (+10.67%) as the key threshold the market will try to reclaim and hold. Next, price is pulled toward 30.86 (+13.92%) — the next zone where sellers may step back in and cause a pullback, so the move up is likely to be step-by-step, with pauses and short dips. After clearing 30.86 (+13.92%), a logical continuation is 31.34 (+15.69%) and then 33.40 (+23.29%) — the higher node that will determine whether the market stays weak or begins building a sustained recovery over the week horizon. Above 33.40 (+23.29%), price would naturally work to refill the remaining part of the dump toward 37.29 (+37.65%), but that leg becomes realistic only after strength is confirmed on the nearer steps. Throughout the route, brief bounces from 27.09 (0.00%) are possible, but the base sequence remains: first down to the lower targets, then back up to test key levels and continue the recovery through the resistance steps.
🎯 LONG: enter after a reversal from 25.09 (−7.38%)–24.66 (−8.97%) and a return above 29.98 (+10.67%) with hold; targets 30.86 (+13.92%) → 31.34 (+15.69%) → 33.40 (+23.29%) → 37.29 (+37.65%).
🎯 SHORT: priority from 27.09 (0.00%) down through 26.92 (−0.63%) to 25.09 (−7.38%) and then to 24.66 (−8.97%); take profits step-by-step.
📌 Key targets: 24.66 (−8.97%), 25.09 (−7.38%), 29.98 (+10.67%), 30.86 (+13.92%), 33.40 (+23.29%).
📍 Secondary targets: 26.92 (−0.63%), 31.34 (+15.69%), 37.29 (+37.65%), 46.83 (+72.87%).
📌 Probable route: 27.09 (0.00%) → 26.92 (−0.63%) → 25.09 (−7.38%) → 24.66 (−8.97%) → 26.92 (−0.63%) → 29.98 (+10.67%) → 30.86 (+13.92%) → 31.34 (+15.69%) → 33.40 (+23.29%) → 37.29 (+37.65%).
⏱️ Timing for the senior target: senior target 33.40 (+23.29%) from 27.09 (0.00%) with ATR(D) 3.05 (~11.26%) ≈ 2.1 days (≈2–3 sessions).
🛑 Breakdown level: acceptance below 24.66 (−8.97%) breaks the rebound scenario and opens the path lower by structure.
🧠 The best entry point is subscribing to my profile — there’s a lot of interesting content there.
BOIL in BUY ZONEMy trading plan is very simple.
I buy or sell when at either of these events happen:
* Price tags the top or bottom of parallel channel zones
* Money flow volume spikes beyond it's Bollinger Bands
So...
Here's why I'm picking this symbol to do the thing.
Price in buying zone at bottom of channels
Money flow momentum is spiked negative and at bottom of Bollinger Band
Entry at $30.25
Target is upper channel around $42
May take profit or exit around $36
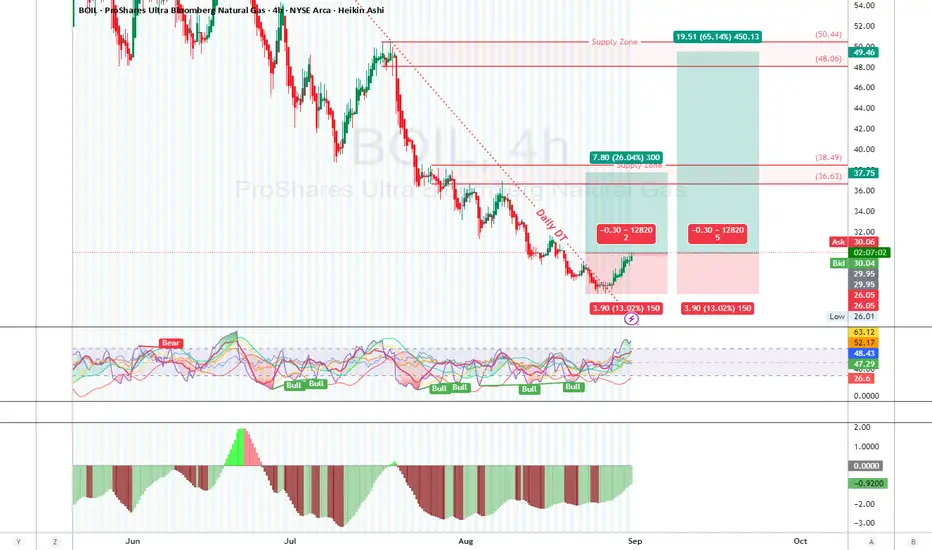
BOIL 2H Long Setup – Trend Reversal in Play
BOIL has been in a steady downtrend, capped by a clean descending trendline since mid-July. Price recently double-tapped a demand zone near the $26.00 level and printed a potential higher low. Bullish momentum is starting to creep in with volume picking up and Heikin Ashi candles showing smaller wicks to the downside—classic signs of selling exhaustion.
Supply: $36.50–$38.00 (TP zone1 near resistance )
Supply: $50.44–$48.06 (TP zone2 near resistance )
RSI Divergence
Bullish divergence spotted on RSI/Stochastic: Price made a lower low while the oscillator made a higher low.
Momentum histogram also printing green and rising — early confirmation of shift.
Trade Setup
Entry: $29.00 (Current bid/ask range)
Stop Loss: $26.20 (Below double bottom demand)
Take Profit 1 (TP1): $34.50 1:3RR
Take Profit 2 (TP2): $49.46 1:5RR
Risk Management
Max risk = 1–3% of your trading capital.
Example: $10,000 account → Risk $100–$300 max on this setup.
Trade Management
Consider moving Stop Loss to Break Even (BE) once price hits $31.80 (1:1 RR).
Scale out 50% at TP1 to secure gains, let the rest ride to TP2 with a trailing stop.
“Be fearful when others are greedy and greedy when others are fearful.”
— Warren Buffett
⚠️ Disclaimer
This analysis is for educational purposes only. Trading involves substantial risk. Always perform your own due diligence before entering any trade.
BOIL from $8.86 to $10MODs have suggested that I provide more detail about the picks I make.
Sorry. I'm not as verbose as y'all, and I don't like things to be complicated.
My trading plan is very simple.
I buy or sell at top & bottom of parallel channels.
I confirm when price hits Fibonacci levels.
Bonus if a TTM Squeeze in in play.
I hold until target is reached or end of year, when I can book a loss.
So...
Here's why I'm picking this symbol to do the thing.
Price at bottom of channel (period 52 39 & 26)
Stochastic Momentum Index (SMI) at oversold level
VBSM is negative
Impulse MACD is flat crossing over to the downside
Price at near Fibonacci level
In at $8.86
Target is $10 or channel top
Stop loss is $8.63
Bloomberg Natural Gas (BOIL)Asset Class: Indices
Income Type: Daily
Symbol: BOIL
Trade Type: Long
Trends:
Short Term: Up
Long Term: UP
Trade idea:
-Price rejection from a major Daily demand zone, forming an upward channel.
-Waited for a demand zone to form on a lower time frame (30m) .
-TP set at the SZs with a 7:1 RRR
-Consider trailing your SL or place different orders for each target.
-Apply proper risk management. max position size is 1% of your capital.
Set-Up Parameters:
Entry: 8.92
Stop: 8.53
TP 11.67 (7:1)
!!Be aware of pending Economic Reports. If price is within 20 pips of proximal value at time of major impact report, then Confirmation entry.
Trade management:
**When price hits 1:1 or T1, consider moving stop to entry in case of pullback for a risk free trade.
**Disclaimer**:
The trading strategies, ideas, and information shared are for educational and informational purposes only. They do not constitute financial advice or a recommendation to buy or sell any securities, currencies, or financial instruments. You should do your own research or consult with a licensed financial advisor before making any trading decisions. The author assumes no responsibility for any losses incurred from following these trading ideas.
BOIL breaking Resistance is $12.83 nextHere's a quick analysis of the BOIL (ProShares Ultra Bloomberg Natural Gas) chart:
1. **Current Price Movement**: BOIL has shown some volatility, with recent fluctuations indicating a potential consolidation phase.
2. **Support and Resistance Levels**:
- **Support**: The immediate support level is around $10.50, which has been tested multiple times recently.
- **Resistance**: The key resistance level to watch is around $11.50. We are breaking above this level today and holding it could signal a bullish trend.
3. **Technical Indicators**:
- **Moving Averages**: The 50-day moving average is currently below the 200-day moving average, indicating a bearish trend. However, if the price crosses above these moving averages, it could signal a reversal.
- **Relative Strength Index (RSI)**: The RSI is hovering around 45, suggesting that the stock is neither overbought nor oversold. A move above 50 could indicate increasing bullish momentum.
4. **Volume Analysis**: There has been a noticeable increase in trading volume during recent upswings, which is a positive sign. Sustained high volume on upward movements can confirm a breakout.
5. **Potential Catalysts**: Keep an eye on natural gas market trends and any geopolitical events that could impact energy prices. Positive developments in these areas could drive BOIL higher.
Overall, BOIL is at a critical juncture. If we continue to break the $11.50 resistance level with strong volume it could pave the way for further gains. Conversely, a drop below the $10.50 support level might lead to further declines.
Swing Trading Strategies Part 1: Trend ContinuationIn this two-part series, we’ll explore straightforward yet effective swing trading strategies. Part 1 focuses on a classic trend continuation strategy designed to capitalise on established market trends.
Understanding the Trend Continuation Strategy
The trend continuation strategy is built on the principle of trading in the direction of the prevailing trend. The strategy looks to capture one swing of price action that occurs following a breakout in the direction of the prevailing trend.
Whilst the strategy is likely to struggle during choppy sideways markets, the risk management and trade management components are designed to try and keep losses small during adverse conditions, while letting trades run during optimal trending conditions.
Here’s how you can implement this strategy:
Key Components of the Strategy
Entry Criteria:
• 50MA Must Be Moving Above 200MA
The first criterion for this strategy is that the 50-day moving average (MA) must be above the 200-day moving average. This indicates an established uptrend and serves as a foundational signal that the market has bullish momentum.
Past performance is not a reliable indicator of future results
• Contracting Range Has Formed
Look for a contracting range, which typically appears as a series of price movements that become progressively narrower. This pattern suggests consolidation and a potential imminent breakout in the direction of the trend.
Past performance is not a reliable indicator of future results
• Break and Close Above Contracting Range
A break and close above the contracting range is a sufficient entry trigger.
Past performance is not a reliable indicator of future results
Risk Management:
• Initial Stop Below Range
An initial stop loss is placed just below the lower boundary of the contracting range. This serves to define your risk by protecting your position in case the market moves against you.
Past performance is not a reliable indicator of future results
Trade Management:
Trailing Stop at 9EMA
Once the trade is active, use the 9-day exponential moving average (EMA) as a trailing stop. This allows you to lock in profits while giving the trade enough room to continue moving in your favour.
Past performance is not a reliable indicator of future results
Step-by-Step Guide to Executing the Strategy
1. Identify the Trend: Begin by ensuring that the 50MA is above the 200MA on your chart. This confirms that the market is in an upward trend and sets the stage for the rest of the strategy.
2. Spot the Contracting Range: Look for periods where the price forms a contracting range. This can be visualised as a series of highs and lows that are getting closer together. This pattern often precedes a significant price move.
3. Enter the Trade: Enter the trade when the price breaks out of the contracting range in the direction of the trend (i.e., upwards in this case). Ensure that the breakout is accompanied by increased volume, which indicates stronger momentum.
4. Set Your Stop Loss: Place your stop loss just below the lower boundary of the contracting range. This helps to protect your position from unexpected market reversals.
5. Implement the Trailing Stop: Once the trade moves in your favour, use the 9EMA as a trailing stop. Adjust the stop level as the 9EMA moves up, allowing you to lock in profits while giving the trade room to grow.
Example: Gold
In the example below, we can see that the gold market this year has formed several entry opportunities using this swing trading strategy. With the 50MA comfortably above the 200MA all year, prices have compressed within contracting ranges on multiple occasions. While not every breakout from compression works, the overall trend direction guided by the 50MA and 200MA crossover has provided a strong framework for identifying potential trades. By placing stops just below the lower boundary of these contracting ranges and using the 9EMA as a trailing stop, traders could have captured several upward swings.
Gold (XAU/USD) Daily Candle Chart
Past performance is not a reliable indicator of future results
Limitations of the Strategy
While effective in trending markets, this trend continuation strategy has notable limitations. It relies on clear trends, which may not always be present, leading to false signals in choppy or sideways markets. The use of moving averages like the 50MA and 200MA introduces lag, meaning traders might miss early parts of the trend. Contracting ranges can sometimes result in false breakouts, causing premature trade entries or exits. Additionally, trailing stops with the 9EMA might stop out positions during minor retracements in a strong trend. Finally, like any strategy, the trend continuation method requires discipline and consistent application to be effective, and it may not suit all trading styles or risk tolerances.
Conclusion
The trend continuation strategy leverages moving averages and price patterns to identify and capitalise on strong market trends. By focusing on a contracting range within a bullish trend, and using a trailing stop to manage risk, this strategy offers a disciplined approach to swing trading.
In the next part of our series, we’ll explore another straightforward yet effective swing trading strategy.
Disclaimer: This is for information and learning purposes only. The information provided does not constitute investment advice nor take into account the individual financial circumstances or objectives of any investor. Any information that may be provided relating to past performance is not a reliable indicator of future results or performance. Social media channels are not relevant for UK residents.
Spread bets and CFDs are complex instruments and come with a high risk of losing money rapidly due to leverage. 83.51% of retail investor accounts lose money when trading spread bets and CFDs with this provider. You should consider whether you understand how spread bets and CFDs work and whether you can afford to take the high risk of losing your money.
BOIL in strong downtrendBOIL is in a strong downtrend.
The daily chart has hit a new low
But the 1-hour chart has now become "extended"
Remember there are 5 waves in an average trend. Once the trend becomes extended, the price likes to break above the 50 SMA to "recalculate" and continue or "recalculate" and reverse.
We love both right? The question becomes, which direction will the market choose?
No one knows. So all you can do is trade your strategy off of the current patterns and information that you see.
That's why 'risk management" is so important. Use 1% of your current total account value on each trade.
That's formula I use in my trade plan and it has served me well.
Link in profile :)
That's all you can do.
BOIL trends up continuation expected LONGBOIL is here on a 30 minute chart. It has reversed this week and ascended 13% with a double
bottom at 13 and 13.25 forming a resing support trendline. Volumes changed from selling
to buying. Price bounced off the ATR- stop loss in its pullback and now appears poised to
break through the moving average channel and get support after that cross-over.
I will take a long trade here with a stop loss of the pivot low of 14 while targeting the
upper boundary of the Keltner channel at 15.25 for two-thirds the position with the remainder
to run to try to reach 37 , the pivot high of January. As a leveraged instrument, BOIL is very
volatile and needs extra care in the trade.
BOIL is about to make a big move this springThis stock is deeply oversold on the daily, weekly and monthly charts.
As you can see, it's about to squeeze out of this long downtrend.
We all know BOIL is not a long-term hold because of its futures rolling decay; but this year it could be a huge winner with Natural Gas near it's all-time lows and also deeply oversold.
BOIL: Set for a Potential Bullish Reversal at Bullish Shark PCZNatural Gas on an intra-week basis seems to be in a position to Bullishly Reverse as it sits at the PCZ of a potential Bullish Shark with slight Bullish Divergence near the previous month's low. My target will be anywhere between $16 and $20 though it could always go higher.
BOIL- Premarket Long Trade Scalp RecapsBOIL is here on the 15- minute chart with a set of Bollinger Bands, a Bollinger Band Oscillator by
LuxAlgo as well as a dual-time frame RSI indicator by Chris Moody. The settings for the Bollinger
Band set up are period 49 EMA 14 standard deviations 2 /2.618 ( These are multiples of 7 and
Fib #s for mathematical reasons.
Entries are signal is price crossing the base line of the Bollinger Bands ( the EMA 14) or else
the RSI lines crossing over the 50 level and green above red.
Exits are the price action going outside the outer upper BB band and then fading back inside
of both inner and outer bands or RSI green and red crossing such that green fades quicker than
red. Entries and exits are managed with alerts/notifications to minimize screen time.
The first trade began on 2/27 at 8:10 AM ended 2hours later. 50 shares taken gained $ 1.50 each
for a total of $75.00 realized profit in the long scalp. The second trade on 2/28 was
taken in the premarket at 6:45 AM EST with again 50 shares taken then closed at 9:15 AM
for a 150 minute trade. Realized profit was $1.20 per share and $60 overall.
Overall, there were 4.5 hours in the trades yielding $135.00 or $30 hr for the time in the trade.
Risk was minimal as trades were taken at the lows with a stop loss outside the BB and below
them. Time spent on the screen amounted to less than 30 minutes overall making the
realized profit excellent for the time and effort expended. This idea illustrates good use
of a Bollinger Band strategy coupled with alerts and notifications. Notably, I did not spend
any effor adjusting the stop losses during the trade as I am very confident of the setup and
the strategy. Today is another day for the same trade.
BOIL 3X / Triple Leveraged Natural Gas ETFon the 4H chart is showing a round bottom reversal at the bottom of the high voume area
and rose over the POC line of the intermediate-term voume profile. Price now has room for
a 50% move to the top of the high volume area at $ 52. The chart shows the relative
volume indicator supports a long buy as does the dual time frame RSI.
A speculative call option trade would be $60 in 4 months while a safer call option
would be in the money @ $30 in 7-9 weeks. I am also looking at UNG, LNG and XNGUSD on
forex.
BOIL is starting to get hot ( 3X Natural Gas ETF)as shown on the 15 minute chart is rising in an ascending parallel channel and is suitable
for a long buy entry when the indicators are triggered. The onslaught of winter cold, the
sanctions against Russian gas exports and inflationary pressure on commodities all bode well
for the trend up for natural gas on forex and equities markets. See also my idea linked below
for a view of the chart from the 4H time frame.
BOIL ( Natural Gas Futures 3X leveraged) heats up LONGBOIL in the past month fell from a head and shoulders pattern on the 15 minute time frame
into a trend down which leveled out into a double bottom. Supply is in a draw
down right now as might be expected when gas production is diminished in the middle of winter
while demand is rising. The Economics 101 expectation is rising prices on the futures market.
The chart shows a Fibonacci retracement would take price from its current level to about 29
or about 20% upside if that level holds and more if prices can make a stronger more or
if short positions or puts are forced to closed causing some buying pressure synergy.
The RSI indicator confirms the reversal at the double bottom and adds a bit of insurance
to the risk. Accordingly, I am expecting a 20% in the next 2-3 weeks. Target for 2/3 of
the position is 29 while the other 1/3 ( short squeeze scenario) to run to a target of 33
which is the neckline of the H & S pattern. Taking a look at OTM call options striking
$ 30-31 range. Additionally, I will watch the AI algo indicator for a Sell Signal and reassess the
position at that time given its 90% accuracy at this given time frame as evidenced by
a 2000 candle backtest ( or about 500 hours or 82 trading days). Energy may not be the hottest
sector right now but nor is it the coldest.
BOIL reverses from a quick downtrend LONGBOIL on may 9th went into hard resistance in the highest VWAP line area, the Hull moving
averages did a death cross and it fell 12% into the support of the first upper standard
deviation line where it double bottomed with a reversal. The ZL MACD shows lines and
trends that are confirmatory. As a result, I have closed my short trade from my prior
idea and revested the capital gained into a long position of stock and calls. If you
are interested in knowing targets or stop losses, please leave a comment.
BOIL .. Time to put this back on the stove ??Boil.. after several false starts, I think we are close for a reversal on BOIL, primarily as NatGas gets a bid.
(Colder weather please)
This tradeable is very volatile so be careful.
In other words you date this... not marry it !
Have a tight stop and game plan.
Do your own due diligence.
Good Luck
S.